|
시장보고서
상품코드
2122734
임상시험 이미징 : 시장 점유율 분석, 업계 동향 및 통계, 성장 예측(2026-2031년)Clinical Trial Imaging - Market Share Analysis, Industry Trends & Statistics, Growth Forecasts (2026 - 2031) |
||||||
 Mordor Intelligence
Mordor Intelligence에 의하면, 임상시험 이미징 시장 규모는 2025년 13억 2,000만 달러로 평가되었습니다. 2026년에는 14억 2,000만 달러로 확대되어 2026-2031년에 걸쳐 CAGR 7.47%로 성장을 지속하여, 2031년에는 20억 4,000만 달러에 이를 것으로 예측됩니다.

본 보고서는 제품 및 서비스(임상시험 설계 컨설팅 서비스, 기타), 모달리티(자기공명영상법(MRI), 기타), 임상시험 단계(1상, 기타), 최종 사용자(제약·바이오기술 기업, 기타), 치료 분야(종양학, 기타),지역(북미, 유럽, 아시아태평양, 기타)별로 분류되어 있습니다. 시장 예측은 금액(달러) 기준으로 제시되어 있습니다.
세계의 임상시험 이미징 시장 동향 및 인사이트
제약·바이오기술 산업의 연구개발비 증가
주요 제약 기업의 연구개발(R&D) 예산은 2024년에 9.7% 증가했으며, 파이프라인은 현재 8,000건 이상의 유효 자산을 넘어선 만큼, 치료 효과를 객관적으로 추적할 수 있는 영상 평가 지표에 대한 수요가 높아지고 있습니다. 2030년까지 신규 승인 건수의 60% 이상을 차지할 것으로 예상되는 생물학적 제제 및 유전자 치료의 경우, 분자 수준의 시각화가 필요한 경우가 많아, 후원 기업들은 첨단 영상 공동 연구실의 지원을 확보해야 하는 압박을 받고 있습니다. 일라이 릴리(Eli Lilly)와 같은 대기업들은 GLP-1 프로그램에 대한 투자를 확대하고 있으며, 각 프로토콜에는 대사 및 심혈관 매개변수를 모니터링하기 위한 특수한 MRI 및 PET 구성 요소가 포함되어 있습니다. 아웃소싱이 확대되는 가운데, 대륙을 넘나들며 영상 서비스를 확장할 수 있는 공급업체들이 주목받고 있으며, 연구개발 담당 임원의 80% 이상이 외부 파트너에 대한 지출을 두 자릿수 성장률로 늘릴 계획을 세우고 있습니다. 이러한 자금 조달의 모멘텀은 임상시험 이미징 시장에 장기적인 호재로 작용하고 있습니다.
계약연구기관(CRO)에 대한 영상 서비스 아웃소싱 확대
2023년 CRO의 매출액은 521억 9,000만 달러에 달했습니다. 이는 제약 기업들이 고정 비용을 절감하고 검사 수행 속도를 높이기 위해 외부 영상 전문 지식을 활용하는 전략적 전환을 반영한 것입니다. ICON만 해도 2024년에 99억 7,400만 달러의 신규 수주를 보고했으며, 이는 프로토콜 표준화, 실시간 품질 관리(QC), AI를 통한 자동 분석이 가능한 통합형 영상 네트워크에 대한 의뢰사의 높은 수요를 여실히 보여주고 있습니다. 아웃소싱을 통해 영상 데이터를 일원화하고, 미리 정의된 판독 알고리즘을 적용함으로써 검사 기간을 최대 30% 단축할 수 있습니다. 이러한 이점은 지역 의료기관이나 환자의 자택에서 스캔 데이터를 수집하는 하이브리드형 또는 분산형 모델에서 더욱 두드러집니다. 각 CRO 기업들은 텔레라디올로지, 안과 영상, 정량적 바이오마커 플랫폼 부문에서의 표적 인수를 통해 수요에 대응하며, 치료 분야를 넘나들며 서비스 범위를 넓혀가고 있습니다.
영상 장비의 높은 설비 투자 및 운영 비용
최첨단 PET-MRI 시스템의 가격은 400만-600만 달러에 달하며, 광자 계수형 CT 플랫폼의 경우 설치, 차폐, 유지보수 비용이 추가되기 전에 200만-300만 달러의 부담이 발생합니다. 핵의학 프로그램에는 엄격한 cGMP 기준을 충족하는 현장 방사성 의약품 시설이 필요하며, 이로 인해 초기 투자 총액은 많은 지역 CRO 및 학술 기관의 핵심 연구소 예산을 훨씬 초과합니다. 하드웨어의 급속한 교체 주기는 ROI(투자 수익률) 산정을 더욱 복잡하게 만들고 있으며,규모의 경제를 확보하기 위해 어피니티 에쿼티 파트너스가 루마스 이미징을 6억 5,800만 달러에 인수한 사례에서 볼 수 있듯이, 이해관계자들을 합병이나 전략적 제휴로 내몰고 있습니다.
부문별 분석
2025년, 이미징 소프트웨어는 임상시험 이미징 시장의 31.85%를 차지하며 전 세계 검사 현장의 데이터 흐름에서 중추적인 위치를 확고히 다졌습니다. 이러한 플랫폼은 품질 관리(QC)를 자동화하고, 데이터 세트를 익명화하며, 전자 데이터 수집(EDC) 시스템과 원활하게 통합함으로써 오류율을 줄이고 일관성을 보장합니다. 매출 측면에서 이 부문은 임상시험 이미징 시장 규모에서 가장 큰 점유율을 차지하고 있으며, AI 모듈이 시범 단계에서 본격적인 운영 단계로 전환됨에 따라 그 영향력은 더욱 확대될 것으로 보입니다. SaaS 도입 모델의 부상으로 예산이 자본 지출(Capex)에서 운영 비용(OpEx)으로 이동하고 있으며, 막대한 인프라 투자를 수반하지 않으면서 확장성을 추구하는 중소규모 스폰서에게 매력적인 선택지가 되고 있습니다.
한편, 영상 바이오마커 개발 서비스는 규제 당국이나 보험사를 설득할 수 있는 검증된 정량적 평가 지표에 대한 수요 증가를 반영하여 연평균 성장률(CAGR) 9.21%로 확대될 것으로 예측됩니다. 이러한 급증의 배경에는 신속 승인 과정에서 영상 바이오마커의 가치를 강조하는 FDA의 노력과, 치료 반응을 정밀하게 측정해야 하는 맞춤형 치료로의 전환이 있습니다. 소프트웨어, 바이오마커 과학, 규제 컨설팅을 융합한 벤더들은 수익성이 높은 프로젝트를 수주하고 있으며, 이는 임상시험 이미징 시장의 이 성장 부문에서 경쟁을 심화시키고 있습니다.
컴퓨터 단층 촬영(CT)은 높은 보급률, 빠른 촬영 시간, 고형암 검사에서 입증된 역할 덕분에 2025년 임상시험 이미징 시장에서 24.70%의 점유율을 차지했습니다. 이러한 우위는 보험 환급 지원 및 영상의학 전문의의 폭넓은 숙련도에 기인하며, 이는 대규모 3상 임상시험에 필수적인 요소입니다. 스폰서들이 연조직의 변화를 더 선명하게 포착할 수 있는 저선량 광자 계수 시스템 및 하이브리드 영상으로 전환함에 따라, 이 모달리티의 점유율은 점차 감소하고 있습니다.
양전자 방출 단층 촬영(PET)은 2031년까지 연평균 성장률(CAGR) 9.29%를 나타낼 것으로 예측되며, 이는 각 모달리티 중 가장 높은 성장률입니다. 이러한 성장은 포도당 대사에 그치지 않고, 세포 표면 수용체, 저산소증 마커,아밀로이드 응집체를 표적으로 하는 신규 방사성 추적자의 파이프라인에 달려 있습니다. 해부학적 변화에 앞서 분자 수준의 변화를 감지하는 PET의 민감도는 초기 용량-반응 검사나 적응형 검사 설계에서 매우 귀중한 요소입니다. 방사선 피폭량을 줄이고 처리 능력을 높이는 전신용 PET 스캐너의 보급은 그 매력을 한층 더 높여, 임상시험 이미징 시장에서 그 역할을 확대시키고 있습니다.
지역별 분석
북미는 성숙한 보험 환급 제도, 산학 협력의 긴밀한 네트워크, 영상 진단 엔드포인트를 규정하는 명확한 FDA 지침을 배경으로 2025년에는 전 세계 매출의 38.10%를 차지했습니다. 또한, 미국에는 상위 20개 제약 스폰서 중 다수가 거점을 두고 있어, 치료 영역을 넘나들며 확장 가능한 고처리량 핵심 연구소에 대한 국내 수요를 뒷받침하고 있습니다. 사모펀드의 투자 및 인수(RadNet은 2024년에 인수 대상 기업에 5,400만 달러를 투자했습니다)를 통해 영상 분석 역량의 통합과 AI 플랫폼 통합이 진행되면서, 이 지역의 경쟁 우위가 더욱 강화되고 있습니다.
아시아태평양은 효율화된 윤리 심사 승인 절차와 매력적인 비용 구조에 힘입어 2031년까지 8.55%라는 지역별 최고 연평균 성장률(CAGR)을 달성할 것으로 예측됩니다. 일본, 한국, 싱가포르의 규제 당국은 임상시험 신청을 통상 6개월 이내에 확정하고 있어, 기존 시장에 비해 시험 개시 기간을 단축하고 있습니다. 우시 앱텍(Wuxi AppTec)과 같은 현지 CRO는 광범위한 시험 시설 네트워크와 다국적 프로그램 수용을 뒷받침하는 정부의 우대 조치를 활용하여, 국내 및 유럽·미국의 후원사 모두에게 서비스를 제공하는 영상 부문의 규모를 확대되고 있습니다. 분산형 임상시험, 원격 방사선 진단, BYOD(Bring Your Own Device)형 영상 앱의 인기가 높아짐에 따라, 임상시험 이미징 시장에서 아시아태평양의 역할이 더욱 강화되고 있습니다.
유럽은 2025년 1월까지 임상시험 정보 시스템(CTIS)의 전면적인 이용을 의무화하는 EU 임상시험 규정(CTR)으로의 전환기에 있으며, 이 두 극단 사이의 중간에 위치하고 있습니다. 통합 포털을 통해 30개국에 걸친 신청 심사 일관성이 확보되고, 국경을 넘는 영상 프로토콜에 따른 행정적 부담이 줄어들 것으로 예측됩니다. 그러나 방사성 의약품 취급 및 데이터 개인정보 보호에 관한 규정 차이는 특히 독일과 프랑스에서 여전히 장벽으로 작용하고 있습니다. EMA(유럽의약품청)가 AI에 관한 고찰 문서를 공표하고 검증에 대한 기대 사항을 명확히 하려는 것은 운영 측면에서의 실행이 진화하는 와중에도 유럽이 거버넌스에서 주도적인 입장을 유지하려 하고 있음을 보여줍니다.
기타 혜택
- 엑셀 형식 시장 예측(ME) 시트
- 3개월간의 애널리스트 지원
자주 묻는 질문
목차
제1장 서론
제2장 조사 방법
제3장 주요 요약
제4장 시장 구도
제5장 시장 규모 및 성장 예측
제6장 경쟁 구도
제7장 시장 기회 및 향후 전망
KTH 26.09.08According to Mordor Intelligence, the clinical trial imaging market size is expected to grow from USD 1.32 billion in 2025 to USD 1.42 billion in 2026 and is forecast to reach USD 2.04 billion by 2031 at 7.47% CAGR over 2026-2031.
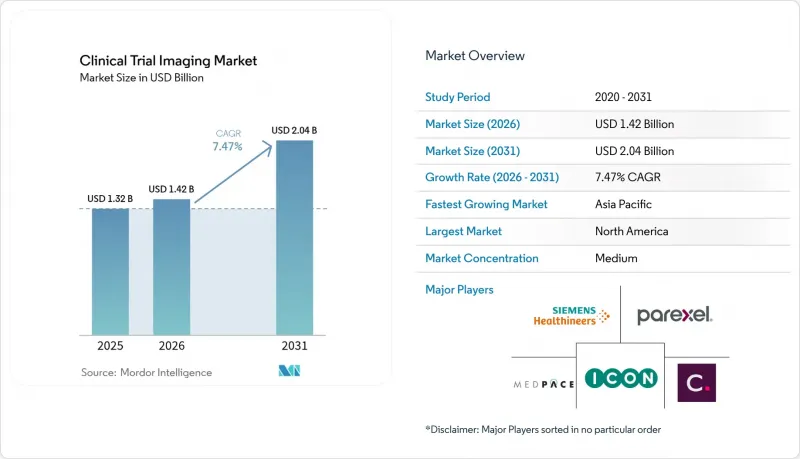
This report is Segmented by Product & Service (Trial Design Consulting Services, and More), Modality (Magnetic Resonance Imaging, and More), Phase of Clinical Trial (Phase I, and More), End-User (Pharmaceutical & Biotechnology Companies, and More), Therapeutic Area (Oncology, and More), Geography (North America, Europe, Asia-Pacific, and More). The Market Forecasts are Provided in Terms of Value (USD).
Global Clinical Trial Imaging Market Trends and Insights
Increasing Pharmaceutical and Biotechnology R&D Expenditure
R&D budgets climbed 9.7% in 2024 among large drug makers, and pipelines now exceed 8,000 active assets, deepening demand for imaging endpoints that objectively track therapeutic impact. Biologics and gene therapies-expected to represent more than 60% of new approvals by 2030-often require molecular-level visualization, pushing sponsors to secure sophisticated imaging core lab support. Leading firms such as Eli Lilly have extended investments in GLP-1 programs, and each protocol embeds specialized MRI or PET components to monitor metabolic and cardiovascular parameters. As outsourcing grows, suppliers able to scale imaging services across continents stand out, with over 80% of R&D executives planning double-digit spending increases on external partners. This funding momentum anchors a long-term tailwind for the clinical trial imaging market.
Growing Outsourcing of Imaging Services to Contract Research Organizations
CRO revenues hit USD 52.19 billion in 2023, reflecting a strategic pivot by drug developers toward external imaging expertise to cut fixed costs and speed trial execution. ICON alone reported USD 9.974 billion in new business wins during 2024, underscoring sponsor appetite for integrated imaging networks capable of protocol harmonization, real-time QC, and automated AI analytics. Outsourcing can trim study timelines by up to 30% by centralizing image data and applying predefined read algorithms, advantages magnified in hybrid and decentralized models that collect scans from community sites and patients' homes. CROs are matching demand with targeted acquisitions in teleradiology, ophthalmic imaging, and quantitative biomarker platforms to widen service breadth across therapeutic areas.
High Capital Investment and Operational Costs of Imaging Equipment
State-of-the-art PET-MRI systems can cost USD 4-6 million, and photon-counting CT platforms add another USD 2-3 million burden before siting, shielding, and maintenance are factored in. Nuclear medicine programs require on-site radiopharmaceutical facilities that meet stringent cGMP standards, lifting total start-up spending far beyond many regional CROs or academic core labs. Rapid hardware cycles further complicate ROI calculations, pushing stakeholders toward mergers or strategic alliances, as seen in Affinity Equity Partners' USD 658 million purchase of Lumus Imaging aimed at gaining scale economies.
Other drivers and restraints analyzed in the detailed report include:
- Technological Advancements in Medical Imaging Modalities
- Rising Adoption of Artificial Intelligence in Clinical Trial Imaging
- Shortage of Skilled Imaging Professionals
For complete list of drivers and restraints, kindly check the Table Of Contents.
Segment Analysis
Imaging software accounted for 31.85% of the clinical trial imaging market in 2025, cementing its status as the backbone of data flow across global sites. These platforms automate QC, anonymize datasets, and integrate seamlessly with electronic data capture systems, lowering error rates and ensuring consistency. In revenue terms, the segment formed the largest slice of the clinical trial imaging market size, and its influence will grow as AI modules move from pilot to production. The rise of SaaS deployment models is shifting budgets from capex to opex, appealing to small and mid-sized sponsors seeking scalability without heavy infrastructure outlay.
Imaging biomarker development services, meanwhile, are projected to expand at a 9.21% CAGR, reflecting escalating demand for validated, quantitative endpoints capable of persuading regulators and payers. Underpinning this surge are FDA initiatives that underscore the value of imaging biomarkers in accelerated approvals, and the movement toward personalized therapies that require sensitive measures of treatment response. Vendors that fuse software, biomarker science, and regulatory consulting are capturing higher-margin projects, intensifying competition in this growth pocket of the clinical trial imaging market.
Computed tomography held 24.70% of the clinical trial imaging market in 2025 thanks to its ubiquity, rapid acquisition times, and validated role in solid tumor trials. Its dominance also stems from reimbursement support and wide reader familiarity, factors essential to large phase III studies. Even so, the modality's share is slowly eroding as sponsors pivot to lower-dose photon-counting systems and hybrid imaging that better resolve soft-tissue changes.
Positron emission tomography is expected to post a 9.29% CAGR through 2031, the fastest among modalities. Growth hinges on a pipeline of novel radiotracers that move beyond glucose metabolism to target cell-surface receptors, hypoxia markers, and amyloid aggregates. PET's sensitivity in detecting molecular changes ahead of anatomical shifts makes it invaluable for early dose-response studies and adaptive trial designs. The spread of total-body PET scanners, which cut dose and bolster throughput, further sharpens its appeal and enlarges its role within the clinical trial imaging market.
Complete Report Scope:
- By Product & Service
- Trial Design Consulting Services
- Read Analysis Services
- Operational Imaging Services
- Imaging Software
- Imaging Data-management Services
- Imaging Biomarker Development Services
- By Modality
- Magnetic Resonance Imaging
- Computed Tomography
- Positron Emission Tomography
- Ultrasound
- Echocardiography
- Other Modalities
- By End-User
- Pharmaceutical & Biotechnology Companies
- Contract Research Organizations
- Medical Device Manufacturers
- Academic & Government Research Institutes
- By Therapeutic Area
- Oncology
- Neurology
- Cardiology
- Endocrinology & Metabolic Disorders
- Rare Diseases
- Other Therapeutic Areas
- By Phase of Clinical Trial
- Phase I
- Phase II
- Phase III
- Phase IV
- Geography
- North America
- United States
- Canada
- Mexico
- Europe
- Germany
- United Kingdom
- France
- Italy
- Spain
- Rest of Europe
- Asia-Pacific
- China
- Japan
- India
- Australia
- South Korea
- Rest of Asia-Pacific
- Middle East & Africa
- GCC
- South Africa
- Rest of Middle East & Africa
- South America
- Brazil
- Argentina
- Rest of South America
- North America
Geography Analysis
North America retained 38.10% of global revenue in 2025 on the strength of mature reimbursement systems, a dense network of academic-industrial partnerships, and clear FDA guidance governing imaging endpoints. The United States also hosts many of the top 20 pharma sponsors, amplifying domestic demand for high-throughput core labs that can scale across therapeutic franchises. Private-equity investments and acquisitions-RadNet spent USD 54 million on targets in 2024-are consolidating imaging capacity and integrating AI platforms, deepening the region's competitive moat.
Asia-Pacific is projected to deliver the highest regional CAGR at 8.55% through 2031, propelled by streamlined ethics approvals and attractive cost structures. Regulatory agencies in Japan, South Korea, and Singapore routinely finalize clinical trial applications within six months, shortening study start-up compared with legacy markets. Local CROs such as Wuxi AppTec have scaled imaging units that serve domestic and Western sponsors alike, leveraging broad site networks and government incentives to host multinational programs. The growing popularity of decentralized trials, tele-radiology, and bring-your-own-device imaging apps augments APAC's role in the clinical trial imaging market.
Europe sits between these poles as it transitions to the EU CTR, which mandates full use of the Clinical Trials Information System by January 2025. The unified portal promises consistent application reviews across 30 countries and should lower administrative overhead on cross-border imaging protocols. Yet divergent rules governing radiopharmaceutical handling and data privacy remain obstacles, particularly in Germany and France. Efforts by the EMA to publish an AI reflection paper and clarify validation expectations indicate that Europe aims to retain a leadership position in governance even as operational execution evolves.
- Clario
- Icon plc
- IXICO
- Parexel International Corp.
- Medpace Holdings, Inc.
- Navitas Clinical Research
- WorldCare Clinical LLC
- Radiant Sage
- Resonance Health
- WCG (WIRB-Copernicus Group)
- Siemens Healthineers
- GE HealthCare Technologies Inc.
- Calyx
- Signant Health
- Imaging Endpoints
- Perspectum Diagnostics
- BioClinica Inc.
- Collective Minds Research (CMRAD)
Additional Benefits:
- The market estimate (ME) sheet in Excel format
- 3 months of analyst support
TABLE OF CONTENTS
1 Introduction
- 1.1 Study Assumptions & Market Definition
- 1.2 Scope of the Study
2 Research Methodology
3 Executive Summary
4 Market Landscape
- 4.1 Market Overview
- 4.2 Market Drivers
- 4.2.1 Increasing Pharmaceutical and Biotechnology R&D Expenditure
- 4.2.2 Growing Outsourcing of Imaging Services to Contract Research Organizations
- 4.2.3 Technological Advancements in Medical Imaging Modalities
- 4.2.4 Rising Adoption of Artificial Intelligence in Clinical Trial Imaging
- 4.2.5 Growth in Oncology and Neurology Clinical Trials
- 4.2.6 Expansion of Decentralized and Hybrid Clinical Trial Models
- 4.3 Market Restraints
- 4.3.1 High Capital Investment and Operational Costs of Imaging Equipment
- 4.3.2 Shortage of Skilled Imaging Professionals
- 4.3.3 Stringent Regulatory and Data Privacy Requirements
- 4.3.4 Lack of Standardized Imaging Protocols Across Trial Sites
- 4.4 Regulatory Landscape
- 4.5 Porter's Five Forces
- 4.5.1 Threat of New Entrants
- 4.5.2 Bargaining Power of Buyers/Consumers
- 4.5.3 Bargaining Power of Suppliers
- 4.5.4 Threat of Substitute Products
- 4.5.5 Intensity of Competitive Rivalry
5 Market Size & Growth Forecasts (Value, USD)
- 5.1 By Product & Service
- 5.1.1 Trial Design Consulting Services
- 5.1.2 Read Analysis Services
- 5.1.3 Operational Imaging Services
- 5.1.4 Imaging Software
- 5.1.5 Imaging Data-management Services
- 5.1.6 Imaging Biomarker Development Services
- 5.2 By Modality
- 5.2.1 Magnetic Resonance Imaging
- 5.2.2 Computed Tomography
- 5.2.3 Positron Emission Tomography
- 5.2.4 Ultrasound
- 5.2.5 Echocardiography
- 5.2.6 Other Modalities
- 5.3 By End-User
- 5.3.1 Pharmaceutical & Biotechnology Companies
- 5.3.2 Contract Research Organizations
- 5.3.3 Medical Device Manufacturers
- 5.3.4 Academic & Government Research Institutes
- 5.4 By Therapeutic Area
- 5.4.1 Oncology
- 5.4.2 Neurology
- 5.4.3 Cardiology
- 5.4.4 Endocrinology & Metabolic Disorders
- 5.4.5 Rare Diseases
- 5.4.6 Other Therapeutic Areas
- 5.5 By Phase of Clinical Trial
- 5.5.1 Phase I
- 5.5.2 Phase II
- 5.5.3 Phase III
- 5.5.4 Phase IV
- 5.6 Geography
- 5.6.1 North America
- 5.6.1.1 United States
- 5.6.1.2 Canada
- 5.6.1.3 Mexico
- 5.6.2 Europe
- 5.6.2.1 Germany
- 5.6.2.2 United Kingdom
- 5.6.2.3 France
- 5.6.2.4 Italy
- 5.6.2.5 Spain
- 5.6.2.6 Rest of Europe
- 5.6.3 Asia-Pacific
- 5.6.3.1 China
- 5.6.3.2 Japan
- 5.6.3.3 India
- 5.6.3.4 Australia
- 5.6.3.5 South Korea
- 5.6.3.6 Rest of Asia-Pacific
- 5.6.4 Middle East & Africa
- 5.6.4.1 GCC
- 5.6.4.2 South Africa
- 5.6.4.3 Rest of Middle East & Africa
- 5.6.5 South America
- 5.6.5.1 Brazil
- 5.6.5.2 Argentina
- 5.6.5.3 Rest of South America
- 5.6.1 North America
6 Competitive Landscape
- 6.1 Market Concentration
- 6.2 Market Share Analysis
- 6.3 Company Profiles (includes Global level Overview, Market level overview, Core Business Segments, Financials, Headcount, Key Information, Market Rank, Market Share, Products and Services, and analysis of Recent Developments)
- 6.3.1 Clario
- 6.3.2 Icon plc
- 6.3.3 IXICO plc
- 6.3.4 Parexel International Corp.
- 6.3.5 Medpace Holdings, Inc.
- 6.3.6 Navitas Clinical Research
- 6.3.7 WorldCare Clinical LLC
- 6.3.8 Radiant Sage LLC
- 6.3.9 Resonance Health
- 6.3.10 WCG (WIRB-Copernicus Group)
- 6.3.11 Siemens Healthineers AG
- 6.3.12 GE HealthCare Technologies Inc.
- 6.3.13 Calyx
- 6.3.14 Signant Health
- 6.3.15 Imaging Endpoints
- 6.3.16 Perspectum Diagnostics
- 6.3.17 BioClinica Inc.
- 6.3.18 Collective Minds Research (CMRAD)
7 Market Opportunities & Future Outlook
- 7.1 White-space & Unmet-Need Assessment