|
시장보고서
상품코드
2122739
5G 인프라 시장 : 시장 점유율 분석, 업계 동향 및 통계, 성장 예측(2026-2031년)5G Infrastructure - Market Share Analysis, Industry Trends & Statistics, Growth Forecasts (2026 - 2031) |
||||||
 Mordor Intelligence
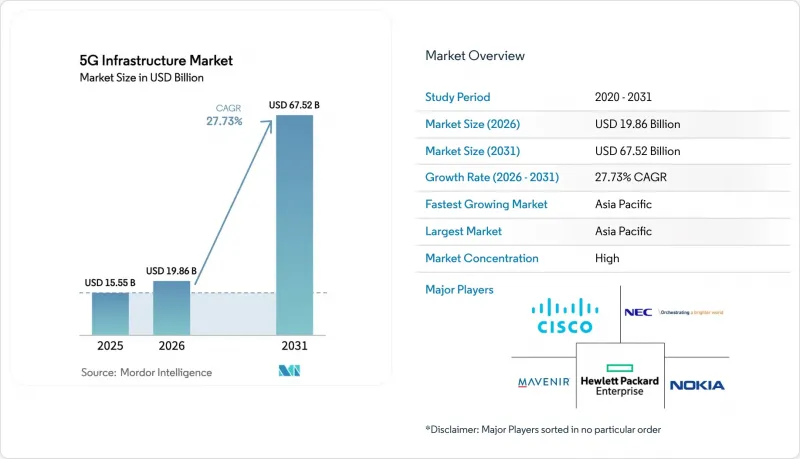
Mordor Intelligence에 의하면, 2026년 5G 인프라 시장 규모는 198억 6,000만 달러로 추정되고, 2025년 155억 5,000만 달러에서 확대해, 2031년에는 675억 2,000만 달러에 이를 것으로 예측됩니다.
2026-2031년 연평균 성장률(CAGR) 27.73%로 성장할 것으로 전망됩니다.
본 보고서는 통신 인프라별(5G 무선 액세스 네트워크, 5G 코어 네트워크, 전송/XHaul(프론트, 미드, 백홀) 등), 주파수 대역별(저주파 대역, 중주파 대역 등), 네트워크 아키텍처별(비독립형(NSA) 등), 코어 네트워크 기술별(소프트웨어 정의 네트워크(SDN) 등), 최종 사용자 산업별(소비자용 전자기기 등) 및 지역별로 분류되어 있습니다.
세계의 5G 인프라 시장 동향 및 인사이트
M2M 및 IoT 기기 밀도 증가
스탠드얼론형 5G에서는 각 셀 사이트가 최대 5만 대의 연결 기기를 처리할 수 있으며, 이는 인더스트리 4.0의 생산 라인이나 대규모 센서 그리드에 있어 필수적인 요건입니다. 현대자동차의 RedCap 지원 공장 네트워크는 기능이 제한된 기기라도 커버리지를 저해하지 않으면서 전력 소비를 줄일 수 있음을 입증했습니다. 엣지 컴퓨팅은 계산 자원을 기계 근처에 배치함으로써 로봇 공학 및 예측 유지보수 체계에 필요한 밀리초 단위의 지연 범위 내에 머물게 합니다. 자동차, 의료, 중공업 분야의 사설 네트워크 실증 실험은 일반 소비자용 휴대전화가 아닌, 디바이스 밀도가 높은 환경에서 얻을 수 있는 수익 확대 가능성을 뒷받침하고 있습니다. 이러한 요인이 예측 기간 동안 스몰 셀 및 엣지 데이터센터에 대한 지속적인 투자를 뒷받침하는 기반이 되고 있습니다.
모바일 데이터 소비량의 급증
클라우드 게임, 증강현실(XR) 동영상, AI 기반 스트리밍이 안정적인 멀티 기가비트급 연결을 필요로 함에 따라, 월간 모바일 트래픽은 계속해서 사상 최고치를 경신하고 있습니다. 영국의 Three UK는 2024년 말 피크 트래픽이 2 Tbit/s를 넘어섬에 따라 백본 처리량을 9 Tbit/s로 높였습니다. 중국에서는 규제 당국이 2030년까지 국내 트래픽이 4배 증가할 것으로 예측하고 있으며, 통신 사업자들은 하루 종일 높은 부하가 지속되더라도 효율성을 유지할 수 있는 용량 아키텍처로의 전환을 추진하고 있습니다. 실시간 원격 초음파 검사 시연 등 의료 분야의 실증 실험은 미션 크리티컬한 영상 전송에서 업링크 용량의 중요성을 부각시키고 있습니다. 또한, 인도와 미국에서 FWA(고정 무선 액세스)가 보급됨에 따라 트래픽이 스마트폰에서 CPE(고객 단말 장비)로 이동하고 있으며, 통신 사업자들은 ‘가정 우선’의 동영상 시청 습관에 대응하기 위해 백홀 재설계를 서둘러야 하는 상황에 처해 있습니다.
RAN의 고밀도화 및 광섬유 백홀의 높은 초기 비용
사이트당 1만-5만 달러에 달하는 스몰 셀 비용과 20만 달러에 이르는 매크로셀 지출로 인해, 특히 mm파가 필수적인 지역에서는 고밀도 5G 네트워크 구축에 막대한 자본이 필요합니다. 광섬유 백홀은 프로젝트 예산의 30%를 차지할 가능성이 있으며, 교외 구간의 굴착 공간 부족으로 인해 도랑 파기 공사 일정이 지연되고 있습니다. 2023년, 전 세계 통신 업계의 설비 투자(CAPEX)는 2017년 이후 처음으로 감소세로 돌아섰으며, CFO들은 구축 가속화에 신중한 태도를 보이고 있습니다. 네트워크 공유 계약을 통해 최대 40%의 비용 절감이 가능하지만, 각 파트너가 프리미엄 차별화를 어필할 수 있는 능력은 저하됩니다. 사업자 1곳당 10억 달러를 초과하는 주파수 라이선스 비용은 대차대조표의 여유를 더욱 압박하고 있습니다.
부문 분석
통신 사업자들이 고밀도 매크로셀 및 스몰셀 네트워크를 구축한 결과, 2025년에는 RAN(무선 액세스 네트워크) 장비가 5G 인프라 시장에서 가장 큰 점유율을 차지하며 매출의 36.30%를 차지한 것으로 평가되었습니다. 이러한 초기 하드웨어 도입의 물결로 인해 RAN의 중요성은 유지되겠지만, 향후 수익화는 소프트웨어 정의 제어에 좌우될 것이므로 코어 네트워크는 연평균 성장률(CAGR) 31.10%로 다른 계층을 능가하는 성장을 이룰 것입니다. 스탠드얼론 방식의 전개에 따라, 사용자 플레인 및 제어 플레인의 기능을 가상화하는 듀얼 모드 패킷 코어의 도입이 필수적이기 때문에 코어 플랫폼의 5G 인프라 시장 규모는 급속히 확대될 전망입니다. 보더폰 스페인(Vodafone Spain)과 쓰리 UK(Three UK)의 사례는 클라우드 네이티브 코어 네트워크가 통신 사업자가 엣지, 보안 및 온디맨드 품질(QoD)을 위한 제품에 대한 API 공개를 가능하게 한다는 것을 보여줍니다.
향후 10년 후반에는 통신 사업자들이 통합형 코어를 프라이빗 네트워크 슬라이스, 저지연 산업용 서비스 및 실시간 분석의 원동력으로 간주하게 될 것입니다. RAN에 대한 투자는 커버리지 목표가 달성됨에 따라 감소하는 반면, 라이프사이클 갱신 및 기능 추가로 인해 코어 네트워크에 대한 지출은 계속 증가할 것입니다. 또한, 분산형 유닛이 라인 레이트 트래픽을 데이터센터의 코어로 공급해야 하기 때문에 전송 및 xHaul 예산도 증가할 것입니다. 그 결과, 5G 인프라 시장에서는 광통신 및 라우팅 벤더들이 전술적 파트너가 아닌 전략적 파트너로서의 입지를 확립하기 위해 경쟁하는 상황이 나타날 것입니다.
2025년에는 중대역이 5G 인프라 시장 점유율의 45.20%를 차지한 것으로 평가되었습니다. 이는 중대역이 전파 거리와 대규모 MIMO 어레이를 지원하는 수백 MHz의 대역폭을 모두 갖추고 있기 때문입니다. 시카고에서 베를린에 이르는 통신 사업자들은 셀에 대한 과도한 투자를 피하면서 교외 링 지역을 커버하기 위해 3.5GHz 대역의 무선 장비를 채택하고 있습니다. 한편, mm파(mmWave)는 FWA(고정 무선 접속) 지원 가구 및 행사장에 서비스를 제공함으로써 32.15%라는 가장 높은 연평균 성장률(CAGR)을 보이고 있습니다. 이러한 추세에 따라 밀리파 무선 장비, 리피터 및 첨단 빔포밍용 반도체와 관련된 5G 인프라 시장 규모는 특히 미국, 일본, 한국에서 급속히 확대될 전망입니다.
1GHz 미만의 저대역은 광역 IoT 커버리지에 여전히 필수적이지만, 기가비트급 통신 속도 목표 달성에 어려움을 겪고 있어 주역이 아닌 보완적인 역할에 그치고 있습니다. 밀리파의 전개에는 가시거리나 나무에 의한 전파 감쇠와 같은 과제가 있지만, 고이득 안테나와 AI를 활용한 빔 스티어링 기술을 통해 그 격차는 서서히 메워지고 있습니다. 중대역과 고대역 주파수 대역을 동일한 면허 배정 라운드에서 일괄적으로 할당하는 규제 당국의 조치 덕분에, 통신 사업자는 차별화된 서비스 계층에 맞추어 주파수 대역 조합을 조정하기가 더 쉬워졌습니다.
지역별 분석
2025년, 아시아태평양은 5G 인프라 시장 점유율의 23.80%를 차지했습니다. 이는 중국의 440만 개 기지국과 2027년까지 3,000만 명의 FWA 가입자를 연결하겠다는 인도의 노력이 주도한 결과입니다. 한국이 인구의 97%를 지속적으로 커버하고, 일본이 교외 지역의 네트워크 밀도를 높여감에 따라, 이 지역은 연평균 성장률(CAGR) 31.40%로 성장할 전망입니다. 인도네시아, 베트남, 필리핀의 농촌 지역 대상 프로그램은 타워 공유 모델에 의존하는 반면, 호주에서는 외딴 지역의 광산 운영을 위해 위성과 5G를 결합한 하이브리드형 백업 체계를 추진하고 있습니다.
북미의 경우, 인구의 80% 이상을 커버하는 성숙한 단계에 있으며, 2023년의 침체를 겪은 후 2025년에는 투자가 다시 활성화되고 있습니다. 에릭슨은 2024년 4분기에 전년 동기 대비 54%의 지역 성장을 기록했으며, 이는 독립형 코어, 엣지 존 및 대기업용 계약이 다시 예산을 견인하고 있음을 보여줍니다. 미국의 통신 사업자들은 서비스가 미치지 않는 교외 지역을 포섭하기 위해 FWA와 광섬유를 세트로 제공하고 있으며, 캐나다에서는 원주민 커뮤니티의 연결 환경을 가속화하기 위해 새로운 미드밴드 주파수 대역을 할당하고 있습니다.
유럽은 독립형 방식의 보급률에서는 뒤처지고 있지만, 규제 조화를 통해 2030년까지 1,640억 유로의 경제적 효과를 목표로 하고 있습니다. 독일의 96%라는 커버리지율은 일관된 정책이 가져온 성과를 여실히 보여주고 있지만, 한편 영국에서는 공급업체 금지 조치로 인해 장비 교체가 지연되어 성능 회복이 요구되고 있습니다. 라틴아메리카에서는 29개 통신 사업자가 상용 서비스를 시작하여 상용 단계에 접어들었습니다. 주파수 사용료 인하와 클라우드 사업자의 중립형 호스팅 타워 자금 지원에 힘입어, 2030년까지 해당 지역의 연결 건수는 4억 2,500만 건에 달할 것으로 전망됩니다.
기타 혜택 :
- 엑셀 형식 시장 예측(ME) 시트
- 3개월간의 애널리스트 지원
자주 묻는 질문
목차
제1장 서론
제2장 조사 방법
제3장 주요 요약
제4장 시장 구도
제5장 시장 규모 및 성장 예측
제6장 경쟁 구도
제7장 시장 기회 및 향후 전망
AJY 26.09.07According to Mordor Intelligence, 5G infrastructure market size in 2026 is estimated at USD 19.86 billion, growing from 2025 value of USD 15.55 billion with 2031 projections showing USD 67.52 billion, growing at 27.73% CAGR over 2026-2031.
This report is Segmented by Communication Infrastructure (5G Radio Access Networks, 5G Core Networks, Transport / XHaul [Front, Mid, Back-Haul], and More), Spectrum Band (Low-Band, Mid-Band, and More), Network Architecture (Non-Standalone [NSA] and More), Core Network Technology (Software-Defined Networking [SDN] and More), End-User Vertical (Consumer Electronics, and More), and Geography.
Global 5G Infrastructure Market Trends and Insights
Increasing Machine-to-Machine and IoT Device Density
Standalone 5G allows each cell site to handle as many as 50,000 connected devices, a prerequisite for Industry 4.0 production lines and massive sensor grids. Hyundai Motor's RedCap-enabled factory network proved that reduced-capability devices can lower power budgets without losing coverage. Edge computing is moving compute resources closer to machines, keeping latency within millisecond windows that robotics and predictive-maintenance schemes require. Private-network proofs in automotive, healthcare, and heavy industry validate the revenue upside that comes from device-dense environments rather than consumer handsets. This driver underpins sustained spending on small cells and edge data centers over the forecast window.
Surge in Mobile Data Consumption
Monthly mobile traffic continues to set new highs as cloud gaming, extended-reality video, and AI-enhanced streaming demand consistent multi-gigabit links. Three UK boosted backbone throughput to 9 Tbit/s after end-2024 peaks surpassed 2 Tbit/s. In China, regulators expect national traffic to quadruple by 2030, moving operators toward capacity architectures that remain efficient under day-long loads. Healthcare pilots, such as real-time tele-ultrasound demonstrations, underline the value of uplink capacity for mission-critical imagery. FWA uptake in India and the United States is also redirecting traffic from smartphones to CPE units, pushing carriers to redesign backhaul for home-first video habits.
High Upfront RAN Densification and Fiber Back-Haul Costs
Small-cell bills from USD 10,000 to USD 50,000 and macro-cell outlays that reach USD 200,000 per site make dense 5G footprints capital heavy, especially where mmWave is mandated. Fiber back-haul can add 30% to project budgets, and scarce digs in suburban corridors slow trenching schedules. Global telecom CAPEX dipped in 2023, the first drop since 2017, making CFOs cautious about accelerated rollouts. Network-sharing deals deliver up to 40% savings but reduce each partner's ability to market premium differentiation. Spectrum licence fees above USD 1 billion per operator further compress balance sheet headroom.
Other drivers and restraints analyzed in the detailed report include:
- Government Spectrum Auctions Accelerating Mid-Band Rollouts
- Telco Capex Pivot to Cloud-Native Open RAN Architectures
- Delayed Standardisation for Network-Slicing Monetisation
For complete list of drivers and restraints, kindly check the Table Of Contents.
Segment Analysis
RAN equipment generated the largest slice of the 5G infrastructure market, delivering 36.30% revenue in 2025 as carriers rolled out dense macro and small-cell grids. That initial hardware wave will keep RAN important, yet core networks outpace other layers with a 31.10% CAGR because software-defined control decides future monetisation. The 5G infrastructure market size for core platforms is set to increase sharply as standalone rollouts mandate dual-mode packet cores that virtualise user plane and control plane functions. Vodafone Spain and Three UK highlight how cloud-native cores let operators expose APIs for edge, security and quality-on-demand products
In the second half of the decade, operators view the converged core as the engine for private-network slices, low-latency industrial services, and real-time analytics. RAN spend will taper as coverage milestones are met, whereas lifecycle refresh and feature add-ons keep core invoices growing. Transport and xHaul budgets also rise because distributed units must feed line-rate traffic into data-centre cores. Consequently, the 5G infrastructure market will witness supplier jockeying where optical and routing vendors position themselves as strategic rather than tactical partners.
Mid-band commanded 45.20% of 5G infrastructure market share in 2025 because it blends propagation reach with multi-hundred-MHz bandwidth that supports massive MIMO arrays. Operators from Chicago to Berlin use 3.5 GHz radios to cover suburban rings without overspending on cells. mmWave, however, shows the fastest 32.15% CAGR by serving FWA households and event venues. This trajectory means the 5G infrastructure market size linked to mmWave radios, repeaters and advanced beamforming silicon will climb quickly, especially in the United States, Japan and South Korea.
Low-band below 1 GHz stays vital for wide-area IoT coverage but struggles with gigabit targets, keeping it a supplement, not a star. mmWave deployment faces line-of-sight and foliage loss, yet high-gain antennas and AI-aided beam steering are closing some gaps. Regulators that bundle mid-band and high-band blocks in the same licence round help carriers align the spectrum mix with differentiated service tiers.
Complete Report Scope:
- By Communication Infrastructure
- 5G Radio Access Network (RAN)
- Transport / xHaul (Front-, Mid-, Back-haul)
- Core Network (Cloud-native 5GC)
- By Spectrum Band
- Low-Band (less than 1 GHz)
- Mid-Band (1-6 GHz)
- High-Band / mmWave (above 24 GHz)
- By Network Architecture
- Non-Standalone (NSA)
- Standalone (SA)
- By Core Network Technology
- Software-Defined Networking (SDN)
- Network Function Virtualization (NFV)
- Multi-access Edge Computing (MEC)
- Network Slicing
- By End-user Vertical
- Consumer Electronics
- Automotive and Mobility
- Industrial Manufacturing
- Healthcare and Life Sciences
- Energy and Utilities
- Public Safety and Defense
- Smart Cities and Infrastructure
- Other Verticals (Retail, Media, Agriculture)
- By Geography
- North America
- United States
- Canada
- South America
- Brazil
- Argentina
- Rest of South America
- Europe
- Germany
- United Kingdom
- France
- Italy
- Spain
- Russia
- Rest of Europe
- APAC
- China
- Japan
- South Korea
- India
- Australia
- Rest of APAC
- Middle East and Africa
- Middle East
- Saudi Arabia
- United Arab Emirates
- Turkey
- Rest of Middle East
- Africa
- South Africa
- Nigeria
- Rest of Africa
- Middle East
- North America
Geography Analysis
Asia Pacific held 23.80% of 5G infrastructure market share in 2025, driven by China's 4.4 million base stations and India's race to connect 30 million FWA subscribers by 2027. The region will expand at a 31.40% CAGR as South Korea sustains 97% population coverage and Japan adds suburban densification. Rural programmes in Indonesia, Vietnam, and the Philippines will lean on shared-tower models, while Australia advances with hybrid satellite-5G back-ups for remote mining operations.
North America shows coverage maturity above 80% of people yet reinvigorated spending in 2025 after a 2023 dip. Ericsson logged 54% year-over-year regional growth in Q4 2024, signalling that standalone cores, edge zones, and large enterprise deals are moving budgets again. US carriers bundle FWA with fibre to capture underserved suburbs, and Canada allocates fresh mid-band spectrum to accelerate indigenous-community connectivity.
Europe trails on standalone penetration but targets a EUR 164 billion economic boost by 2030 from harmonised regulation. Germany's 96% coverage illustrates what cohesive awards achieve, whereas the United Kingdom must rebuild performance after vendor bans slowed equipment swaps. Latin America steps into commercial phase with 29 operators live; regional connections should reach 425 million by 2030 as spectrum fees fall and cloud players finance neutral-host towers.
- Airspan Networks Inc.
- AT&T Inc.
- Casa Systems Inc.
- Cisco Systems Inc.
- CommScope Holding Company Inc.
- Corning Inc.
- Dell Technologies Inc.
- Telefonaktiebolaget LM Ericsson
- Fujitsu Limited
- Hewlett Packard Enterprise Development LP
- Huawei Technologies Co. Ltd.
- Intel Corporation
- Juniper Networks Inc.
- Mavenir Systems Inc.
- NEC Corporation
- Nokia Corporation
- Oracle Corporation
- Parallel Wireless Inc.
- Qualcomm Technologies Inc.
- Qucell Networks Co. Ltd.
- Rakuten Symphony Inc.
- Ribbon Communications Inc.
- Samsung Electronics Co. Ltd.
- Verizon Communications Inc.
- ZTE Corporation
Additional Benefits:
- The market estimate (ME) sheet in Excel format
- 3 months of analyst support
TABLE OF CONTENTS
1 INTRODUCTION
- 1.1 Study Assumptions and Market Definition
- 1.2 Scope of the Study
2 RESEARCH METHODOLOGY
3 EXECUTIVE SUMMARY
4 MARKET LANDSCAPE
- 4.1 Market Overview
- 4.2 Market Drivers
- 4.2.1 Increasing machine-to-machine and IoT device density
- 4.2.2 Surge in mobile data consumption
- 4.2.3 Government spectrum auctions accelerating mid-band rollouts
- 4.2.4 Telco capex pivot to cloud-native open RAN architectures
- 4.2.5 Emerging demand for private 5G in brownfield industrial sites
- 4.2.6 Fixed-wireless access (FWA) substituting fiber in rural markets
- 4.3 Market Restraints
- 4.3.1 High upfront RAN densification and fiber back-haul costs
- 4.3.2 Delayed standardization for network-slicing monetization
- 4.3.3 National-security restrictions on Chinese vendors
- 4.3.4 Skilled-labor shortages for mmWave deployment
- 4.4 Value Chain Analysis
- 4.5 Regulatory Landscape
- 4.6 Technological Outlook
- 4.7 Investment and Funding Trends
- 4.8 Porter's Five Forces Analysis
- 4.8.1 Bargaining Power of Suppliers
- 4.8.2 Bargaining Power of Buyers
- 4.8.3 Threat of New Entrants
- 4.8.4 Intensity of Competitive Rivalry
- 4.8.5 Threat of Substitute Products
5 MARKET SIZE AND GROWTH FORECASTS (VALUE)
- 5.1 By Communication Infrastructure
- 5.1.1 5G Radio Access Network (RAN)
- 5.1.2 Transport / xHaul (Front-, Mid-, Back-haul)
- 5.1.3 Core Network (Cloud-native 5GC)
- 5.2 By Spectrum Band
- 5.2.1 Low-Band (less than 1 GHz)
- 5.2.2 Mid-Band (1-6 GHz)
- 5.2.3 High-Band / mmWave (above 24 GHz)
- 5.3 By Network Architecture
- 5.3.1 Non-Standalone (NSA)
- 5.3.2 Standalone (SA)
- 5.4 By Core Network Technology
- 5.4.1 Software-Defined Networking (SDN)
- 5.4.2 Network Function Virtualization (NFV)
- 5.4.3 Multi-access Edge Computing (MEC)
- 5.4.4 Network Slicing
- 5.5 By End-user Vertical
- 5.5.1 Consumer Electronics
- 5.5.2 Automotive and Mobility
- 5.5.3 Industrial Manufacturing
- 5.5.4 Healthcare and Life Sciences
- 5.5.5 Energy and Utilities
- 5.5.6 Public Safety and Defense
- 5.5.7 Smart Cities and Infrastructure
- 5.5.8 Other Verticals (Retail, Media, Agriculture)
- 5.6 By Geography
- 5.6.1 North America
- 5.6.1.1 United States
- 5.6.1.2 Canada
- 5.6.2 South America
- 5.6.2.1 Brazil
- 5.6.2.2 Argentina
- 5.6.2.3 Rest of South America
- 5.6.3 Europe
- 5.6.3.1 Germany
- 5.6.3.2 United Kingdom
- 5.6.3.3 France
- 5.6.3.4 Italy
- 5.6.3.5 Spain
- 5.6.3.6 Russia
- 5.6.3.7 Rest of Europe
- 5.6.4 APAC
- 5.6.4.1 China
- 5.6.4.2 Japan
- 5.6.4.3 South Korea
- 5.6.4.4 India
- 5.6.4.5 Australia
- 5.6.4.6 Rest of APAC
- 5.6.5 Middle East and Africa
- 5.6.5.1 Middle East
- 5.6.5.1.1 Saudi Arabia
- 5.6.5.1.2 United Arab Emirates
- 5.6.5.1.3 Turkey
- 5.6.5.1.4 Rest of Middle East
- 5.6.5.2 Africa
- 5.6.5.2.1 South Africa
- 5.6.5.2.2 Nigeria
- 5.6.5.2.3 Rest of Africa
- 5.6.5.1 Middle East
- 5.6.1 North America
6 COMPETITIVE LANDSCAPE
- 6.1 Market Concentration
- 6.2 Strategic Moves
- 6.3 Market Share Analysis
- 6.4 Company Profiles (includes Global level Overview, Market level overview, Core Segments, Financials as available, Strategic Information, Market Rank/Share for key companies, Products and Services, and Recent Developments)
- 6.4.1 Airspan Networks Inc.
- 6.4.2 AT&T Inc.
- 6.4.3 Casa Systems Inc.
- 6.4.4 Cisco Systems Inc.
- 6.4.5 CommScope Holding Company Inc.
- 6.4.6 Corning Inc.
- 6.4.7 Dell Technologies Inc.
- 6.4.8 Telefonaktiebolaget LM Ericsson
- 6.4.9 Fujitsu Limited
- 6.4.10 Hewlett Packard Enterprise Development LP
- 6.4.11 Huawei Technologies Co. Ltd.
- 6.4.12 Intel Corporation
- 6.4.13 Juniper Networks Inc.
- 6.4.14 Mavenir Systems Inc.
- 6.4.15 NEC Corporation
- 6.4.16 Nokia Corporation
- 6.4.17 Oracle Corporation
- 6.4.18 Parallel Wireless Inc.
- 6.4.19 Qualcomm Technologies Inc.
- 6.4.20 Qucell Networks Co. Ltd.
- 6.4.21 Rakuten Symphony Inc.
- 6.4.22 Ribbon Communications Inc.
- 6.4.23 Samsung Electronics Co. Ltd.
- 6.4.24 Verizon Communications Inc.
- 6.4.25 ZTE Corporation
7 MARKET OPPORTUNITIES AND FUTURE OUTLOOK
- 7.1 White-space and Unmet-need Assessment