

|
시장보고서
상품코드
2122999
비즈니스 생산성 소프트웨어 시장 : 점유율 분석, 업계 동향과 통계, 성장 예측(2026-2031년)Business Productivity Software - Market Share Analysis, Industry Trends & Statistics, Growth Forecasts (2026 - 2031) |
||||||
 Mordor Intelligence
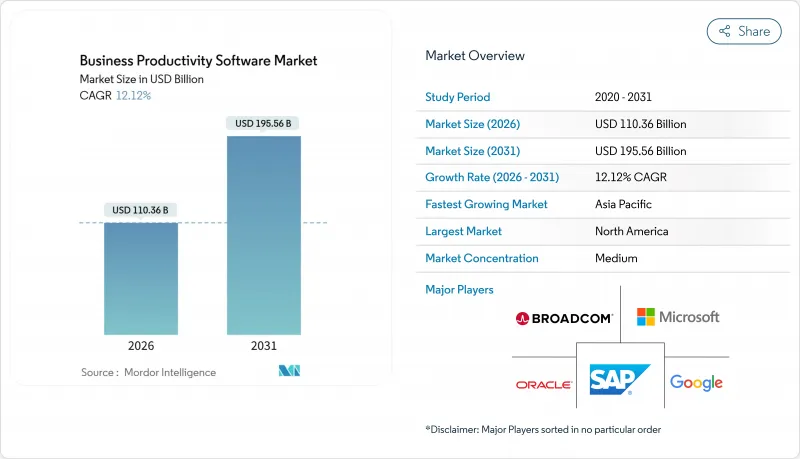
에 의하면, 비즈니스 생산성 소프트웨어 시장 규모는 2026년에 1,103억 6,000만 달러가 되어, 2031년까지 1,955억 6,000만 달러에 이를 것으로 예측되며, 예측 기간 중 연평균 복합 성장률(CAGR)은 12.12%를 나타낼 전망입니다.
본 보고서는 배포 방식(On-Premise, 클라우드), 조직 규모(대기업, 중소기업), 최종 사용자 산업(은행, 금융서비스 및 보험(BFSI), 통신 및 IT, 기타), 솔루션 유형(컨텐츠 협업·문서 관리, 통신·통합 커뮤니케이션, 기타), 지역별로 세분화되어 있습니다. 시장 예측은 금액(달러) 기준으로 제시되어 있습니다.
세계 비즈니스 생산성 소프트웨어 시장 동향 및 인사이트
업무 용도 전반에 걸친 ‘클라우드 우선’ SaaS(Software-as-a-Service) 도입
기업들은 지속적인 기능 업데이트, 유연한 용량, 통합된 보안을 제공하는 SaaS 솔루션을 우선시하며 On-Premise 인프라를 단계적으로 폐지하고 있습니다. 마이크로소프트는 2024년 상용 클라우드 매출이 1,360억 달러에 달했다고 발표했는데, 이는 기업들의 워크로드 이전 규모를 여실히 보여줍니다. 금융 기관들은 SaaS를 사내 데이터센터의 관리 체제를 대폭 재검토하지 않고도 디지털 운영 회복력(Digital Operational Resilience) 의무를 충족하기 위한 수단으로 간주하고 있습니다. ISO/IEC 27017과 같은 표준화된 클라우드 보안 프레임워크 덕분에 벤더에 대한 실사 주기가 단축되어 조달이 더욱 가속화되고 있습니다. 하이퍼스케일러가 계산 부하가 높은 AI 서비스를 구독 플랜에 포함함에 따라, On-Premise 배포와 비교한 총 소유 비용(TCO)의 격차는 확대되고 있습니다. 이전 패턴으로는 우선 협업 워크로드의 ‘리프트 앤 시프트(lift-and-shift)’를 우선시하고, 데이터 분류 문제가 해결된 후에 레거시 컨텐츠 관리 시스템을 단계적으로 폐지하는 경향이 강해지고 있습니다.
생산성 제품군에 통합된 생성형 AI 코파일럿의 보급
생성형 AI 어시스턴트는 파일럿 프로젝트 단계에서 일상 업무를 효율화하는 핵심 인터페이스로 전환되었습니다. Microsoft 365 Copilot은 2023년 하반기에 일반 제공이 시작되어, Outlook, Teams, Word에서 문맥에 따른 초안 작성, 요약, 분석 기능을 제공합니다. 구글은 2024년 초 ‘Gemini for Workspace’를 통해 이에 대응하며, Gmail과 Docs에 멀티모달 모델을 통합했습니다. 초기 도입자들 사이에서는 일상적인 문서 작성 시 25-30%의 시간 단축 효과가 보고되고 있으나, 이용률이 가장 높은 분야는 금융 및 법무 부문의 지식 근로자들입니다. 유럽연합(EU)의 AI 법은 업무 환경 내 AI를 ‘고위험’으로 분류하고 있으며, 이에 따라 각 벤더사는 설계 단계부터 투명성과 인간에 의한 감독 기능을 통합하도록 요구받고 있습니다. 경쟁사들이 모델의 품질과 지연 시간에 집중하는 가운데, 하이퍼스케일러 기업들은 GPU 용량에 대한 투자를 확대하고 있으며, 이로 인해 클라우드 네이티브 제품군에는 독립형 포인트 솔루션으로는 도저히 따라잡을 수 없는 성능상의 우위가 확보되고 있습니다.
국경을 넘는 데이터 저장을 제한하는 사이버 주권법
현재 각국 정부는 시민 데이터의 현지 저장을 의무화하고 있어, 벤더들은 인프라를 복제할 수밖에 없게 되었고, 이로 인해 전 세계 아키텍처가 분절화되고 있습니다. 중국의 ‘개인정보보호법’은 보안 평가를 거치지 않은 국경 간 전송을 금지하고 있습니다. 러시아는 개인 데이터의 국내 호스팅을 의무화하고 있어, 외국 제공업체들은 국내 클라우드 사업자와의 제휴를 강요받고 있습니다. 인도의 ‘디지털 개인 데이터 보호 법안’ 초안도 유사한 제한을 부과할 전망입니다. 이러한 규제는 비용을 상승시키고 규모의 경제를 저해할 뿐만 아니라, 현지 규정 준수 심사가 완료될 때까지 새로운 AI 기능의 배포가 지연될 가능성이 있습니다.
부문 분석
2025년, 비즈니스 생산성 소프트웨어 시장에서 클라우드 기반 서비스는 71.31%의 점유율을 차지했으며, 기업들이 민첩성과 예측 가능한 운영 비용을 우선시함에 따라 신규 지출의 대부분을 차지했습니다. 이러한 우위는 앞으로도 지속될 전망이며, 해당 카테고리는 2031년까지 연평균 성장률(CAGR) 13.12%를 나타낼 것으로 예측됩니다. 각 벤더들은 대부분의 사설 데이터센터에서는 이용할 수 없는 하이퍼스케일 GPU 인프라에 의존하는 계산 부하가 높은 AI 코파일럿을 통합함으로써 이러한 기회를 활용하고 있습니다. 또한, FedRAMP와 같은 프레임워크가 미국 연방 정부의 워크로드를 위해 승인된 클라우드를 인증하고 있기 때문에 규정 준수 측면에서도 매니지드 SaaS가 유리합니다.
하이브리드 모델은 조직이 지연 시간에 민감한 워크로드나 기밀성이 높은 워크로드를 On-Premise에 유지하면서, 협업 제품군을 클라우드로 이전할 수 있도록 하는 발판 역할을 하고 있습니다.
2025년 비즈니스 생산성 소프트웨어 시장 매출에서 대기업이 52.36%의 점유율을 차지하고 있으며, 이는 복잡한 세계 확장 및 다년간의 지원 계약을 반영한 것입니다. 한편, 중소기업은 2031년까지 연평균 14.23%의 성장이 예상되며, 이는 대기업을 능가하는 속도입니다. 사용량에 따른 과금 체계로 인해 비용이 실제 사용 현황과 연동되므로, 중소기업은 막대한 초기 라이선스 비용을 부담하지 않고도 사용자 수를 단계적으로 확대할 수 있습니다. 인도나 베트남과 같은 고성장 지역에서는 많은 중소기업이 기존 서버를 완전히 생략하고, 첫 번째 엔터프라이즈 IT 투자로 생산성 제품군을 도입하고 있습니다.
중견 기업은 독자적인 요구 사항을 가지고 있으며, 대부분의 경우 설정에 드는 수고를 줄여주는 산업별 템플릿을 원합니다. Salesforce의 Industry Clouds는 규제 대응 워크플로를 미리 번들로 제공하여 도입 기간을 수개월에서 수주일로 단축합니다. 가격에 민감한 구매자들은 CRM, 프로젝트 관리, 협업 기능을 통합하고 사용자당 요금이 더 저렴한 Zoho의 번들형 제품군에도 주목하고 있습니다. 경쟁이 치열해지는 가운데, 각 벤더들은 단순히 기능의 수를 늘리는 것이 아니라 AI를 활용한 자동화 및 내장형 분석 기능을 통해 차별화를 꾀하고 있습니다.
지역별 분석
북미는 비즈니스 생산성 소프트웨어 시장에서 높은 소프트웨어 예산과 성숙한 클라우드 생태계의 뒷받침을 받아 2025년 매출의 39.87%를 차지했습니다. 연방 정부의 제로 트러스트 의무화로 인해 ID 중심 보안 모델의 도입이 가속화되고 있으며, 각 기관은 지속적인 인증을 제공하는 제품군으로의 전환을 추진하고 있습니다. 캐나다 공공 부문에서는 보호 대상 데이터에 대해 ‘Microsoft 365GCC High’를 표준화하고 있어, 국가 규제가 벤더 락인을 강화하고 있는 실제 사례가 되고 있습니다. 하이퍼스케일러 간의 경쟁으로 가격 경쟁력은 유지되고 있지만, 기능 진화 속도 측면에서는 독자적인 AI 가속기에 투자하고 있는 기존 벤더들이 우위를 점하고 있습니다.
유럽에서는 ‘디지털 운영 복원력 법(Digital Operational Resilience Act)’에 따라 금융 서비스에 대한 사이버 보안 및 사고 대응 요건이 강화되어 꾸준한 진전이 나타나고 있습니다. 독일, 프랑스, 영국에서는 안전한 클라우드의 공공 조달을 효율화하는 인증 제도가 도입되었습니다. 러시아의 현지화 법에 따라 지역 시장이 분할되면서, 국내에서 데이터를 호스팅할 수 있는 현지 벤더에게 시장 점유율이 열리고 있습니다. 북유럽 및 동유럽 시장에서는 보다 광범위한 디지털 주권 노력의 일환으로 SaaS가 채택되고 있으며, 대부분의 경우 현지 처리를 보장하는 유럽의 클라우드 사업자가 우선적으로 선택되고 있습니다.
아시아태평양은 인도, 싱가포르, 일본에서 국내 데이터 보관을 의무화하는 소버린 클라우드 이니셔티브에 힘입어 연평균 성장률(CAGR) 14.83%로 가장 빠르게 성장하고 있는 지역입니다. 중국은 ‘개인정보 보호법’을 통해 엄격한 현지화를 시행하고 있으며, 이에 따라 하이퍼스케일러 기업들은 알리바바 클라우드(Alibaba Cloud)나 텐센트 클라우드(Tencent Cloud)와 제휴하여 공동 서비스를 제공합니다. 호주 및 뉴질랜드에서는 규제 당국이 정보 보안 기준을 개정하고 SaaS 관리 조치를 포함시킨 덕분에 꾸준한 도입세가 유지되고 있습니다. 남미, 중동 및 아프리카의 신흥 시장에서는 기반이 작음에도 불구하고 두 자릿수 성장을 보이고 있지만, 환율 변동과 통신 환경의 격차가 단기적인 상승 여력을 억제하고 있습니다.
기타 혜택
- 엑셀 형식 시장 예측(ME) 시트
- 3개월간의 애널리스트 지원
자주 묻는 질문
목차
제1장 서론
제2장 조사 방법
제3장 주요 요약
제4장 시장 구도
제5장 시장 규모와 성장 예측
제6장 경쟁 구도
제7장 시장 기회와 향후 전망
JHS 26.09.09According to Mordor Intelligence, the business productivity software market size stood at USD 110.36 billion in 2026 and is projected to reach USD 195.56 billion by 2031, reflecting a 12.12% CAGR over the forecast period.
This report is Segmented by Deployment (On-Premise, and Cloud), Organisation Size (Large Enterprises, and Small and Medium Enterprises), End-User Industry (BFSI, Telecommunications and IT, and More), Solution Type (Content Collaboration and Document Management, Communication and Unified Communications, and More), and Geography. The Market Forecasts are Provided in Terms of Value (USD).
Global Business Productivity Software Market Trends and Insights
Cloud-First SaaS Adoption Across Line-of-Business Apps
Organizations continue to retire on-premises infrastructure in favor of SaaS solutions that deliver continuous feature updates, elastic capacity, and integrated security. Microsoft disclosed USD 136 billion in commercial cloud revenue in 2024, underscoring the scale of enterprises' workload shifts. Financial institutions see SaaS as a pathway to meet digital operational resilience obligations without overhauling internal data center controls. Standardized cloud security frameworks such as ISO/IEC 27017 shorten vendor due diligence cycles, further accelerating procurement. As hyperscalers bundle compute-intensive AI services into subscription tiers, the total cost of ownership gap relative to on-premises deployments widens. Migration patterns increasingly favor lift-and-shift for collaboration workloads first, followed by phased retirement of legacy content management systems once data-classification hurdles are cleared.
Proliferation of Gen-AI Copilots Embedded in Productivity Suites
Generative-AI assistants have moved from pilot projects to core interfaces that streamline everyday tasks. Microsoft 365 Copilot reached general availability in late 2023, offering context-aware drafting, summarization, and analysis across Outlook, Teams, and Word. Google answered with Gemini for Workspace in early 2024, embedding multimodal models into Gmail and Docs. Early adopters report 25-30% time savings on routine correspondence, though usage is highest among knowledge workers in finance and legal professions. The European Union AI Act classifies in-workplace AI as high-risk, driving vendors to incorporate transparency and human-oversight features by design. As competition centers on model quality and latency, hyperscalers are investing in GPU capacity, giving cloud-native suites a performance edge that standalone point solutions struggle to match.
Cyber-Sovereignty Laws Restricting Cross-Border Data Residency
Governments now mandate local storage of citizen data, forcing vendors to replicate infrastructure and fragmenting global architectures. China's personal information protection law bars cross-border transfers without security assessments. Russia requires in-country hosting for personal data, compelling foreign providers to partner with domestic clouds. India's draft digital personal data protection bill is poised to impose similar restrictions. These rules inflate costs, reduce economies of scale, and can delay rollout of new AI features until local compliance reviews finish.
Other drivers and restraints analyzed in the detailed report include:
- Hybrid-Work Tooling Mandates in Global Compliance Standards
- Vertical-Specific Low-Code Work Platforms for Frontline Workers
- Rising SaaS Sprawl Driving Consolidation Fatigue and License Rationalization
For complete list of drivers and restraints, kindly check the Table Of Contents.
Segment Analysis
Cloud-based offerings accounted for 71.31% share of the business productivity software market in 2025, capturing the majority of new spending as enterprises prioritize agility and predictable operating costs. This dominance is expected to extend, with the category projected to log a 13.12% CAGR through 2031. Vendors capitalize by embedding compute-intensive AI copilots that rely on hyperscale GPU infrastructure unavailable in most private data centers. Compliance readiness also favors managed SaaS, as frameworks such as FedRAMP authorize approved clouds for United States federal workloads.
Hybrid models serve as a stepping stone, allowing organizations to keep latency-sensitive or classified workloads on-premises while shifting collaboration suites to the cloud.
Large enterprises represented 52.36% share of the business productivity software market in 2025 revenue, reflecting complex global rollouts and multiyear support contracts. Yet SMEs are forecast to grow at 14.23% through 2031, outpacing their larger counterparts. Usage-based billing aligns costs with actual utilization, enabling smaller firms to scale seats incrementally without heavy upfront licensing outlays. In high-growth regions such as India and Vietnam, many SMEs are adopting productivity suites as their first enterprise IT investment, bypassing legacy servers entirely.
Mid-market organizations face distinct needs, often seeking vertical templates that cut configuration effort. Salesforce Industry Clouds pre-bundle regulatory workflows, shortening deployment from months to weeks. Price-sensitive buyers are also gravitating toward bundled suites from Zoho that integrate CRM, project management, and collaboration at lower per-user rates. As competition intensifies, vendors differentiate through AI-powered automation and embedded analytics rather than pure feature count.
Complete Report Scope:
- By Deployment
- On-Premise
- Cloud
- By Organisation Size
- Large Enterprises
- Small and Medium Enterprises
- By End-User Industry
- BFSI
- Telecommunications and IT
- Manufacturing
- Media, Entertainment and Publishing
- Transportation and Logistics
- Retail and E-commerce
- Healthcare and Life Sciences
- Government and Public Sector
- Other End-User Industries (Education, Utilities)
- By Solution Type
- Content Collaboration and Document Management
- Communication and Unified Communications
- Project, Work and Task Management
- Business Intelligence and Analytics
- Low-Code / No-Code Automation
- Digital Asset and Creative Tools
- Security and Compliance Add-ons
- By Geography
- North America
- United States
- Canada
- Mexico
- Europe
- Germany
- United Kingdom
- France
- Italy
- Spain
- Russia
- Rest of Europe
- Asia Pacific
- China
- Japan
- India
- South Korea
- ASEAN
- Australia and New Zealand
- Rest of Asia Pacific
- South America
- Brazil
- Argentina
- Rest of South America
- Middle East
- Saudi Arabia
- United Arab Emirates
- Turkey
- Rest of Middle East
- Africa
- South Africa
- Nigeria
- Rest of Africa
- North America
Geography Analysis
North America controlled 39.87% of 2025 revenue, underpinned by high software budgets and mature cloud ecosystems in the business productivity software market. Federal zero-trust mandates accelerated the adoption of identity-centric security models, prompting agencies to migrate to suites offering continuous authorization. Canada's public sector standardized on Microsoft 365 GCC High for protected-class data, demonstrating how national regulations reinforce vendor lock-in. Hyperscaler competition keeps pricing competitive, but feature velocity favors incumbents that invest in proprietary AI accelerators.
Europe advances steadily as the digital operational resilience act multiplies cybersecurity and incident-response requirements for financial services. Germany, France, and the United Kingdom deploy certification schemes that streamline public procurement of secure clouds. Russia's localization law fragments the region, opening share for domestic vendors able to host data in-country. Nordic and Eastern European markets adopt SaaS as part of broader digital-sovereignty agendas, often favoring European cloud operators that guarantee local processing.
Asia Pacific is the fastest-growing region at a 14.83% CAGR, propelled by sovereign-cloud initiatives in India, Singapore, and Japan that require national data residency. China enforces strict localization via the personal information protection law, prompting hyperscalers to pair with Alibaba Cloud and Tencent Cloud for joint offerings. Australia and New Zealand maintain robust adoption as regulators update information-security standards to include SaaS controls. Emerging markets in South America, the Middle East, and Africa post double-digit expansion from a small base, although currency volatility and connectivity gaps temper near-term upside.
- Microsoft Corporation
- Google LLC
- Oracle Corporation
- Broadcom Inc. (Symantec)
- SAP SE
- Salesforce Inc.
- IBM Corporation
- VMware Inc.
- Amazon Web Services Inc.
- Atlassian Corporation
- ServiceNow Inc.
- Adobe Inc.
- Monday.com Ltd.
- Asana Inc.
- Zoho Corporation
- Citrix Systems Inc.
- Dropbox Inc.
- Smartsheet Inc.
- Slack Technologies LLC
- AppScale Systems Inc.
Additional Benefits:
- The market estimate (ME) sheet in Excel format
- 3 months of analyst support
TABLE OF CONTENTS
1 INTRODUCTION
- 1.1 Study Assumptions and Market Definition
- 1.2 Scope of the Study
2 RESEARCH METHODOLOGY
3 EXECUTIVE SUMMARY
4 MARKET LANDSCAPE
- 4.1 Market Overview
- 4.2 Market Drivers
- 4.2.1 Cloud-First Saas Adoption Across Line-Of-Business Apps
- 4.2.2 Proliferation Of Gen-Ai Copilots Embedded In Productivity Suites
- 4.2.3 Hybrid-Work Tooling Mandates In Global Compliance Standards
- 4.2.4 Vertical-Specific Low-Code Work Platforms For Frontline Workers
- 4.2.5 Ecosystem Shift To Usage-Based Pricing Unlocking Smb Upgrade Cycles
- 4.2.6 Zero-Friction Api-First Extensibility Ecosystems For Cross-Suite Workflows
- 4.3 Market Restraints
- 4.3.1 Cyber-Sovereignty Laws Restricting Cross-Border Data Residency
- 4.3.2 Rising Saas Sprawl Driving Consolidation Fatigue And Licence Rationalisation
- 4.3.3 Scarcity Of Integration Talent Delaying Complex Workflow Roll-Outs
- 4.3.4 Generative-Ai Model Opacity Triggering Enterprise Risk-Control Freezes
- 4.4 Industry Value Chain Analysis
- 4.5 Technological Outlook
- 4.6 Porter's Five Forces Analysis
- 4.6.1 Bargaining Power of Suppliers
- 4.6.2 Bargaining Power of Buyers
- 4.6.3 Threat of New Entrants
- 4.6.4 Threat of Substitutes
- 4.6.5 Intensity of Competitive Rivalry
- 4.7 Impact of Macroeconomic Factors on the Market
5 MARKET SIZE AND GROWTH FORECASTS (VALUE)
- 5.1 By Deployment
- 5.1.1 On-Premise
- 5.1.2 Cloud
- 5.2 By Organisation Size
- 5.2.1 Large Enterprises
- 5.2.2 Small and Medium Enterprises
- 5.3 By End-User Industry
- 5.3.1 BFSI
- 5.3.2 Telecommunications and IT
- 5.3.3 Manufacturing
- 5.3.4 Media, Entertainment and Publishing
- 5.3.5 Transportation and Logistics
- 5.3.6 Retail and E-commerce
- 5.3.7 Healthcare and Life Sciences
- 5.3.8 Government and Public Sector
- 5.3.9 Other End-User Industries (Education, Utilities)
- 5.4 By Solution Type
- 5.4.1 Content Collaboration and Document Management
- 5.4.2 Communication and Unified Communications
- 5.4.3 Project, Work and Task Management
- 5.4.4 Business Intelligence and Analytics
- 5.4.5 Low-Code / No-Code Automation
- 5.4.6 Digital Asset and Creative Tools
- 5.4.7 Security and Compliance Add-ons
- 5.5 By Geography
- 5.5.1 North America
- 5.5.1.1 United States
- 5.5.1.2 Canada
- 5.5.1.3 Mexico
- 5.5.2 Europe
- 5.5.2.1 Germany
- 5.5.2.2 United Kingdom
- 5.5.2.3 France
- 5.5.2.4 Italy
- 5.5.2.5 Spain
- 5.5.2.6 Russia
- 5.5.2.7 Rest of Europe
- 5.5.3 Asia Pacific
- 5.5.3.1 China
- 5.5.3.2 Japan
- 5.5.3.3 India
- 5.5.3.4 South Korea
- 5.5.3.5 ASEAN
- 5.5.3.6 Australia and New Zealand
- 5.5.3.7 Rest of Asia Pacific
- 5.5.4 South America
- 5.5.4.1 Brazil
- 5.5.4.2 Argentina
- 5.5.4.3 Rest of South America
- 5.5.5 Middle East
- 5.5.5.1 Saudi Arabia
- 5.5.5.2 United Arab Emirates
- 5.5.5.3 Turkey
- 5.5.5.4 Rest of Middle East
- 5.5.6 Africa
- 5.5.6.1 South Africa
- 5.5.6.2 Nigeria
- 5.5.6.3 Rest of Africa
- 5.5.1 North America
6 COMPETITIVE LANDSCAPE
- 6.1 Market Concentration
- 6.2 Strategic Moves
- 6.3 Market Share Analysis
- 6.4 Company Profiles (includes Global level Overview, Market level overview, Core Segments, Financials as available, Strategic Information, Market Rank/Share for key companies, Products and Services, Recent Developments)
- 6.4.1 Microsoft Corporation
- 6.4.2 Google LLC
- 6.4.3 Oracle Corporation
- 6.4.4 Broadcom Inc. (Symantec)
- 6.4.5 SAP SE
- 6.4.6 Salesforce Inc.
- 6.4.7 IBM Corporation
- 6.4.8 VMware Inc.
- 6.4.9 Amazon Web Services Inc.
- 6.4.10 Atlassian Corporation
- 6.4.11 ServiceNow Inc.
- 6.4.12 Adobe Inc.
- 6.4.13 Monday.com Ltd.
- 6.4.14 Asana Inc.
- 6.4.15 Zoho Corporation
- 6.4.16 Citrix Systems Inc.
- 6.4.17 Dropbox Inc.
- 6.4.18 Smartsheet Inc.
- 6.4.19 Slack Technologies LLC
- 6.4.20 AppScale Systems Inc.
7 MARKET OPPORTUNITIES AND FUTURE OUTLOOK
- 7.1 White-space and Unmet-need Assessment


