

|
시장보고서
상품코드
2123085
IaaS(Insight As A Service) 애플리케이션 시장 : 점유율 분석, 업계 동향과 통계, 성장 예측(2026-2031년)Insight As A Service Application - Market Share Analysis, Industry Trends & Statistics, Growth Forecasts (2026 - 2031) |
||||||
 Mordor Intelligence
Mordor Intelligence에 의하면, 2026년 IaaS(Insight As A Service) 애플리케이션 시장 규모는 86억 4,000만 달러로 추정되고 있어 2025년 72억 3,000만 달러에서 확대해, 2031년에는 211억 2,000만 달러에 이를 것으로 예측됩니다.
2026년부터 2031년까지의 연평균 성장률(CAGR)은 19.56%가 될 것으로 전망됩니다.
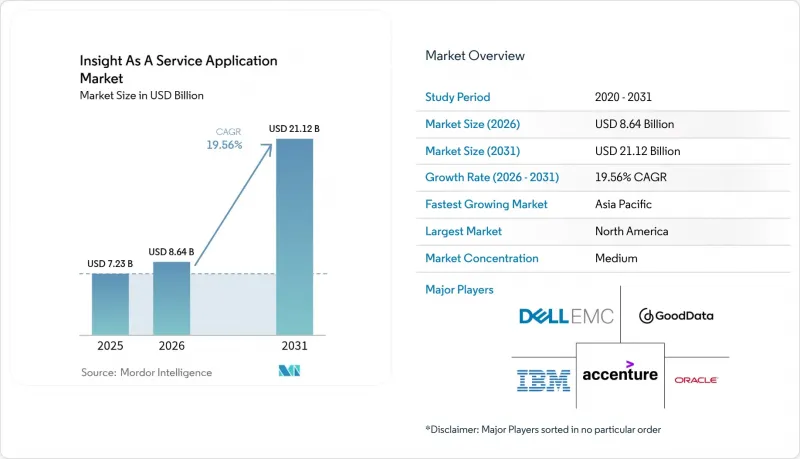
본 보고서는 배포 모드(퍼블릭 클라우드 등), 서비스 유형(예측 인사이트 등), 용도(고객 라이프사이클 관리 등), 조직 규모(대기업, 중소기업), 최종 사용자 산업(은행, 금융서비스 및 보험(BFSI), IT 및 통신 등), 지역(북미 등)별로 세분화되어 있습니다. 시장 전망은 금액(달러) 기준으로 제시되어 있습니다.
세계 IaaS(Insight As A Service) 애플리케이션 시장 동향 및 인사이트
자동화된 인사이트 생성을 위한 생성형 AI 활용 확대
생성형 AI 덕분에 인사이트 제공에 소요되는 시간이 며칠에서 몇 분으로 단축되었습니다. IBM의 ‘watsonx.Data’는 레이크하우스 환경 내에 대규모 언어 모델을 통합하여, 분석가가 구조화 및 비구조화 데이터에 대해 대화 형식으로 쿼리를 실행할 수 있도록 합니다. Snowflake는 1분기에 120억 건의 Cortex AI 쿼리를 처리했으며, 그중 35%가 문서 요약 등의 생성형 기능을 활용했습니다. SAP 고객은 Joule Copilot을 Analytics Cloud와 통합한 결과, 월말 결산 주기를 60% 단축했습니다. 생성형 AI는 내러티브 생성 및 이상 감지를 자동화함으로써 분석을 널리 활용할 수 있게 하고, IaaS(Insight As A Service) 애플리케이션 시장을 확대되고 있습니다.
사용량 기반 분석 구독으로의 전환
기본 요금과 초과 사용 요금을 결합한 하이브리드 가격 정책은 현재 SaaS 벤더의 61%에서 채택되고 있으며, 이는 2022년의 38%에서 증가한 수치입니다. Databricks의 종량제 수익은 고객이 실시간 및 머신러닝 워크로드를 확대함에 따라 전년 대비 75% 증가하여, 라이선스 수 기준 성장률의 3배에 달했습니다. 이 유연한 모델은 중소기업의 자본적 장벽을 제거하고, 벤더의 인센티브를 성과와 연계함으로써 고정 요금제에 비해 평균 18개월 더 긴 고객 유지 기간을 실현하고 있습니다.
데이터 보안 및 안전성에 대한 우려
2024년 6월에 발생한 Snowflake의 보안 침해 사건에서는 공격자가 재사용된 인증 정보를 사용한 결과, 165건의 고객 환경이 유출되어 클라우드 분석에 대한 신뢰가 흔들렸습니다. IBM X-Force의 조사에 따르면, 침해 사고의 28%는 설정 오류로 인한 것이었으며, 그 중 상당수는 분석 서비스의 복잡한 권한 모델과 관련이 있었습니다. 유럽의 NIS2 지침에서는 사고 발생 시 24시간 이내에 공개할 것을 의무화하고 있어 규정 준수 압박이 커지고 있습니다. 감시가 강화됨에 따라 조달 프로세스가 지연되고 개념 증명(PoC) 주기가 길어지면서 단기적인 사업 확장이 제한되고 있습니다.
부문 분석
2025년에는 퍼블릭 클라우드가 IaaS(Insight As A Service) 애플리케이션 시장의 55.02% 점유율을 차지했지만, 하이브리드 환경은 2031년까지 연평균 성장률(CAGR) 20.24%로 확대될 것으로 전망됩니다. IBM의 조사에 따르면, 기업의 87%가 여러 클라우드를 이용하고 있으며, 그중 62%는 규정 준수를 그 요인으로 꼽고 있습니다. 기업들이 On-Premise와 퍼블릭 클라우드를 아우르며 Kubernetes를 오케스트레이션함에 따라 Red Hat OpenShift의 구독 건수는 전년 대비 34% 증가했습니다.
금융 기관들이 기밀 데이터를 On-Premise에 보관하면서 하이퍼스케일러 리전에서 모델 훈련을 계속함에 따라 하이브리드 환경 도입이 확대되고 있습니다. Google Cloud의 기밀 컴퓨팅은 처리 중 데이터를 암호화함으로써 규제 대상 워크로드를 퍼블릭 인프라로 이전하여, 2024년에는 의료 분야 고객 수를 58% 증가시켰습니다. 공장 및 매장의 엣지 노드는 현재 하이브리드 클라우드의 연장선상에 있으며, IaaS(Insight As A Service) 애플리케이션 시장의 침투를 더욱 심화시키고 있습니다.
처방형 인사이트는 현재로서는 예측형 인사이트의 수익에는 미치지 못하지만, 기업이 업무상 의사 결정을 자동화함에 따라 연평균 성장률(CAGR) 23.12%로 확대되고 있습니다. Anaplan의 ‘커넥티드 플래닝(Connected Planning)’은 소비재 제조업체의 수동 시나리오 모델링을 70% 줄여줍니다. Workday가 2024년에 최적화 엔진을 인수한 것은 추천 중심 서비스로의 전환을 뒷받침하는 사례입니다.
심층 강화 학습은 그 처방적 힘을 입증하고 있습니다. DeepMind는 2024년, Google 데이터센터의 에너지 사용량을 40% 절감했습니다. 더 많은 기업이 의사결정 엔진을 워크플로에 직접 통합함에 따라, 처방적 플랫폼을 위한 IaaS(Insight As A Service) 애플리케이션 시장 규모는 확대될 것입니다.
지역별 분석
2025년, 북미는 IaaS(Insight As A Service) 애플리케이션 시장의 40.77%를 차지했습니다. 미국 연방 데이터 전략은 2025년까지 공공 데이터 세트에 대해 오픈 API 사용을 의무화하고 있으며, 이로 인해 정부의 분석 수요가 확대되고 있습니다. 캐나다는 연방 정부 기관의 클라우드 전환에 24억 캐나다 달러(18억 달러)를 배정하여 해당 지역의 성장을 뒷받침하고 있습니다. 멕시코의 오픈 뱅킹 규제로 인해 2024년 말까지 월간 4억 5,000만 건의 API 호출이 발생하며 핀테크 분석을 촉진하고 있습니다.
아시아태평양은 연평균 성장률(CAGR) 21.77%를 기록하며 세계에서 가장 빠른 성장률을 보일 것으로 예측됩니다. 중국의 ‘디지털 경제 발전 계획’은 데이터 주도형 산업의 연간 10% 성장을 목표로 하고 있습니다. 인도의 ‘디지털 인디아(Digital India)’ 이니셔티브를 통해 12억 명의 주민이 디지털 ID 및 결제 서비스를 이용할 수 있게 되면서, 공공 서비스 분야의 분석 워크로드가 확대되고 있습니다. 싱가포르는 ‘스마트 네이션’ 프로그램의 일환으로 11만 개의 센서를 도입하여 실시간 최적화 모델에 데이터를 공급하고 있습니다. 정부의 규제와 하이퍼스케일러의 투자가 맞물려 IaaS(Insight As A Service) 애플리케이션 시장의 입지를 더욱 공고히 하고 있습니다.
유럽의 GDPR(EU 개인정보보호규정)은 엄격한 데이터 최소화 및 삭제 규정을 통해 아키텍처 설계에 영향을 미치고 있으며, 프로젝트 비용을 15-20% 상승시키고 있습니다. 독일의 Gaia-X 연합은 2024년 말까지 350개사를 회원사로 유치하여 분산형 분석 플랫폼에 대한 수요를 촉진하고 있습니다. 영국은 공공 부문 데이터 현대화에 12억 파운드(15억 달러)를 예산으로 편성했으며, 그 중 40%가 국민보건서비스(NHS) 프로젝트에 배정되었습니다. 신흥 시장에서도 사우디아라비아의 5,000억 달러 규모 스마트 시티 ‘NEOM’ 구축 등 국지적인 활기가 나타나고 있습니다. 이곳에서는 엣지 분석이 교통 및 에너지 최적화를 뒷받침하고 있습니다.
기타 혜택:
- 엑셀 형식 시장 예측(ME) 시트
- 3개월간의 애널리스트 지원
자주 묻는 질문
목차
제1장 서론
제2장 조사 방법
제3장 주요 요약
제4장 시장 구도
제5장 시장 규모와 성장 예측
제6장 경쟁 구도
제7장 시장 기회와 향후 전망
JHS 26.09.09According to Mordor Intelligence, the insight-as-a-service application market size in 2026 is estimated at USD 8.64 billion, growing from 2025 value of USD 7.23 billion with 2031 projections showing USD 21.12 billion, growing at 19.56% CAGR over 2026-2031.
This report is Segmented by Deployment Mode (Public Cloud, and More), Service Type (Predictive Insights, and More), Application (Customer Life-Cycle Management, and More), Organization Size (Large Enterprises, and Small and Medium Enterprises), End-User Industry (BFSI, IT and Telecom, and More), and Geography (North America, and More). The Market Forecasts are Provided in Terms of Value (USD).
Global Insight As A Service Application Market Trends and Insights
Growing Use of Generative AI for Automated Insights
Generative AI is compressing insight delivery from days to minutes. IBM's watsonx.Data embeds large language models inside lakehouse environments, allowing analysts to query structured and unstructured data conversationally. Snowflake processed 12 billion Cortex AI queries in its first quarter, with 35% of these queries utilizing generative functions, such as document summarization. SAP customers cut month-end close cycles by 60% after integrating the Joule Copilot with Analytics Cloud. By automating narrative creation and anomaly detection, generative AI democratizes analytics and broadens the insight-as-a-service application market.
Migration Toward Consumption-Based Analytics Subscriptions
Hybrid pricing, which combines a base fee with usage overages, now covers 61% of software-as-a-service vendors, up from 38% in 2022. Databricks' consumption revenue rose 75% year over year, triple its seat-based growth, after customers expanded real-time and machine-learning workloads. The flexible model removes capital barriers for SMEs and aligns vendor incentives with performance, fueling retention that averages 18 months longer than fixed plans.
Data Security and Safety Concerns
Snowflake's June 2024 breach exposed 165 customer environments after attackers used recycled credentials, shaking confidence in cloud analytics. IBM's X-Force found misconfigurations caused 28% of breaches, many tied to complex permission models on analytics services. Europe's NIS2 directive now requires incident disclosure within 24 hours, adding compliance pressure. Heightened scrutiny slows procurement and lengthens proof-of-concept cycles, limiting near-term expansion.
Other drivers and restraints analyzed in the detailed report include:
- Increasing Adoption of Big Data and IoT
- Increasing Customer Engagement Demand
- Shortage of Domain-Specific Data-Science Talent
For complete list of drivers and restraints, kindly check the Table Of Contents.
Segment Analysis
Hybrid environments are projected to grow at a 20.24% CAGR through 2031, despite the public cloud holding a 55.02% share of the insight-as-a-service application market in 2025. IBM found 87% of enterprises use multiple clouds, with 62% citing compliance as a driver. Red Hat OpenShift subscriptions rose 34% year over year as firms orchestrated Kubernetes across on-premise and public clouds.
Hybrid adoption is on the rise as financial institutions continue to store sensitive data on-premises while training models in hyperscaler regions. Google Cloud's confidential computing encrypts data during processing, bringing regulated workloads to public infrastructure and lifting healthcare customer count 58% in 2024. Edge nodes at factories and stores are now extensions of hybrid clouds, deepening the penetration of the insight-as-a-service application market.
Prescriptive insights, though trailing predictive insight revenue today, are advancing at a 23.12% CAGR as companies automate operational choices. Anaplan's connected planning reduces manual scenario modeling by 70% for consumer goods manufacturers. Workday's 2024 purchase of an optimization engine confirms the pivot toward recommendation-oriented services.
Deep reinforcement learning demonstrates its prescriptive power: DeepMind reduced Google's data-center energy use by 40% in 2024. As more firms embed decision engines directly into workflows, the insight-as-a-service application market size for prescriptive platforms will widen.
Complete Report Scope:
- By Deployment Mode
- Public Cloud
- Private Cloud
- Hybrid Cloud
- By Service Type
- Predictive Insights
- Descriptive Insights
- Prescriptive Insights
- By Application
- Customer Life-Cycle Management
- Revenue Cycle Management
- Branding and Marketing Insights
- Strategy Management
- Supply-Chain Optimization
- Other Applications
- By Organization Size
- Large Enterprises
- Small and Medium Enterprises
- By End-user Industry
- BFSI
- IT and Telecom
- Healthcare
- Retail and E-Commerce
- Manufacturing
- Energy and Utilities
- Other End-user Industries
- By Geography
- North America
- United States
- Canada
- Mexico
- South America
- Brazil
- Argentina
- Rest of South America
- Europe
- Germany
- United Kingdom
- France
- Italy
- Spain
- Rest of Europe
- Asia Pacific
- China
- Japan
- India
- South Korea
- Rest of Asia Pacific
- Middle East and Africa
- Middle East
- Saudi Arabia
- United Arab Emirates
- Turkey
- Rest of Middle East
- Africa
- South Africa
- Nigeria
- Kenya
- Rest of Africa
- Middle East
- North America
Geography Analysis
North America accounted for 40.77% of the insight-as-a-service application market in 2025. The United States Federal Data Strategy mandates the use of open APIs for public datasets by 2025, thereby expanding government analytics demand. Canada allocated CAD 2.4 billion (USD 1.8 billion) for cloud migration in federal agencies, supporting regional growth. Mexico's open-banking regulation generated 450 million API calls monthly by year-end 2024, catalyzing fintech analytics.
The Asia Pacific is projected to post a 21.77% CAGR, the fastest growth rate worldwide. China's Digital Economy Development Plan aims for a 10% annual expansion in data-driven industries. India's Digital India initiative connected 1.2 billion residents to digital ID and payments, broadening analytics workloads in public services. Singapore deployed 110,000 sensors under its Smart Nation program, feeding real-time optimization models. Government mandates and hyperscaler investment combine to deepen the insight-as-a-service application market footprint.
Europe's GDPR influences architectural design through strict data minimization and deletion rules, adding 15-20% to project costs. Germany's Gaia-X federation enrolled 350 firms by late 2024, spurring demand for distributed analytics platforms. The United Kingdom budgeted GBP 1.2 billion (USD 1.5 billion) for public-sector data modernization, with National Health Service projects taking 40% of spending. Emerging markets show pockets of momentum, such as Saudi Arabia's USD 500 billion NEOM smart-city deployment, where edge analytics underpin transport and energy optimization.
- Oracle Corporation
- Accenture plc
- International Business Machines Corporation
- Dell Technologies Inc.
- Deloitte Touche Tohmatsu Limited
- GoodData Corporation
- Capgemini SE
- SmartFocus Ltd.
- Zephyr AI Health Inc.
- NTT Data Corporation
- Microsoft Corporation
- Amazon Web Services Inc.
- Google LLC
- SAP SE
- SAS Institute Inc.
- Salesforce Inc.
- TIBCO Software Inc.
- Alteryx Inc.
- QlikTech International AB
- Tableau Software LLC
- Sisense Inc.
- Domo Inc.
- Teradata Corporation
- MicroStrategy Incorporated
Additional Benefits:
- The market estimate (ME) sheet in Excel format
- 3 months of analyst support
TABLE OF CONTENTS
1 INTRODUCTION
- 1.1 Study Assumptions and Market Definition
- 1.2 Scope of the Study
2 RESEARCH METHODOLOGY
3 EXECUTIVE SUMMARY
4 MARKET LANDSCAPE
- 4.1 Market Overview
- 4.2 Impact of Macroeconomic Factors on the Market
- 4.3 Market Drivers
- 4.3.1 Increasing Adoption of Big Data and IoT
- 4.3.2 Increasing Customer Engagement Demand
- 4.3.3 Growing Use of Generative AI for Automated Insights
- 4.3.4 Migration Toward Consumption-Based Analytics Subscriptions
- 4.3.5 Rising Compliance Complexity Driving Outsourced Insight Demand
- 4.3.6 Expansion of Industry-Specific Vertical AI Platforms
- 4.4 Market Restraints
- 4.4.1 Data Security and Safety Concerns
- 4.4.2 Shortage of Domain-Specific Data-Science Talent
- 4.4.3 Vendor Lock-In and Interoperability Challenges
- 4.4.4 Escalating Cloud-Compute Cost Pressures
- 4.5 Industry Value Chain Analysis
- 4.6 Regulatory Landscape
- 4.7 Technological Outlook
- 4.8 Porter's Five Forces Analysis
- 4.8.1 Threat of New Entrants
- 4.8.2 Bargaining Power of Buyers
- 4.8.3 Bargaining Power of Suppliers
- 4.8.4 Threat of Substitute Products
- 4.8.5 Intensity of Competitive Rivalry
5 MARKET SIZE AND GROWTH FORECASTS (VALUE)
- 5.1 By Deployment Mode
- 5.1.1 Public Cloud
- 5.1.2 Private Cloud
- 5.1.3 Hybrid Cloud
- 5.2 By Service Type
- 5.2.1 Predictive Insights
- 5.2.2 Descriptive Insights
- 5.2.3 Prescriptive Insights
- 5.3 By Application
- 5.3.1 Customer Life-Cycle Management
- 5.3.2 Revenue Cycle Management
- 5.3.3 Branding and Marketing Insights
- 5.3.4 Strategy Management
- 5.3.5 Supply-Chain Optimization
- 5.3.6 Other Applications
- 5.4 By Organization Size
- 5.4.1 Large Enterprises
- 5.4.2 Small and Medium Enterprises
- 5.5 By End-user Industry
- 5.5.1 BFSI
- 5.5.2 IT and Telecom
- 5.5.3 Healthcare
- 5.5.4 Retail and E-Commerce
- 5.5.5 Manufacturing
- 5.5.6 Energy and Utilities
- 5.5.7 Other End-user Industries
- 5.6 By Geography
- 5.6.1 North America
- 5.6.1.1 United States
- 5.6.1.2 Canada
- 5.6.1.3 Mexico
- 5.6.2 South America
- 5.6.2.1 Brazil
- 5.6.2.2 Argentina
- 5.6.2.3 Rest of South America
- 5.6.3 Europe
- 5.6.3.1 Germany
- 5.6.3.2 United Kingdom
- 5.6.3.3 France
- 5.6.3.4 Italy
- 5.6.3.5 Spain
- 5.6.3.6 Rest of Europe
- 5.6.4 Asia Pacific
- 5.6.4.1 China
- 5.6.4.2 Japan
- 5.6.4.3 India
- 5.6.4.4 South Korea
- 5.6.4.5 Rest of Asia Pacific
- 5.6.5 Middle East and Africa
- 5.6.5.1 Middle East
- 5.6.5.1.1 Saudi Arabia
- 5.6.5.1.2 United Arab Emirates
- 5.6.5.1.3 Turkey
- 5.6.5.1.4 Rest of Middle East
- 5.6.5.2 Africa
- 5.6.5.2.1 South Africa
- 5.6.5.2.2 Nigeria
- 5.6.5.2.3 Kenya
- 5.6.5.2.4 Rest of Africa
- 5.6.5.1 Middle East
- 5.6.1 North America
6 COMPETITIVE LANDSCAPE
- 6.1 Market Concentration
- 6.2 Strategic Moves
- 6.3 Market Share Analysis
- 6.4 Company Profiles (includes Global Level Overview, Market Level Overview, Core Segments, Financials as available, Strategic Information, Market Rank / Share for Key Companies, Products and Services, and Recent Developments)
- 6.4.1 Oracle Corporation
- 6.4.2 Accenture plc
- 6.4.3 International Business Machines Corporation
- 6.4.4 Dell Technologies Inc.
- 6.4.5 Deloitte Touche Tohmatsu Limited
- 6.4.6 GoodData Corporation
- 6.4.7 Capgemini SE
- 6.4.8 SmartFocus Ltd.
- 6.4.9 Zephyr AI Health Inc.
- 6.4.10 NTT Data Corporation
- 6.4.11 Microsoft Corporation
- 6.4.12 Amazon Web Services Inc.
- 6.4.13 Google LLC
- 6.4.14 SAP SE
- 6.4.15 SAS Institute Inc.
- 6.4.16 Salesforce Inc.
- 6.4.17 TIBCO Software Inc.
- 6.4.18 Alteryx Inc.
- 6.4.19 QlikTech International AB
- 6.4.20 Tableau Software LLC
- 6.4.21 Sisense Inc.
- 6.4.22 Domo Inc.
- 6.4.23 Teradata Corporation
- 6.4.24 MicroStrategy Incorporated
7 MARKET OPPORTUNITIES AND FUTURE OUTLOOK
- 7.1 White-Space and Unmet-Need Assessment


