

|
시장보고서
상품코드
2123087
의약품 위탁 개발 제조 기관(CDMO) 시장 : 점유율 분석, 업계 동향과 통계, 성장 예측(2026-2031년)Pharmaceutical Contract Development And Manufacturing Organization (CDMO) - Market Share Analysis, Industry Trends & Statistics, Growth Forecasts (2026 - 2031) |
||||||
 Mordor Intelligence
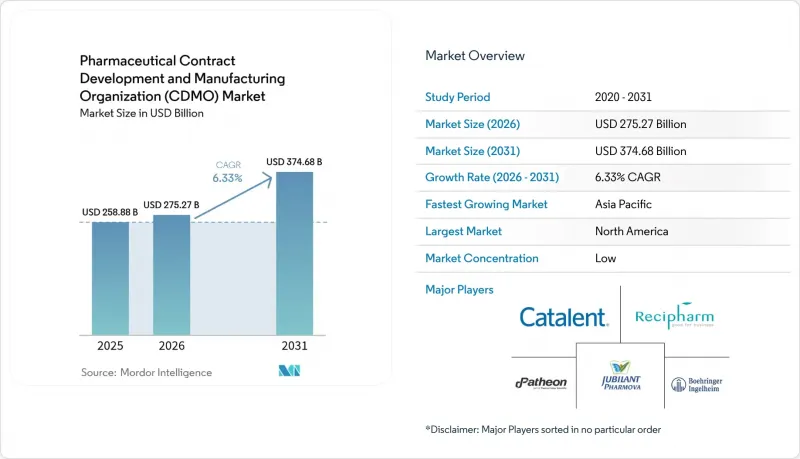
Mordor Intelligence에 의하면, 의약품 위탁 개발 제조 기관(CDMO) 시장 규모는 2025년 2,588억 8,000만 달러에서 2026년에는 2,752억 7,000만 달러로 확대되어 2026년부터 2031년까지 CAGR 6.33%로 성장을 지속하여, 2031년에는 3,746억 8,000만 달러에 이를 것으로 예측됩니다.
본 보고서는 서비스 유형별(API 제조 등), 분자 유형별(소분자 화합물 등), 제형(고형 경구제, 무균 주사제 등), 치료 분야(종양학, 대사·내분비 등) 및 지역별로 분류되어 있습니다. 시장 예측은 금액(달러) 기준으로 제시되어 있습니다.
세계 의약품 위탁 개발 제조 기관(CDMO) 시장 동향 및 인사이트
대형 제약사의 아웃소싱 증가
연구개발(R&D) 비용의 급등과 파이프라인의 복잡화로 인해, 대형 제약 기업들은 비핵심 제조 업무를 외부에 위탁하고 있습니다. 자산을 최소화하는 비즈니스 모델을 통해 신약 개발에 자금을 집중하는 한편, CDMO의 전문 지식을 활용하여 전 세계 공급의 지속성을 유지하고 있습니다. Lonza가 Roche로부터 12억 달러에 바카빌 사업장을 인수한 것은 이러한 전환을 뒷받침하는 사례이며, 이를 통해 블록버스터급 항체 수요를 뒷받침하기 위해 33만 리터의 바이오의약품 생산 능력을 추가하게 됩니다. 아웃소싱이 가장 활발한 분야는 무균 바이오의약품 및 유전자 편집 치료 분야입니다. 이러한 분야에서는 엄격한 규제와 기술적 장벽으로 인해 전문 파트너의 가치가 높아지고 있습니다.
바이오의약품 및 복합 분자 파이프라인의 급증
항체-약물 복합체(ADC), mRNA 백신, 세포 치료제의 성장에 힘입어 현재 신약 신청의 대부분을 바이오의약품이 차지하고 있습니다. 삼성바이오로직스는 2024년에 14억 달러 규모의 신규 계약을 수주하고 항체-약물 복합체(ADC) 생산 라인을 확충하고 있으며, 이는 cGMP 준수 바이오의약품 공급에 대한 수요가 급증하고 있음을 보여줍니다. 바이오의약품에 요구되는 엄격한 콜드체인, 오염 관리 및 분석 요건으로 인해, 규제 측면에서 실적이 입증된 풀 스코프 CDMO를 선호하는 경향이 더욱 강화되고 있습니다.
엄격한 다지역 규제 요건
제출 서류의 차이 및 유럽의약품청(EMA)의 새로운 수수료 규정 등 지속적인 업데이트로 인해 규정 준수 예산이 증가하고, EMA에 변경 신청을 하는 리드타임이 길어지고 있습니다. CDMO는 FDA, EMA, PMDA의 각 감사에 대응하기 위해 중복되는 품질 관리 시스템을 운영하고 데이터 무결성 프로토콜을 조율해야 하는데, 이는 소규모 진출기업에게 큰 과제가 되고 있습니다.
지역별 분석
북미는 주요 생물학적 제제 프로그램, FDA의 희귀질환 치료제(희귀의약품) 우대 조치, 그리고 풍부한 벤처 캐피탈 자금 공급에 힘입어 2025년에도 매출 점유율 37.95%를 유지했습니다. 미국에서는 cGMP 준수 비용과 엄격한 데이터 무결성 감사로 인해 진입 장벽이 높아지고 있어 프리미엄 가격 책정이 유지되고 있습니다. 캐나다는 자유무역에 따른 시장 접근성과 숙련된 인력의 혜택을 누리고 있는 반면, 멕시코는 2차 포장 및 지역적 고형 경구용 의약품 프로젝트를 유치하고 있습니다. Thermo Fisher의 41억 달러 규모 여과 사업 인수는 북미에서의 수직 통합 전략을 강화하는 조치입니다. 아시아태평양은 2031년까지 연평균 성장률(CAGR) 7.18%로 가장 높은 성장세를 기록하고 있습니다. 중국과 한국은 mAb 및 올리고뉴클레오티드용 초대형 플랜트에 자금을 투자하고 있지만, 지정학적 리스크로 인해 미국의 스폰서 기업들은 인도와 동남아시아로 눈을 돌리고 있습니다. 인도의 의약품 위탁 개발 제조 기관(CDMO) 시장 규모는 PLI(생산 연계형 인센티브) 제도와 통일된 품질 기준에 힘입어 2035년까지 단독으로 220억 달러를 넘어설 가능성이 있습니다. 삼성바이오로직스의 제4공장(60만 리터 이상) 가동에 힘입어 인천은 세계 최대의 단일 바이오의약품 허브로서의 입지를 공고히 하고 있습니다. 호주는 초기 단계의 종양학 및 세포 치료 임상시험을 위해 신속한 규제 심사 절차를 활용하고 있습니다.
유럽은 품질 측면에서의 리더십을 바탕으로 꾸준한 확장을 보이고 있습니다. 독일의 연속 제조 클러스터와 영국의 첨단 치료 코리도는 상호 승인 면제 조치를 통해 브렉시트로 인한 마찰을 상쇄하고 있습니다. 유럽의약품청(EMA)의 변경 신청 수수료 개정은 단기적으로는 규정 준수 비용을 증가시키지만, 전 세계 후원 기업들에게 일관된 심사 엄격성을 보장해 줍니다. 동유럽은 고형 경구용 제네릭 의약품 및 2차 포장 생산 거점으로서 기세를 더하고 있습니다. 지속가능성에 관한 규제는 용매 회수 장치 및 저에너지 동결 건조를 촉진하여 공정 혁신을 주도하고 있습니다.
기타 혜택:
- 엑셀 형식 시장 예측(ME) 시트
- 3개월간의 애널리스트 지원
자주 묻는 질문
목차
제1장 서론
제2장 조사 방법
제3장 주요 요약
제4장 시장 구도
제5장 시장 규모와 성장 예측
제6장 경쟁 구도
제7장 시장 기회와 향후 전망
JHS 26.09.09According to Mordor Intelligence, the pharmaceutical contract development and manufacturing organization (CDMO) market size is expected to grow from USD 258.88 billion in 2025 to USD 275.27 billion in 2026 and is forecast to reach USD 374.68 billion by 2031 at 6.33% CAGR over 2026-2031.
This report is Segmented by Service Type (API Manufacturing, and More), Molecule Type (Small Molecule, and More), Dosage Form (Solid Oral, Sterile Injectables, and More), Therapeutic Area (Oncology, Metabolic and Endocrine, and More), and Geography. The Market Forecasts are Provided in Terms of Value (USD).
Global Pharmaceutical Contract Development And Manufacturing Organization (CDMO) Market Trends and Insights
Increasing Outsourcing Volume by Large Pharmaceutical Companies
Escalating R&D costs and pipeline complexity drive pharmaceutical majors to off-load non-core manufacturing. Asset-light models free capital for discovery while leveraging CDMO expertise to maintain global supply continuity. Lonza's USD 1.2 billion Vacaville site purchase from Roche underpins this transition, adding 330,000 L of biologics capacity to support blockbuster antibody demand. Outsourcing is most intense for sterile biologics and gene-editing therapies, where regulatory rigor and technical barriers heighten the value of specialist partners.
Surge in Biologics and Complex-Molecule Pipelines
Biological entities now dominate new-drug filings, propelled by antibody-drug conjugates, mRNA vaccines, and cell-based therapeutics. Samsung Biologics secured USD 1.4 billion in new 2024 contracts and is expanding antibody-drug-conjugate suites, illustrating spiraling demand for cGMP biologics supply . Biologics' stringent cold-chain, contamination-control, and analytics requirements solidify a preference for full-scope CDMOs with proven regulatory track records.
Stringent Multi-Region Regulatory Requirements
Divergent dossiers and rolling updates such as the European Medicines Agency's new fee rules raise compliance budgets and prolong variation lead times EMA. CDMOs must operate duplicate quality-management systems and align data-integrity protocols across FDA, EMA, and PMDA audits, challenging smaller entrants.
Other drivers and restraints analyzed in the detailed report include:
- Cost and Speed Advantage of Manufacturing in Emerging Markets
- Consolidation Toward One-Stop CDMOs
- High Capex for Sterile Biologics Suites
For complete list of drivers and restraints, kindly check the Table Of Contents.
Geography Analysis
North America retained 37.95% revenue share in 2025, buoyed by premier biologics programs, FDA Orphan-Drug incentives, and a deep venture-capital pool. The United States sustains premium pricing as cGMP compliance costs and stringent data-integrity audits elevate barriers to entry. Canada benefits from free-trade access and skilled resources, whereas Mexico lures secondary packaging and regional solid-oral projects. Thermo Fisher's USD 4.1 billion filtration-business acquisition reinforces North American vertical-integration strategies.Asia-Pacific logs the fastest 7.18% CAGR through 2031. China and South Korea bankroll mega-plants for mAbs and oligonucleotides, though geopolitical risk nudges US sponsors toward India and Southeast Asia. The Pharmaceutical contract development and manufacturing organization (CDMO) market size in India alone could surpass USD 22 billion by 2035, aided by PLI incentives and harmonized quality standards.Samsung Biologics' fourth plant, topping 600,000 L, cements Incheon as the world's largest single-site biologics hub. Australia leverages expedited regulatory pathways for early-phase oncology and cell-therapy trials.
Europe presents steady expansion anchored in quality leadership. Germany's continuous-manufacturing clusters and the United Kingdom's advanced-therapy corridor offset Brexit friction through mutual-recognition waivers. The EMA's updated variation fees raise short-term compliance costs but assure global sponsors of consistent review rigor. Eastern Europe gains traction as an overflow destination for solid-oral generics and secondary packaging. Sustainability regulations incentivize solvent-recovery units and low-energy lyophilization, driving process innovation.
- Thermo Fisher Scientific Inc. (Patheon)
- Lonza Group
- Catalent Inc.
- Samsung Biologics Co. Ltd.
- WuXi AppTec Inc.
- Recipharm AB
- Jubilant Pharmova Ltd.
- Boehringer Ingelheim Group
- Pfizer CentreOne
- Aenova Holding GmbH
- Fujifilm Diosynth Biotechnologies
- Baxter BioPharma Solutions
- Corden Pharma GmbH
- AbbVie Contract Manufacturing
- Cambrex Corporation
- Syneos Health Inc.
- IQVIA Holdings Inc.
- Labcorp Drug Development
- PAREXEL International Corporation
- ICON PLC
- Charles River Laboratories International Inc.
- Eurofins Scientific SE
- SGS Life Science Services SA
- CMIC Holdings Co. Ltd
- Novotech Pty Ltd
- Hangzhou Tigermed Consulting Co. Ltd
- Samsung Bioepis Co. Ltd
- Tesa Labtec GmbH (TESA SE)
- Tapemark
- Famar SA
Additional Benefits:
- The market estimate (ME) sheet in Excel format
- 3 months of analyst support
TABLE OF CONTENTS
1 INTRODUCTION
- 1.1 Study Assumptions and Market Definition
- 1.2 Scope of the Study
2 RESEARCH METHODOLOGY
3 EXECUTIVE SUMMARY
4 MARKET LANDSCAPE
- 4.1 Market Overview
- 4.2 Market Drivers
- 4.2.1 Increasing outsourcing volume by large pharmaceutical companies
- 4.2.2 Surge in biologics and complex-molecule pipelines
- 4.2.3 Cost- and speed-advantage of manufacturing in emerging markets
- 4.2.4 Consolidation toward end-to-end one-stop CDMOs
- 4.2.5 AI-enabled rapid process-development platforms
- 4.2.6 GLP-1 and peptide HPAPI capacity build-outs
- 4.3 Market Restraints
- 4.3.1 Stringent multi-region regulatory requirements
- 4.3.2 Capacity-utilization and lead-time risk
- 4.3.3 High capex for sterile biologics suites
- 4.3.4 Scarcity of skilled aseptic-manufacturing talent
- 4.4 Supply-Chain Analysis
- 4.5 Regulatory Landscape
- 4.6 Technological Outlook
- 4.6.1 Dosage-formulation technologies
- 4.6.2 3D printing applications in OSD
- 4.6.3 Continuous-manufacturing adoption
- 4.7 Porter's Five Forces Analysis
- 4.7.1 Bargaining Power of Suppliers
- 4.7.2 Bargaining Power of Buyers
- 4.7.3 Threat of New Entrants
- 4.7.4 Threat of Substitutes
- 4.7.5 Competitive Rivalry
- 4.8 Investment and Funding Landscape
5 MARKET SIZE AND GROWTH FORECASTS (VALUE)
- 5.1 By Service Type
- 5.1.1 API Manufacturing
- 5.1.1.1 Small Molecule
- 5.1.1.2 Large Molecule
- 5.1.1.3 High-Potency (HPAPI)
- 5.1.2 FDF Development and Manufacturing
- 5.1.2.1 Solid Dose
- 5.1.2.2 Liquid Dose
- 5.1.2.3 Injectable Dose
- 5.1.3 Secondary Packaging
- 5.1.1 API Manufacturing
- 5.2 By Molecule Type
- 5.2.1 Small Molecule
- 5.2.2 Large Molecule (Biologics and Biosimilars)
- 5.2.3 High-Potency APIs
- 5.3 By Dosage Form
- 5.3.1 Solid Oral
- 5.3.2 Sterile Injectables
- 5.3.3 Topicals and Transdermals
- 5.3.4 Specialty/Novel (e.g., ODT, Long-acting)
- 5.4 By Therapeutic Area
- 5.4.1 Oncology
- 5.4.2 Metabolic and Endocrine
- 5.4.3 Cardiovascular
- 5.4.4 CNS and Psychiatry
- 5.4.5 Infectious Diseases and Vaccines
- 5.5 By Geography
- 5.5.1 North America
- 5.5.1.1 United States
- 5.5.1.2 Canada
- 5.5.1.3 Mexico
- 5.5.2 Europe
- 5.5.2.1 Germany
- 5.5.2.2 United Kingdom
- 5.5.2.3 France
- 5.5.2.4 Italy
- 5.5.2.5 Spain
- 5.5.2.6 Russia
- 5.5.2.7 Rest of Europe
- 5.5.3 Asia-Pacific
- 5.5.3.1 China
- 5.5.3.2 India
- 5.5.3.3 Japan
- 5.5.3.4 South Korea
- 5.5.3.5 Australia and New Zealand
- 5.5.3.6 Rest of Asia-Pacific
- 5.5.4 Middle East and Africa
- 5.5.4.1 Middle East
- 5.5.4.1.1 United Arab Emirates
- 5.5.4.1.2 Saudi Arabia
- 5.5.4.1.3 Turkey
- 5.5.4.1.4 Rest of Middle East
- 5.5.4.2 Africa
- 5.5.4.2.1 South Africa
- 5.5.4.2.2 Nigeria
- 5.5.4.2.3 Egypt
- 5.5.4.2.4 Rest of Africa
- 5.5.4.1 Middle East
- 5.5.5 South America
- 5.5.5.1 Brazil
- 5.5.5.2 Argentina
- 5.5.5.3 Rest of South America
- 5.5.1 North America
6 COMPETITIVE LANDSCAPE
- 6.1 Market Concentration
- 6.2 Strategic Moves
- 6.3 Market Share Analysis
- 6.4 Company Profiles (includes Global level Overview, Market level overview, Core Segments, Financials as available, Strategic Information, Market Rank/Share for key companies, Products and Services, and Recent Developments)
- 6.4.1 Thermo Fisher Scientific Inc. (Patheon)
- 6.4.2 Lonza Group
- 6.4.3 Catalent Inc.
- 6.4.4 Samsung Biologics Co. Ltd.
- 6.4.5 WuXi AppTec Inc.
- 6.4.6 Recipharm AB
- 6.4.7 Jubilant Pharmova Ltd.
- 6.4.8 Boehringer Ingelheim Group
- 6.4.9 Pfizer CentreOne
- 6.4.10 Aenova Holding GmbH
- 6.4.11 Fujifilm Diosynth Biotechnologies
- 6.4.12 Baxter BioPharma Solutions
- 6.4.13 Corden Pharma GmbH
- 6.4.14 AbbVie Contract Manufacturing
- 6.4.15 Cambrex Corporation
- 6.4.16 Syneos Health Inc.
- 6.4.17 IQVIA Holdings Inc.
- 6.4.18 Labcorp Drug Development
- 6.4.19 PAREXEL International Corporation
- 6.4.20 ICON PLC
- 6.4.21 Charles River Laboratories International Inc.
- 6.4.22 Eurofins Scientific SE
- 6.4.23 SGS Life Science Services SA
- 6.4.24 CMIC Holdings Co. Ltd
- 6.4.25 Novotech Pty Ltd
- 6.4.26 Hangzhou Tigermed Consulting Co. Ltd
- 6.4.27 Samsung Bioepis Co. Ltd
- 6.4.28 Tesa Labtec GmbH (TESA SE)
- 6.4.29 Tapemark
- 6.4.30 Famar SA
7 MARKET OPPORTUNITIES AND FUTURE OUTLOOK
- 7.1 White-space and Unmet-Need Assessment


