

|
시장보고서
상품코드
2123151
표면 검사 장비 시장 : 점유율 분석, 산업 동향 및 통계 데이터, 성장 예측(2026-2031년)Surface Vision & Inspection Equipment - Market Share Analysis, Industry Trends & Statistics, Growth Forecasts (2026 - 2031) |
||||||
 Mordor Intelligence
Mordor Intelligence에 의하면, 표면 검사 장비 시장 규모는 2025년 47억 2,000만 달러에서 2026년에는 50억 9,000만 달러로 확대되어 2026년부터 2031년까지 CAGR 7.93%로 성장을 지속하여, 2031년에는 74억 6,000만 달러에 이를 것으로 예측됩니다.
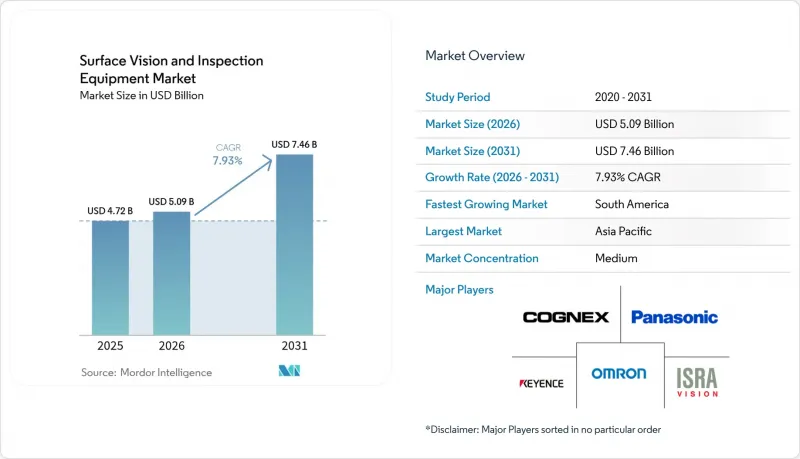
본 보고서는 구성 요소(카메라, 조명 장비 등), 시스템 유형(2D 비전 시스템, 3D 비전 시스템, AI 탑재 비전 시스템), 도입 모드(인라인/온라인 검사, 오프라인 검사 등), 적용 산업(자동차, 전기 및 전자 등), 지역별로 분류되어 있습니다. 시장 예측은 금액(달러) 기준으로 제시되어 있습니다.
전 세계 표면 검사 장비 시장 동향 및 고찰
저비용으로 제조 처리량을 향상시키려는 수요 증가
자격을 활용한 자동화를 통해 가공 업체는 99% 이상의 검출 정밀도를 유지하면서도 검사 주기를 수 분에서 수 초로 단축할 수 있게 되었습니다. 이는 4초 주기로 가동되는 절삭 공구 시스템(assemblymag.com)이 입증하고 있는 바와 같습니다. 중국에서 ‘다크 팩토리(Dark Factory)’로 운영되고 있는 전자기기 공장에서는 24시간 365일 생산 모델이 입증되었으며, 15-20%의 에너지 절감을 실현하고 있습니다. 따라서 비용 절감에 대한 압박은 이산형 및 공정형 제조업 전반에 걸쳐 표면 검사 장비 시장의 중요성을 더욱 높이고 있습니다.
정밀 산업에서 ‘무결점’ 품질에 대한 수요 증가
최첨단 반도체 노드, 전기차용 배터리 팩, 그리고 체내에 이식되는 의료기기의 경우, 잠재적인 결함은 일절 허용되지 않습니다. 예를 들어, Onto Innovation사는 DRAM 및 게이트 올 어라운드(GAA) 구조와 관련된 2025년 1분기 매출 성장을 보고하며, 검사가 웨이퍼 수율에 직결된다는 점을 강조하고 있습니다. 마찬가지로, 배터리 셀 제조업체들도 다운스트림 공정에서 발생할 수 있는 안전상의 문제를 미연에 방지하기 위해 24시간 체제의 시각적 분석 시스템을 도입하고 있습니다. 그 결과, 표면 검사 장비 시장은 고신뢰성 분야에서의 자본 배분 증가를 주도하고 있습니다.
숙련된 비전 엔지니어 부족과 통합의 복잡성
한국 중소기업 중 스마트 팩토리 도입을 보고한 곳은 불과 19.5%에 그쳤으며, 가장 큰 장벽으로 기술력 부족을 꼽고 있습니다. 코그넥스(Cognex)는 매출의 17%를 연구개발(R&D)에 투자하고, 로우코드 인터페이스를 통해 설정을 간소화함으로써 인력 부족 문제를 해결하기 위해 노력하고 있습니다. 그러나 인적 자본의 제약으로 인해 표면 검사 장비 시장의 단기적인 성장 속도는 계속해서 억제되고 있습니다.
부문 분석
카메라는 2025년 매출의 43.60%를 차지하며, 모든 검사 스택의 기반이 되는 요소로서의 입지를 공고히 하고 있습니다. 센서의 해상도, 프레임 속도 및 자외선 감도 분야의 발전으로 인해 반도체 백엔드 및 마이크로 LED 라인에서 감지 가능한 결함의 범위가 확대되고 있습니다. 조명 및 광학 시스템은 이러한 카메라와 긴밀하게 연동되어 연마된 금속 표면의 미세한 흠집을 시각화하거나 투명 기판 내의 공극을 감지합니다. 이 부문의 규모는 표면 검사 장비 시장을 지탱하는 핵심 축이 되고 있으며, 보완적인 광학 시스템 및 프레임 그래버에서 수량 할인 가격을 확보하는 데에도 기여하고 있습니다.
AI 지원 비전 플랫폼은 시장 규모는 작지만, 2031년까지 연평균 성장률(CAGR) 9.08%를 나타낼 것으로 예측됩니다. 컨볼루션 신경망을 스마트 카메라에 직접 통합함으로써, 기존에는 호스트 기반 추론이 필요했던 지연 시간이 단축됩니다. 코그넥스(Cognex)가 2024년 4월에 출시한 AI 탑재 통합형 3D 장치는 공급업체들이 현재 여러 하위 시스템을 단일 케이스에 통합하고 있는 실제 사례를 보여줍니다. 이러한 융합을 통해 비용 구조가 재편되고, 표면 검사 장비 시장 전체에서 대응 가능한 이용 사례가 확대될 것으로 전망됩니다.
2D 비전은 깊이 데이터가 거의 필요 없는 바코드 판독, 존재 확인, 라벨 검증 덕분에 62.30%의 점유율을 유지하고 있습니다. 이러한 기존 작업들은 라인 속도가 빨라짐에 따라 단계적인 업데이트를 통해 계속해서 수익을 확보하고 있습니다. 한편, AI 지원 구성은 연평균 성장률(CAGR) 8.55%라는 빠른 속도로 확대되고 있으며, 변동하는 조명 조건, 형상 변형, 그리고 규칙 기반 스크립트를 혼란스럽게 하는 겹치는 특징에 대해서도 견고성을 발휘하고 있습니다. AI 지원 시스템의 표면 검사 장비 시장 규모는 추론 엔진 비용 감소에 힘입어 2031년까지 22억 6,000만 달러에 달할 것으로 예측됩니다.
3D 이미징은 기어박스 하우징 측정이나 항공우주용 패스너의 깊이 검증과 같은 용도에서는 여전히 틈새 시장이지만, 구조화된 빛과 신경망 추론의 융합으로 인해 기존의 경계가 모호해지기 시작하고 있습니다. 2D, 3D 및 스펙트럼 정보를 통합된 소프트웨어 제품군 내에 통합하는 공급업체는 표면 검사 장비 업계에서 교차 판매를 통해 프리미엄 수익을 창출할 수 있을 것으로 전망됩니다.
지역별 분석
아시아태평양은 중국, 일본, 한국의 대규모 전자 및 자동차 공급망에 힘입어 2025년 세계 매출의 38.40%를 차지했습니다. 중국의 머신 비전 공급업체들은 국가 정책에 따른 ‘스마트 제조’ 추진 강화에 힘입어 2024년에 30% 이상의 매출 성장을 기록했습니다. 한국의 로봇 밀도(근로자 1만 명당 1,012대)는 지능형 광학 시스템을 통합한 자동화 하드웨어에 대한 해당 지역의 강력한 수요를 여실히 보여줍니다.
유럽 및 북미에서는 항공우주, 반도체 프런트엔드, 규제 대상 의료기기 등의 분야를 기반으로 견조한 수요가 유지되고 있으며, 이는 프리미엄 가격 책정을 정당화하고 있습니다. 북미의 표면 검사 장비 시장 규모는 전동화 및 프린트 전자 관련 프로젝트의 확대에 따라 2031년까지 19억 2,000만 달러에 육박할 것으로 예측됩니다. 또한, 각 제조업체는 통합의 복잡성을 극복하기 위해 높은 수준의 서비스를 제공하는 공급업체와의 긴밀한 관계를 중요시하고 있습니다.
남미는 연평균 성장률(CAGR) 8.16%로 가장 빠르게 성장하는 지역이며, 그 배경에는 브라질의 현대화 계획과 아르헨티나의 자동차 및 농업 기계 수출 확대 노력이 있습니다. 칠레와 브라질에서의 배터리 및 태양광 발전에 대한 투자는 비전 장비 공급업체에게 새로운 시장 기회를 제공합니다. 중동 및 아프리카은 여전히 신흥 시장이지만, 사우디아라비아와 아랍에미리트(UAE)에서의 의약품 생산 확대가 향후 수요 증가를 위한 기반을 마련하고 있습니다.
기타 혜택:
- Excel 형식 시장 예측(ME) 시트
- 3개월간의 애널리스트 지원
자주 묻는 질문
목차
제1장 서론
제2장 분석 방법
제3장 주요 요약
제4장 시장 구도
제5장 시장 규모와 성장 예측
제6장 경쟁 구도
제7장 시장 기회와 향후 전망
JHS 26.09.09According to Mordor Intelligence, the surface vision and inspection equipment market size is expected to grow from USD 4.72 billion in 2025 to USD 5.09 billion in 2026 and is forecast to reach USD 7.46 billion by 2031 at 7.93% CAGR over 2026-2031.
This report is Segmented by Component (Camera, Lighting Equipment, and More), System Type (2D Vision Systems, 3D Vision Systems, AI-Enabled Vision Systems), Deployment Mode (In-line/On-line Inspection, Off-Line Inspection, and More), Application Industry (Automotive, Electrical and Electronics, and More), and by Geography. The Market Forecasts are Provided in Terms of Value (USD).
Global Surface Vision & Inspection Equipment Market Trends and Insights
Increasing need for higher manufacturing throughput at lower cost
Vision-enabled automation is enabling processors to compress inspection cycles from minutes to seconds while sustaining >=99% detection accuracy, as evidenced by cutting-tool systems running four-second cycles assemblymag.com. Electronics factories operating as "dark" facilities in China validate the 24/7 production model and capture energy savings of 15-20%. Cost-down pressures therefore reinforce the case for the surface vision and inspection equipment market across discrete and process manufacturing.
Rising demand for zero-defect quality in precision industries
Advanced semiconductor nodes, electric-vehicle battery packs, and implantable medical devices tolerate no latent defects. For example, Onto Innovation reported Q1 2025 revenue growth tied to DRAM and gate-all-around geometries, underscoring inspection's link to wafer yield. Battery cell producers are similarly adopting round-the-clock visual analytics to prevent downstream safety failures. Consequently, the surface vision and inspection equipment market captures rising capital allocations in high-reliability segments.
Scarcity of skilled vision engineers and integration complexity
Only 19.5% of South Korean SMEs report smart-factory uptake, citing limited technical capability as the top hurdle. Cognex is countering the talent gap by channeling 17% of revenue into R&D to simplify setup through low-code interfaces. Yet the human-capital constraint continues to temper the near-term expansion rate of the surface vision and inspection equipment market.
Other drivers and restraints analyzed in the detailed report include:
- Adoption of Industry 4.0 and smart-factory automation
- Emergence of hyperspectral imaging for sub-surface defect detection
- High upfront cost of high-resolution 3D systems
For complete list of drivers and restraints, kindly check the Table Of Contents.
Segment Analysis
Cameras represented 43.60% of 2025 revenue, cementing their status as the foundational element of any inspection stack. Progress in sensor resolution, frame rate, and ultraviolet sensitivity is expanding the attainable defect envelope in semiconductor back-end and micro-LED lines. Lighting and optics integrate tightly with those cameras to expose fine scratches on polished metals and detect voids in transparent substrates. The segment's scale anchors the surface vision and inspection equipment market and secures volume pricing on complementary optics and frame grabbers.
AI-enabled vision platforms, while a smaller base, are forecast to post a 9.08% CAGR to 2031. Embedding convolutional neural networks directly into smart cameras reduces latencies that previously mandated host-based inference. Cognex's April 2024 launch of an integrated 3D-with-AI device illustrates how suppliers now collapse multiple sub-systems into a single housing. This convergence is set to reshape the cost stack and expand addressable use cases across the surface vision and inspection equipment market.
2D vision keeps a 62.30% foothold thanks to barcode decoding, presence checks, and label verification that rarely require depth data. These legacy tasks continue to secure incremental refresh revenue as line speeds accelerate. At the same time, AI-enabled configurations are scaling quickly at an 8.55% CAGR, delivering robustness to variable lighting, shape deformation, and overlapping features that confound rule-based scripts. The surface vision and inspection equipment market size for AI-enabled systems is projected to reach USD 2.26 billion by 2031, supported by declining inference-engine costs.
3D imaging remains a niche for applications like gearbox housing measurement or aerospace fastener depth validation, but the blend of structured light and neural inference is starting to blur historical boundaries. Suppliers that merge 2D, 3D, and spectral content within unified software suites stand to capture cross-selling premiums in the surface vision and inspection equipment industry.
Complete Report Scope:
- By Component
- Camera
- Lighting Equipment
- Optics
- Frame Grabbers and Processors
- Software
- Other Components
- By System Type
- 2D Vision Systems
- 3D Vision Systems
- AI-enabled Vision Systems
- By Deployment Mode
- In-line / On-line Inspection
- Off-line Inspection
- Portable / Hand-held Systems
- By Application Industry
- Automotive
- Electrical and Electronics
- Semiconductor and PCB
- Medical and Pharmaceuticals
- Food and Beverage and Packaging
- Metals and Paper
- Postal and Logistics
- Other Industries
- By Geography
- North America
- United States
- Canada
- Mexico
- South America
- Brazil
- Argentina
- Rest of South America
- Europe
- United Kingdom
- Germany
- France
- Italy
- Spain
- Rest of Europe
- Asia Pacific
- China
- Japan
- India
- South Korea
- ASEAN
- Australia
- New Zealand
- Rest of Asia Pacific
- Middle East and Africa
- Middle East
- GCC
- Turkey
- Israel
- Rest of Middle East
- Africa
- South Africa
- Nigeria
- Egypt
- Rest of Africa
- Middle East
- North America
Geography Analysis
Asia Pacific captured 38.40% of global revenue in 2025, powered by large-scale electronics and auto supply chains in China, Japan, and South Korea. Chinese machine-vision vendors benefited from >=30% sales growth in 2024 as state policies reinforced "smart manufacturing" imperatives. South Korea's robot density of 1,012 units per 10,000 workers illustrates the region's appetite for automation hardware that embeds intelligent optics.
Europe and North America retain robust demand lines anchored in aerospace, semiconductor front-end, and regulated medical-device sectors that justify premium pricing. The surface vision and inspection equipment market size for North America is forecast to approach USD 1.92 billion by 2031 as electrification and printed-electronics projects proliferate. Manufacturers also value proximity to high-service vendors to navigate integration complexity.
South America is the fastest-growing territory with an 8.16% CAGR, underpinned by Brazil's modernization agenda and Argentina's push into automotive and agricultural-equipment exports. Battery and solar investments in Chile and Brazil offer fresh landing zones for vision suppliers. Although Middle East & Africa remains an emerging prospect, rising pharmaceutical production in Saudi Arabia and UAE is laying foundations for future uptake.
- Omron Corporation
- Cognex Corporation
- Keyence Corporation
- Isra Vision AG
- Teledyne DALSA
- Panasonic Corporation
- AMETEK Surface Vision
- Basler AG
- Stemmer Imaging AG
- Matrox Imaging Ltd.
- Edmund Optics Inc.
- Sick AG
- Sony Semiconductor Solutions
- Datalogic S.p.A.
- Shenzhen Sipotek Technology Co., Ltd.
- Daitron Inc.
- Opto Engineering Srl
- FlexFilm Ltd.
- Comvis AG
- Omnitron Sensors
Additional Benefits:
- The market estimate (ME) sheet in Excel format
- 3 months of analyst support
TABLE OF CONTENTS
1 INTRODUCTION
- 1.1 Study Assumptions and Market Definition
- 1.2 Scope of the Study
2 RESEARCH METHODOLOGY
3 EXECUTIVE SUMMARY
4 MARKET LANDSCAPE
- 4.1 Market Overview
- 4.2 Market Drivers
- 4.2.1 Increasing need for higher manufacturing throughput at lower cost
- 4.2.2 Rising demand for zero-defect quality in precision industries
- 4.2.3 Adoption of Industry 4.0 and smart-factory automation
- 4.2.4 Emergence of hyperspectral imaging for sub-surface defect detection
- 4.2.5 Pay-per-inspection service models lowering SME capex barriers
- 4.2.6 ESG-driven mandatory inspection in battery and solar lines to cut waste
- 4.3 Market Restraints
- 4.3.1 Scarcity of skilled vision engineers and integration complexity
- 4.3.2 High upfront cost of high-resolution 3D systems
- 4.3.3 Cyber-security risks in connected inspection networks
- 4.3.4 Rapid product-mix changes outpacing algorithm update cycles
- 4.4 Value / Supply-Chain Analysis
- 4.5 Regulatory Landscape
- 4.6 Technological Outlook
- 4.7 Porter's Five Forces
- 4.7.1 Threat of New Entrants
- 4.7.2 Bargaining Power of Buyers
- 4.7.3 Bargaining Power of Suppliers
- 4.7.4 Threat of Substitutes
- 4.7.5 Intensity of Competitive Rivalry
5 MARKET SIZE AND GROWTH FORECASTS (VALUE)
- 5.1 By Component
- 5.1.1 Camera
- 5.1.2 Lighting Equipment
- 5.1.3 Optics
- 5.1.4 Frame Grabbers and Processors
- 5.1.5 Software
- 5.1.6 Other Components
- 5.2 By System Type
- 5.2.1 2D Vision Systems
- 5.2.2 3D Vision Systems
- 5.2.3 AI-enabled Vision Systems
- 5.3 By Deployment Mode
- 5.3.1 In-line / On-line Inspection
- 5.3.2 Off-line Inspection
- 5.3.3 Portable / Hand-held Systems
- 5.4 By Application Industry
- 5.4.1 Automotive
- 5.4.2 Electrical and Electronics
- 5.4.3 Semiconductor and PCB
- 5.4.4 Medical and Pharmaceuticals
- 5.4.5 Food and Beverage and Packaging
- 5.4.6 Metals and Paper
- 5.4.7 Postal and Logistics
- 5.4.8 Other Industries
- 5.5 By Geography
- 5.5.1 North America
- 5.5.1.1 United States
- 5.5.1.2 Canada
- 5.5.1.3 Mexico
- 5.5.2 South America
- 5.5.2.1 Brazil
- 5.5.2.2 Argentina
- 5.5.2.3 Rest of South America
- 5.5.3 Europe
- 5.5.3.1 United Kingdom
- 5.5.3.2 Germany
- 5.5.3.3 France
- 5.5.3.4 Italy
- 5.5.3.5 Spain
- 5.5.3.6 Rest of Europe
- 5.5.4 Asia Pacific
- 5.5.4.1 China
- 5.5.4.2 Japan
- 5.5.4.3 India
- 5.5.4.4 South Korea
- 5.5.4.5 ASEAN
- 5.5.4.6 Australia
- 5.5.4.7 New Zealand
- 5.5.4.8 Rest of Asia Pacific
- 5.5.5 Middle East and Africa
- 5.5.5.1 Middle East
- 5.5.5.1.1 GCC
- 5.5.5.1.2 Turkey
- 5.5.5.1.3 Israel
- 5.5.5.1.4 Rest of Middle East
- 5.5.5.2 Africa
- 5.5.5.2.1 South Africa
- 5.5.5.2.2 Nigeria
- 5.5.5.2.3 Egypt
- 5.5.5.2.4 Rest of Africa
- 5.5.5.1 Middle East
- 5.5.1 North America
6 COMPETITIVE LANDSCAPE
- 6.1 Market Concentration
- 6.2 Strategic Moves
- 6.3 Market Share Analysis
- 6.4 Company Profiles {(includes Global level Overview, Market level overview, Core Segments, Financials as available, Strategic Information, Market Rank/Share for key companies, Products and Services, and Recent Developments)}
- 6.4.1 Omron Corporation
- 6.4.2 Cognex Corporation
- 6.4.3 Keyence Corporation
- 6.4.4 Isra Vision AG
- 6.4.5 Teledyne DALSA
- 6.4.6 Panasonic Corporation
- 6.4.7 AMETEK Surface Vision
- 6.4.8 Basler AG
- 6.4.9 Stemmer Imaging AG
- 6.4.10 Matrox Imaging Ltd.
- 6.4.11 Edmund Optics Inc.
- 6.4.12 Sick AG
- 6.4.13 Sony Semiconductor Solutions
- 6.4.14 Datalogic S.p.A.
- 6.4.15 Shenzhen Sipotek Technology Co., Ltd.
- 6.4.16 Daitron Inc.
- 6.4.17 Opto Engineering Srl
- 6.4.18 FlexFilm Ltd.
- 6.4.19 Comvis AG
- 6.4.20 Omnitron Sensors
7 MARKET OPPORTUNITIES AND FUTURE OUTLOOK
- 7.1 White-space and Unmet-Need Assessment


