|
시장보고서
상품코드
2123326
분석 기기 시장 : 점유율 분석, 업계 동향과 통계, 성장 예측(2026-2031년)Analytical Instrumentation - Market Share Analysis, Industry Trends & Statistics, Growth Forecasts (2026 - 2031) |
||||||
 Mordor Intelligence
Mordor Intelligence에 의하면, 분석 기기 시장 규모는 2026년에 590억 4,000만 달러에 이르고, 2031년까지 820억 8,000만 달러에 이를 것으로 예측되며, CAGR은 6.81%로 추이할 전망입니다.
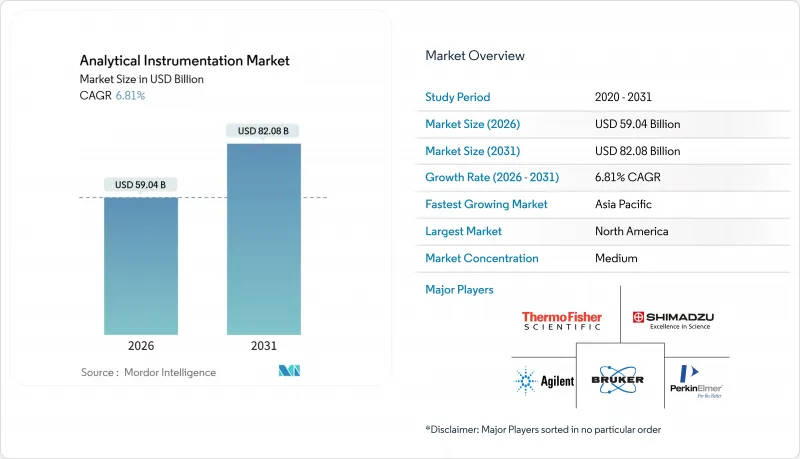
본 보고서는 제품 유형(분자 분광법, 원소 분광법 등), 최종 사용자 산업(식품 및 음료 검사 등), 기기 휴대성(휴대용·핸드헬드형 기기 등), 판매 채널(직접 판매, 유통업체 및 시스템 통합사업자, 전자상거래 마켓플레이스), 지역별로 분류되어 있습니다. 시장 전망은 금액(달러) 기준으로 제시되어 있습니다.
세계 분석 기기 시장 동향 및 인사이트
바이오의약품 품질 보증·품질 관리(QA/QC) 분야에서 하이페네이트 기술 채택 확대
현재, 단일클론 항체 및 항체-약물 복합체(ADC)는 신약 승인의 30% 이상을 차지하고 있으며, 그 구조의 복잡성으로 인해 액체 크로마토그래피·고분해능 질량 분석법이 전하 변이 및 당화 프로파일링에 있어 직교 표준으로 자리 잡고 있습니다. 2024년에 발간된 규제 지침에서는 바이오시밀러 신청 자료에 LC-MS를 이용한 펩타이드 매핑을 명시적으로 요구하고 있어, 5 ppm 미만의 정확도를 실현하는 Orbitrap 및 사중극자-비행시간형(TOF) 시스템에 대한 수요가 확고해지고 있습니다. 장비 공급업체들은 2025년에 두 자릿수의 판매량 증가를 보고하고 있으며, 분자 동등성을 입증하고자 하는 아시아의 바이오시밀러 개발 기업들 사이에서 도입이 가장 활발히 진행되고 있습니다. 각 연구소에서는 분석법 최적화를 자동화하는 AI 모듈 도입이 진행되고 있으며, 이를 통해 검증 주기가 단축되고 인적 오류 위험이 감소하고 있습니다. 이러한 추세는 고부가가치 하드웨어·소프트웨어 번들 및 소모품으로부터의 지속적인 수익을 뒷받침하고 있습니다.
PFAS 및 미세 플라스틱에 대한 전 세계적인 엄격한 규제가 초미량 분석을 촉진
미국은 2024년 주요 PFAS 종에 대해 4 ppt의 최대 오염 물질 농도(MCL)를 설정했는데, 이는 기존의 트리플 쿼드러폴 MS 플랫폼의 검출 한계를 훨씬 밑도는 수치입니다. 이에 따라 공공 기관 및 민간 검사 기관은 다원자 간섭을 억제하여 1 ppt 미만의 검출을 실현하는 충돌 반응 셀을 탑재한 ICP-MS/MS 및 Orbitrap 시스템으로 업그레이드했습니다. 유럽에서 심의 중인 미세 플라스틱 지침도 호재로 작용하고 있으며, 라만 미세 분광법이나 열분해-GC-MS를 통해 단일 입자의 고분자 식별이 가능해졌습니다. 각 기기 공급업체들은 2025년에 지자체 고객으로부터의 수주가 30% 이상 급증한 것을 기록하고 있으며, 이는 법규 준수가 설비 투자의 우선순위를 재편하고 있음을 보여줍니다.
신흥 시장에서 고분해능 MS의 높은 총 소유 비용
Orbitrap 및 Q-TOF 장치의 가격은 50만 달러에서 120만 달러이지만, 소모품 및 서비스 계약을 포함하면 5년간의 총 소유 비용은 200만 달러를 초과하는 경우가 많습니다. 남아시아 및 동남아시아의 많은 연구소에서는 지불 조건이 180일로 북미 구매자의 2배에 달하기 때문에 현금 흐름이 어려워져 장비 교체가 지연되고 있습니다. 그 결과, 소규모 시설에서는 재생된 트리플 쿼드러폴러형 장비를 선택하거나 초미량 분석을 외부에 위탁하는 경우가 많아, 수요가 세분화되고 교체 주기가 장기화되고 있습니다. 벤더 측은 하드웨어, 소프트웨어, 유지보수를 월정액 요금에 묶은 구독 모델로 대응하고 있지만, 다국적 기업 이외의 도입은 여전히 제한적입니다.
부문 분석
2025년, 질량 분석은 부문 매출의 29.33%를 차지하며 분석 기기 시장에서 가장 큰 점유율을 기록했습니다. 크로마토그래피 플랫폼이 2위를 차지했으며, 컬럼의 입자 크기가 2µm 미만으로 축소됨에 따라 초고속 액체 크로마토그래피(UHPLC)가 기세를 더하고 있습니다. 분자 및 원소 분광 분석 기기는 식품, 석유 화학, 반도체 워크플로우에서 여전히 필수적인 반면, 분석용 현미경 및 표면 분석 기기는 나노 소재 및 배터리 연구를 뒷받침하고 있습니다. 데이터 관리 소프트웨어 및 서비스는 연평균 성장률(CAGR) 8.46%로 가장 빠르게 성장하는 부문이며, 이는 데이터 수집, 규정 준수, AI 분석을 통합한 클라우드 LIMS 플랫폼으로의 실험실 전환을 반영합니다. 이러한 전환으로 인해 소프트웨어 구독은 더 광범위한 분석 기기 시장에서 정기적인 수익원으로서의 입지를 확고히 하고 있습니다.
컬럼, 이온 소스, 교정 표준 물질 등의 소모품은 안정적인 현금 흐름을 가져다주며, 공급업체의 로열티 프로그램의 기반이 되고 있습니다. 장비 제조업체들은 수익 인식을 원활하게 하는 예방 정비 계약과 결합된 다년 단위 소모품 플랜을 점점 더 적극적으로 제공합니다. 소프트웨어가 성장을 주도하는 가운데, 하드웨어 혁신은 현재 수리 시간을 단축하고 현장 업그레이드를 용이하게 하는 모듈식 아키텍처에 초점을 맞추었습니다. 이러한 기능은 가동률을 극대화하기 위해 가동 중지 시간을 최소화해야 하는 연구소의 요구와 부합합니다.
2025년에는 신약 스크리닝, 제제 개발 및 방출 시험에서 LC, MS, 용출 시험 플랫폼이 필수적이라는 점 때문에 의약품 및 바이오의약품 기업이 수요의 33.47%를 차지했습니다. 한편, 환경 검사 기관은 PFAS 및 미세 플라스틱에 관한 규제로 인해 고분해능 질량 분석법이나 라만 분광법을 이용한 초미량 검출이 의무화됨에 따라 연평균 성장률(CAGR) 8.93%로 가장 빠른 성장세를 보이고 있습니다. 그 결과, 유틸리티 및 위탁 환경 검사 기관을 대상으로 한 분석 기기 시장이 급속히 확대되고 있습니다. 임상, 식품, 화학, 반도체 각 부문에서는 각각의 규제 요건 및 처리 능력 요건에 부합하는 전문적인 구성을 추구하는 움직임이 이어지면서 지출의 다양화가 진행되고 있습니다.
배터리 및 재료과학 연구소에서는 양극상 안정성 연구를 위해 ICP-MS-MS 및 X선 회절 장치에 대한 새로운 투자가 이루어지고 있습니다. 한편, 반도체 팹에서는 3nm 이하의 수율을 확보하기 위해 SIMS 및 XPS 장치 구매를 강화하고 있습니다. 학술 기관 및 정부 기관에서는 하이엔드 현미경에 대한 수요가 지속되고 있지만, 예산이 정체되어 있어 발주 빈도는 다소 주춤한 상태입니다. 이러한 추세를 종합해 보면, 기존에는 제약 업계가 주도적이었던 상황에서 인접 분야로 수익원이 더욱 광범위하게 분산되는 방향으로의 전환이 나타나고 있습니다.
지역별 분석
2025년, 북미는 전 세계 매출의 39.82%를 차지했습니다. 이는 검증된 분석 기법을 의무화하는 미국의 엄격한 FDA, EPA 및 SEMI 기준에 힘입은 결과입니다. 그 뒤를 이어 유럽이 뒤를 이었으며, 독일, 영국, 프랑스는 크로마토그래피 및 분광법에 대한 투자를 뒷받침하는 견고한 제약·화학 생산 거점을 유지하고 있습니다. 유럽의 분석 기기 시장은 규제 조화의 혜택을 받아 대서양을 가로지르는 거점 간 플랫폼 표준화가 가능해졌습니다.
아시아태평양은 2031년까지 연평균 성장률(CAGR) 7.84%로 확대될 전망이며, 이미 가장 빠르게 성장하는 고객 부문을 보유하고 있습니다. 중국의 배터리 기가팩토리 총 생산 능력은 2025년에 50GWh를 넘어설 전망이며, 각 공장에서는 분말 및 슬러리의 품질을 보장하기 위해 입자 크기 분석기, ICP-MS 장비, X선 회절 분석기가 도입되고 있습니다. 인도의 의약품 수출액은 2025 회계연도에 279억 달러에 달할 것으로 예상되며, 이는 USP 규격을 준수하고 미국 FDA 검사를 통과하는 LC-MS 및 HPLC 플랫폼에 대한 수요를 끌어올리고 있습니다. 일본 및 한국의 반도체 제조 장비 공급업체들은 3nm 이하 제조를 지원하기 위해 SIMS 및 SEM의 생산 능력을 확대하고 있으며, 이를 통해 해당 지역의 지속적인 수요를 확보하고 있습니다.
중동 및 아프리카는 여전히 규모는 작지만 전략적으로 중요한 지역이며, 사우디아라비아와 아랍에미리트(UAE)의 석유화학 산업 확장이 가스 크로마토그래피 및 원소 분광 분석에 대한 투자를 견인하고 있습니다. 남미의 주요 시장인 브라질과 아르헨티나는 각각 식품 검사 및 광업에 중점을 두고 있으며, ICP-OES 및 UV-가시광 분광법에 크게 의존하고 있습니다. 호주에서는 1 ppt 미만의 PFAS 검출을 의무화하는 지하수 모니터링 프로그램에 자금이 투입되고 있으며, 이를 통해 장기적인 정화 프로젝트를 위한 고분해능 ICP-MS 장비에 대한 자금 지원이 이루어지고 있습니다.
기타 혜택:
- 엑셀 형식 시장 예측(ME) 시트
- 3개월간의 애널리스트 지원
자주 묻는 질문
목차
제1장 서론
제2장 조사 방법
제3장 주요 요약
제4장 시장 구도
제5장 시장 규모와 성장 예측
제6장 경쟁 구도
제7장 시장 기회와 향후 전망
JHS 26.09.09According to Mordor Intelligence, the analytical instrumentation market size reached USD 59.04 billion in 2026 and is projected to reach USD 82.08 billion by 2031, advancing at a 6.81% CAGR.
This report is Segmented by Product Type (Molecular Spectroscopy, Elemental Spectroscopy, and More), End-User Industry (Food and Beverage Testing, and More), Instrument Portability (Portable and Handheld Instruments, and More), Sales Channel (Direct Sales, Distributors and System Integrators, Ecommerce Marketplaces), and Geography. The Market Forecasts are Provided in Terms of Value (USD).
Global Analytical Instrumentation Market Trends and Insights
Rising Adoption of Hyphenated Techniques for Biologics QA/QC
Monoclonal antibodies and antibody-drug conjugates now represent more than 30% of new drug approvals, and their structural complexity has normalized liquid chromatography high-resolution mass spectrometry as the orthogonal standard for charge-variant and glycosylation profiling. Regulatory guidance issued in 2024 explicitly calls for peptide mapping via LC-MS in biosimilar dossiers, anchoring demand for Orbitrap and quadrupole-time-of-flight systems that deliver sub-5 ppm accuracy. Instrument suppliers reported double-digit unit growth in 2025, with uptake highest among Asian biosimilar developers aiming to prove molecular equivalence. Laboratories increasingly integrate AI modules that automate method optimization, shortening validation cycles and reducing human error risk. This dynamic supports premium hardware-software bundles and recurring revenue from consumables.
Stringent Global Limits on PFAS and Microplastics Boosting Ultra-Trace Spectrometry
The United States set a maximum contaminant level of 4 ppt for key PFAS species in 2024, far below the detection limits of legacy triple-quadrupole MS platforms. Utilities and commercial laboratories, therefore, upgraded to ICP-MS/MS and Orbitrap systems equipped with collision-reaction cells that suppress polyatomic interferences to achieve sub-1 ppt detection. Europe's pending microplastics directive adds momentum, as Raman microspectroscopy and pyrolysis-GC-MS enable single-particle polymer identification. Instrument vendors recorded order spikes of 30% or more from municipal customers in 2025, indicating that mandated compliance is reshaping capital-spending priorities.
High Total Cost of Ownership of High-Resolution MS in Emerging Markets
Orbitrap and Q-TOF instruments range from USD 500,000 to USD 1.2 million, but five-year ownership often exceeds USD 2 million when consumables and service contracts are included. Many laboratories in South and Southeast Asia face 180-day payment terms, double that of North American buyers, tightening cash flow and delaying replacements. Consequently, smaller facilities opt for refurbished triple-quadrupole units or outsource ultra-trace analyses, fragmenting demand and lengthening refresh cycles. Vendors respond with subscription models that bundle hardware, software, and maintenance into monthly fees, yet adoption remains modest outside multinational corporations.
Other drivers and restraints analyzed in the detailed report include:
- Shift Toward Real-Time Release Testing in Pharma Production
- Semiconductor Node Shrinkage Below 3 nm Requiring Ultra-Sensitive Surface Analysis
- Shortage of Skilled Analytical Chemists Elevating Outsourcing Costs
For complete list of drivers and restraints, kindly check the Table Of Contents.
Segment Analysis
Mass spectrometry accounted for 29.33% of segment revenue in 2025, the largest share of the analytical instrumentation market. Chromatography platforms ranked second, with ultra-high-performance liquid chromatography gaining momentum as column particle sizes shrink to sub-2 µm. Molecular and elemental spectroscopy instruments remain essential to food, petrochemical, and semiconductor workflows, while analytical microscopes and surface analysis tools support nanomaterials and battery research. Data-management software and services represent the fastest-growing category at an 8.46% CAGR, mirroring laboratory migration to cloud LIMS platforms that merge acquisition, compliance, and AI analytics. This transition positions software subscriptions as an annuity layer within the wider analytical instrumentation market.
Consumables such as columns, ion sources, and calibration standards deliver stable cash flow and underpin vendor loyalty programs. Instrument makers increasingly package multiyear consumable plans with preventive-maintenance agreements that smooth revenue recognition. With software leading growth, hardware innovation now centers on modular architectures that shorten repair times and facilitate field upgrades. These features resonate with laboratories that must minimize downtime to maximize utilization.
Pharmaceutical and biopharmaceutical companies accounted for 33.47% of demand in 2025, owing to discovery screening, formulation, and release testing that rely on LC, MS, and dissolution platforms. Environmental laboratories, however, are advancing the fastest, with an 8.93% CAGR, because PFAS and microplastics regulations mandate ultra-trace detection via high-resolution mass spectrometry and Raman spectroscopy. The analytical instrumentation market for utilities and contract environmental labs is therefore expanding rapidly. Clinical, food, chemical, and semiconductor segments continue to diversify spending, each seeking specialized configurations that match their respective regulatory and throughput requirements.
Battery and materials-science laboratories are directing fresh investment toward ICP-MS-MS and X-ray diffraction systems for cathode-phase stability studies. Semiconductor fabs, meanwhile, intensify purchases of SIMS and XPS equipment to safeguard yields below 3 nm. Academic and government institutes sustain demand for high-end microscopes, though flat budgets temper the frequency of orders. Collectively, these patterns illustrate a shift from traditional pharma dominance toward a broader distribution of revenue streams across adjacent sectors.
Complete Report Scope:
- By Product Type
- Chromatography Instruments
- Gas Chromatography (GC) Systems
- High-Performance and Ultra-High-Performance Liquid Chromatography (HPLC, UHPLC)
- Ion Chromatography (IC) Systems
- Supercritical Fluid Chromatography (SFC) Systems
- Molecular Spectroscopy
- UV-Visible Spectrometers
- Fourier Transform Infrared (FT-IR) Spectrometers
- Near-Infrared (NIR) Spectrometers
- Raman Spectrometers
- Fluorescence Spectrometers
- Elemental Spectroscopy
- Atomic Absorption Spectrometers (AAS)
- ICP-Optical Emission Spectrometers (ICP-OES)
- ICP-Mass Spectrometers (ICP-MS)
- X-Ray Fluorescence (XRF) Spectrometers
- Mass Spectrometry
- Single Quadrupole MS Systems
- Triple Quadrupole MS Systems
- Quadrupole-Time-of-Flight (Q-TOF) MS Systems
- Orbitrap and FT-MS Systems
- MALDI-TOF MS Systems
- Analytical Microscopes and Imaging
- Scanning Electron Microscopes (SEM)
- Transmission Electron Microscopes (TEM)
- Atomic Force Microscopes (AFM)
- Confocal and Optical Microscopes
- Surface, Thermal and Particle Characterisation
- X-Ray Diffraction (XRD) Systems
- Thermal Analysis Instruments (DSC, TGA, etc.)
- Particle Size and Zeta Potential Analysers
- Consumables and Accessories
- Data Management Software and Services
- Chromatography Instruments
- By End-User Industry
- Pharmaceuticals and Biopharmaceuticals
- Drug Discovery and Development
- Manufacturing QA/QC
- Clinical and Diagnostics Laboratories
- Environmental Testing Laboratories
- Food and Beverage Testing
- Chemical and Petrochemical
- Oil and Gas (Upstream, Midstream, Downstream)
- Materials Science and Metallurgy
- Semiconductor and Electronics
- Academic and Government Research Institutes
- Forensic and Security
- Water and Wastewater Utilities
- Pharmaceuticals and Biopharmaceuticals
- By Instrument Portability
- Benchtop and Floor-Standing Instruments
- Portable and Handheld Instruments
- In-Line and On-Line Process Analysers
- By Sales Channel
- Direct Sales
- Distributors and System Integrators
- eCommerce Marketplaces
- By Geography
- North America
- United States
- Canada
- Mexico
- Europe
- Germany
- United Kingdom
- France
- Russia
- Rest of Europe
- Asia-Pacific
- China
- Japan
- India
- South Korea
- Australia
- Rest of Asia-Pacific
- Middle East and Africa
- Middle East
- Saudi Arabia
- United Arab Emirates
- Rest of Middle East
- Africa
- South Africa
- Egypt
- Rest of Africa
- Middle East
- South America
- Brazil
- Argentina
- Rest of South America
- North America
Geography Analysis
North America accounted for 39.82% of global revenue in 2025, underpinned by the United States' stringent FDA, EPA, and SEMI standards that require validated analytical methods. Europe followed, with Germany, the United Kingdom, and France maintaining robust pharmaceutical and chemical production bases that favor spending on chromatography and spectroscopy. The analytical instrumentation market in Europe benefited from regulatory harmonization, which enabled platform standardization across transatlantic sites.
Asia-Pacific is set to expand at a 7.84% CAGR through 2031 and already houses the fastest-growing customer segments. China's battery gigafactory footprint exceeded 50 GWh in 2025, and each plant integrates particle-size analyzers, ICP-MS units, and X-ray diffraction systems to certify the quality of powders and slurries. India's pharmaceutical exports climbed to USD 27.9 billion in fiscal 2025, boosting demand for LC-MS and HPLC platforms that meet USP monographs and pass U.S. FDA inspections. Japanese and South Korean chip-equipment suppliers are scaling SIMS and SEM capacity to support sub-3 nm fabrication, ensuring sustained regional demand.
The Middle East and Africa remain smaller but strategic, with petrochemical expansions in Saudi Arabia and the United Arab Emirates driving investments in gas chromatography and elemental spectroscopy. South America's key markets, Brazil and Argentina, focus on food testing and mining, respectively, depending heavily on ICP-OES and UV-visible spectroscopy. Australia funds groundwater-monitoring programs that mandate PFAS detection at levels below 1 ppt, thereby funding high-resolution ICP-MS instruments for long-term remediation projects.
- Agilent Technologies Inc.
- Thermo Fisher Scientific Inc.
- Shimadzu Corporation
- Danaher Corporation
- Bruker Corporation
- Waters Corporation
- PerkinElmer Inc.
- Metrohm AG
- Mettler Toledo International Inc.
- Malvern Panalytical Ltd.
- Hitachi High-Tech Corporation
- HORIBA Ltd.
- JEOL Ltd.
- Anton Paar GmbH
- Bio-Rad Laboratories Inc.
- ZEISS Group
- Oxford Instruments plc
- Nikon Instruments Inc.
- Rigaku Corporation
- LECO Corporation
- Sartorius AG
- Merck KGaA
Additional Benefits:
- The market estimate (ME) sheet in Excel format
- 3 months of analyst support
TABLE OF CONTENTS
1 INTRODUCTION
- 1.1 Study Assumptions and Market Definition
- 1.2 Scope of the Study
2 RESEARCH METHODOLOGY
3 EXECUTIVE SUMMARY
4 MARKET LANDSCAPE
- 4.1 Market Overview
- 4.2 Market Drivers
- 4.2.1 Rising Adoption of Hyphenated Techniques for Biologics QA/QC
- 4.2.2 Stringent Global Limits on PFAS and Micro-plastics Boosting Ultra-Trace Spectrometry
- 4.2.3 Shift Toward Real-Time Release Testing (RTRT) in Pharma Production
- 4.2.4 Semiconductor Node Shrinkage below 3 nm Requiring Ultra-Sensitive Surface Analysis
- 4.2.5 Expansion of Renewable Aviation Fuel Programs Driving Feedstock Certification
- 4.2.6 In-Lab Analytics Surge for Battery Gigafactory Quality Assurance
- 4.3 Market Restraints
- 4.3.1 High Total Cost of Ownership of High-Resolution MS in Emerging Markets
- 4.3.2 Shortage of Skilled Analytical Chemists Elevating Outsourcing Costs
- 4.3.3 Helium Supply-Chain Volatility Impacting GC Operations
- 4.3.4 Lengthy Validation Cycles for Novel Analytical Methods in Regulated Sectors
- 4.4 Industry Value Chain Analysis
- 4.5 Impact of Macroeconomic Factors on the Market
- 4.6 Regulatory Outlook
- 4.7 Technological Outlook
- 4.8 Porter's Five Forces Analysis
- 4.8.1 Bargaining Power of Suppliers
- 4.8.2 Bargaining Power of Buyers
- 4.8.3 Threat of New Entrants
- 4.8.4 Threat of Substitutes
- 4.8.5 Degree of Competition
5 MARKET SIZE AND GROWTH FORECASTS (VALUE)
- 5.1 By Product Type
- 5.1.1 Chromatography Instruments
- 5.1.1.1 Gas Chromatography (GC) Systems
- 5.1.1.2 High-Performance and Ultra-High-Performance Liquid Chromatography (HPLC, UHPLC)
- 5.1.1.3 Ion Chromatography (IC) Systems
- 5.1.1.4 Supercritical Fluid Chromatography (SFC) Systems
- 5.1.2 Molecular Spectroscopy
- 5.1.2.1 UV-Visible Spectrometers
- 5.1.2.2 Fourier Transform Infrared (FT-IR) Spectrometers
- 5.1.2.3 Near-Infrared (NIR) Spectrometers
- 5.1.2.4 Raman Spectrometers
- 5.1.2.5 Fluorescence Spectrometers
- 5.1.3 Elemental Spectroscopy
- 5.1.3.1 Atomic Absorption Spectrometers (AAS)
- 5.1.3.2 ICP-Optical Emission Spectrometers (ICP-OES)
- 5.1.3.3 ICP-Mass Spectrometers (ICP-MS)
- 5.1.3.4 X-Ray Fluorescence (XRF) Spectrometers
- 5.1.4 Mass Spectrometry
- 5.1.4.1 Single Quadrupole MS Systems
- 5.1.4.2 Triple Quadrupole MS Systems
- 5.1.4.3 Quadrupole-Time-of-Flight (Q-TOF) MS Systems
- 5.1.4.4 Orbitrap and FT-MS Systems
- 5.1.4.5 MALDI-TOF MS Systems
- 5.1.5 Analytical Microscopes and Imaging
- 5.1.5.1 Scanning Electron Microscopes (SEM)
- 5.1.5.2 Transmission Electron Microscopes (TEM)
- 5.1.5.3 Atomic Force Microscopes (AFM)
- 5.1.5.4 Confocal and Optical Microscopes
- 5.1.6 Surface, Thermal and Particle Characterisation
- 5.1.6.1 X-Ray Diffraction (XRD) Systems
- 5.1.6.2 Thermal Analysis Instruments (DSC, TGA, etc.)
- 5.1.6.3 Particle Size and Zeta Potential Analysers
- 5.1.7 Consumables and Accessories
- 5.1.8 Data Management Software and Services
- 5.1.1 Chromatography Instruments
- 5.2 By End-User Industry
- 5.2.1 Pharmaceuticals and Biopharmaceuticals
- 5.2.1.1 Drug Discovery and Development
- 5.2.1.2 Manufacturing QA/QC
- 5.2.2 Clinical and Diagnostics Laboratories
- 5.2.3 Environmental Testing Laboratories
- 5.2.4 Food and Beverage Testing
- 5.2.5 Chemical and Petrochemical
- 5.2.6 Oil and Gas (Upstream, Midstream, Downstream)
- 5.2.7 Materials Science and Metallurgy
- 5.2.8 Semiconductor and Electronics
- 5.2.9 Academic and Government Research Institutes
- 5.2.10 Forensic and Security
- 5.2.11 Water and Wastewater Utilities
- 5.2.1 Pharmaceuticals and Biopharmaceuticals
- 5.3 By Instrument Portability
- 5.3.1 Benchtop and Floor-Standing Instruments
- 5.3.2 Portable and Handheld Instruments
- 5.3.3 In-Line and On-Line Process Analysers
- 5.4 By Sales Channel
- 5.4.1 Direct Sales
- 5.4.2 Distributors and System Integrators
- 5.4.3 eCommerce Marketplaces
- 5.5 By Geography
- 5.5.1 North America
- 5.5.1.1 United States
- 5.5.1.2 Canada
- 5.5.1.3 Mexico
- 5.5.2 Europe
- 5.5.2.1 Germany
- 5.5.2.2 United Kingdom
- 5.5.2.3 France
- 5.5.2.4 Russia
- 5.5.2.5 Rest of Europe
- 5.5.3 Asia-Pacific
- 5.5.3.1 China
- 5.5.3.2 Japan
- 5.5.3.3 India
- 5.5.3.4 South Korea
- 5.5.3.5 Australia
- 5.5.3.6 Rest of Asia-Pacific
- 5.5.4 Middle East and Africa
- 5.5.4.1 Middle East
- 5.5.4.1.1 Saudi Arabia
- 5.5.4.1.2 United Arab Emirates
- 5.5.4.1.3 Rest of Middle East
- 5.5.4.2 Africa
- 5.5.4.2.1 South Africa
- 5.5.4.2.2 Egypt
- 5.5.4.2.3 Rest of Africa
- 5.5.4.1 Middle East
- 5.5.5 South America
- 5.5.5.1 Brazil
- 5.5.5.2 Argentina
- 5.5.5.3 Rest of South America
- 5.5.1 North America
6 COMPETITIVE LANDSCAPE
- 6.1 Market Concentration
- 6.2 Strategic Moves
- 6.3 Market Share Analysis
- 6.4 Company Profiles (includes Global Level Overview, Market Level Overview, Core Segments, Financials as Available, Strategic Information, Market Rank/Share for Key Companies, Products and Services, and Recent Developments)
- 6.4.1 Agilent Technologies Inc.
- 6.4.2 Thermo Fisher Scientific Inc.
- 6.4.3 Shimadzu Corporation
- 6.4.4 Danaher Corporation
- 6.4.5 Bruker Corporation
- 6.4.6 Waters Corporation
- 6.4.7 PerkinElmer Inc.
- 6.4.8 Metrohm AG
- 6.4.9 Mettler Toledo International Inc.
- 6.4.10 Malvern Panalytical Ltd.
- 6.4.11 Hitachi High-Tech Corporation
- 6.4.12 HORIBA Ltd.
- 6.4.13 JEOL Ltd.
- 6.4.14 Anton Paar GmbH
- 6.4.15 Bio-Rad Laboratories Inc.
- 6.4.16 ZEISS Group
- 6.4.17 Oxford Instruments plc
- 6.4.18 Nikon Instruments Inc.
- 6.4.19 Rigaku Corporation
- 6.4.20 LECO Corporation
- 6.4.21 Sartorius AG
- 6.4.22 Merck KGaA
7 MARKET OPPORTUNITIES AND FUTURE OUTLOOK
- 7.1 White-Space and Unmet-Need Assessment