|
시장보고서
상품코드
2124673
프로세스 분석 기기 시장 : 시장 점유율 분석, 업계 동향 및 통계, 성장 예측(2026-2031년)Process Analytical Instrumentation - Market Share Analysis, Industry Trends & Statistics, Growth Forecasts (2026 - 2031) |
||||||
 Mordor Intelligence
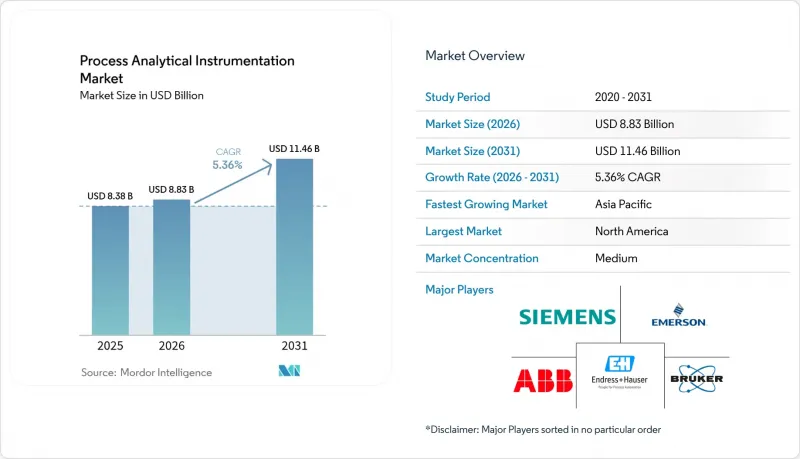
Mordor Intelligence에 의하면, 프로세스 분석 기기 시장 규모는 2025년 83억 8,000만 달러로 평가되었고, 2026년에는 88억 3,000만 달러로 추정되고, 2026-2031년 CAGR 5.36%로 성장을 지속할 전망이며, 2031년에는 114억 6,000만 달러에 이를 것으로 예측됩니다.
본 보고서는 장비 유형별(가스 크로마토그래프, 가스 분석기, 액체 분석기, 분광기), 구성 요소별(하드웨어, 소프트웨어, 서비스), 최종 사용자 산업별(석유 및 가스, 화학제품 및 석유화학제품, 기타), 설치 형태별(인라인/온라인, 앳라인, 실험실) 및 지역별로 분류되어 있습니다. 시장 전망은 금액(달러) 기준으로 제시되어 있습니다.
세계의 프로세스 분석 기기 시장 동향 및 인사이트
공정 내 품질 및 배출 규제에 대한 준수를 요구하는 규제 추진
새로운 환경 규제의 물결로 인해 굴뚝, 플레어, 바이오리액터에 대한 연속 모니터링이 의무화되면서 프로세스 분석 기기 시장의 잠재 고객 기반이 즉시 확대되고 있습니다. EU의 2024년 대기질 지침에서는 초미세 입자 계수가 의무화되어 있으며, 캐나다의 CEMS(연속 배출 가스 모니터링 시스템) 규격에서는 SO2, NOx, CO 프로브의 교정 주기가 엄격해지고 있습니다. 아시아에서도 유사한 규제 체계가 마련됨에 따라 기존에 존재하던 법 집행상의 공백이 해소되고 있으며, 수천 개의 플랜트가 배출량의 지속적인 모니터링 의무화를 향해 나아가고 있습니다. ISO 17025 및 EN 15267 규격의 사전 인증을 받은 분석 장비를 공급할 수 있는 공급업체는 고객이 규정 준수를 달성하기까지의 과정을 단축해 줍니다. 환경 관련 배출원에 그치지 않고, 이와 유사한 규제의 취지는 제약 업계의 GMP 및 식품 안전 기준에도 스며들어 있으며, 그곳에서 인라인 분석은 로트 폐기 비용을 경감시키고 있습니다.
전체 공정 산업에서의 디지털화 및 인더스트리 4.0 도입
클라우드 네이티브 SCADA 플랫폼과 산업용 IoT 게이트웨이가 보급됨에 따라 프로세스 분석 기기 시장에는 새로운 연결 요구 사항이 부과되고 있으며, 기기 제조업체는 OPC UA, MQTT 및 보안 IP 스택을 통합해야 합니다. 분석기를 디지털 트윈과 결합한 플랜트에서는 제품 품질이 저하되기 훨씬 전에 원료 품질의 변동이나 촉매의 열화와 같은 다변량적 인사이트를 얻을 수 있습니다. 소프트웨어 벤더가 제공하는 AI 강화형 케모메트릭스 엔진을 통해 스펙트럼 해석이 자동화되어, 박사 학위 수준의 전문가가 아니더라도 고도의 분석을 활용할 수 있게 되었습니다. 그러나 네트워크에 노출되면 사이버 위험이 높아지기 때문에 IEC 62443 인증을 획득한 장비를 도입하는 기업은 경쟁적 신뢰성을 높이고 있습니다. 이러한 ‘연결성과 보안’이라는 이중 요건이 소프트웨어 및 서비스의 지속적인 수익 창출을 촉진하고 있으며, 가치 창출의 중심은 하드웨어에서 디지털 서비스로 이동하고 있습니다.
고급 분석 장비의 높은 초기 투자 비용 및 수명 주기 비용
완벽한 CEMS 플랫폼이나 트리플 쿼드러폴 질량 분석기에는 50만 달러 이상의 투자가 필요하며, 연간 서비스 비용은 구매 가격의 20%에 달할 전망입니다. 신흥국에서는 환율 변동과 수입 관세에 더해 현지 서비스 거점이 부족하기 때문에 납품 가격이 상승하고 있습니다. 가동 중단으로 인한 손실이 막대한 연속 공정 플랜트에서는 이중화가 필수적이며, 그 결과 자본 요건이 두 배로 늘어납니다. 이러한 경제적 요인으로 인해 소규모 화학, 식품, 특수 소재 제조업체의 분석 장비 도입이 지연되고 있습니다.
부문 분석
2025년, 가스 분석 장비는 프로세스 분석 기기 시장에서 34.25%의 점유율을 차지했습니다. 이는 정유시설, 화학 크래커, 발전용 보일러에서 배출 모니터링 의무화가 보편화되고 있으며, 공정 최적화 노력이 널리 확산되고 있는 데 기인합니다. 이러한 시장 점유율 우위는 환경 허가 및 탄소 가격 제도를 준수하기 위해 SO2, NOx, CO, CO2의 연속 측정이 필수적이라는 점에 기인합니다. 분광계 수요는 규모는 작지만, 2031년까지 연평균 성장률(CAGR) 6.38%로 증가하고 있습니다. 이는 휴대용 XRF 및 핸드헬드 라만 장치의 보급으로 인해 하역장 및 유틸리티 스키드에서 원소 및 분자의 식별이 진행되고 있기 때문입니다.
이 10년의 후반에는 수소 혼소 라인을 개조하는 전력 회사나 전해조 OEM 제조업체에 의해 가스 분석 장비의 설치 대수가 확대될 전망이지만, 실시간 불순물 추적이 필수적인 생명공학 및 배터리 재료 제조 라인에서는 분광계가 시장 점유율을 빼앗을 가능성이 있습니다. 마이크로 GC 아키텍처, 수소 운반 가스, 스마트 밸브 오븐은 분리 성능을 유지하면서 헬륨 부족 문제에 대처합니다. 이러한 복합적인 진화로 인해 하드웨어 판매는 유지되는 한편, 가치는 용도 특화형 케모메트릭스로 이동하고 있으며, 이는 프로세스 분석 기기 시장에서 소프트웨어의 전략적 중요성을 더욱 높이고 있습니다.
하드웨어는 2025년 매출의 51.35%를 차지했으며, 이는 각 분석 장치 스키드를 구성하는 센서의 수와 시료 전처리 시스템의 기계적 복잡성을 반영합니다. 첨단 광학 시스템, 견고한 가스 셀, 방폭 인클로저 덕분에 평균 판매 가격은 높은 수준을 유지하고 있습니다. 한편, 프로세스 분석 기기 시장의 소프트웨어 시장 규모는 내장형 AI 엔진이 원시 스펙트럼을 실용적인 설정값 변경으로 변환함에 따라 연평균 성장률(CAGR) 6.55%로 성장을 지속하고, 있습니다. 브루커(Bruker)와 같은 공급업체는 자사 포트폴리오 전체에 SciY 데이터 플랫폼을 통합하여 매출 총이익률을 높이고, 지속적인 수익을 창출하는 구독형 케모메트릭스 패키지를 제공합니다.
서비스 계약에는 교정, 검증, 사이버 패치 적용이 다년 계약에 포함되어 있습니다. 에머슨(Emerson) 한 회사만 해도 2024년에 계측 및 분석 서비스 부문에서 40억 6,000만 달러의 매출을 기록했습니다. 업계 내 기술 격차로 인해 서비스 수요가 증가하고 있으며, 전 세계 현장 네트워크를 유지하는 벤더에게는 구조적인 우위가 형성되고 있습니다. 예측 유지보수 알고리즘이 성숙해짐에 따라, 2030년 이후에는 SaaS(Software-as-a-Service)형 서비스가 하드웨어 자본 판매를 능가하는 성장을 보일 것으로 전망됩니다.
지역별 분석
2025년, 북미는 41.05%의 점유율을 차지했습니다. 이는 미국 환경보호청(EPA)의 40 CFR Part 60/75 규정 및 직업안전보건청(OSHA)의 노출 한계치에 따라 정유시설, 화학 산업 단지, 발전소 전체에 연속 분석 장치의 도입이 의무화되었기 때문입니다. 넉넉한 설비 투자 예산, 확립된 서비스 인프라, 그리고 경험이 풍부한 인력을 통해 AI를 활용한 케모메트릭스의 신속한 도입이 가능해졌습니다. 헬륨 공급 부족과 인력 부족이 지속되고 있는 것은 장비 교체 주기를 늦추는 요인이 되고 있지만, 벤더 관리형 서비스 계약을 통해 가동 중단 위험을 완화할 수 있습니다.
아시아태평양은 연평균 8.21%의 성장률을 보이며, 프로세스 분석 기기 시장에서 가장 빠르게 확대되고 있는 지역입니다. 중국의 오염 방지 규정 강화, 인도의 가동 허가 요건, 그리고 일본의 JAIMA 주도의 표준화 이니셔티브가 맞물려 대규모 수주 잔고를 창출하고 있습니다. 연속 분석 장치는 거대 정유시설나 제철소뿐만 아니라, 수출 시장의 품질 관리(QC) 요건을 충족하려는 소규모 특수 화학 산업 단지에도 도입이 확대되고 있습니다. 지역 공급업체들은 전 세계 OEM 제조업체와 제휴하여 서비스를 현지화하고 있으며, 이를 통해 수입 관세 부담과 언어 장벽이 완화되고 있습니다.
유럽에서는 2024년 10월의 ‘대기질 지침’을 기반으로 꾸준한 확대가 이어지고 있습니다. 이 지침에 따라 27개 회원국 전역에서 초미세입자 측정이 의무화되었습니다. 라인강 유역과 이베리아 반도에 위치한 석유화학 클러스터에서는 CO₂ 과세 보고 요건을 충족하기 위해 기존의 탁도계를 최신 FTIR 셀로 교체하고 있습니다. 동시에, 독일과 스페인의 그린 수소용 전해조 프로젝트에서는 고순도 산소 및 수소의 검증이 요구되고 있으며, 이것이 분석 장비 도입을 촉진하고 있습니다. REPowerEU 자금 조달을 확보하기 위해 열심인 동유럽의 가공 업체들은 서유럽의 배출 기준을 채택하고 있어, 이를 통해 공급업체에게는 추가적인 수요 증가가 예상됩니다.
기타 혜택 :
- 엑셀 형식 시장 예측(ME) 시트
- 3개월간의 애널리스트 지원
자주 묻는 질문
목차
제1장 서론
제2장 조사 방법
제3장 주요 요약
제4장 시장 구도
제5장 시장 규모 및 성장 예측
제6장 경쟁 구도
제7장 시장 기회 및 향후 전망
AJY 26.09.15According to Mordor Intelligence, the process analytical instrumentation market size is expected to grow from USD 8.38 billion in 2025 to USD 8.83 billion in 2026 and is forecast to reach USD 11.46 billion by 2031 at 5.36% CAGR over 2026-2031.
This report is Segmented by Instrument Type (Gas Chromatographs, Gas Analyzers, Liquid Analyzers, Spectrometers), Component (Hardware, Software, and Services), End-User Industry (Oil and Gas, Chemicals and Petrochemicals, and More), Installation Type (In-line/On-line, At-Line, and Laboratory), and Geography. The Market Forecasts are Provided in Terms of Value (USD).
Global Process Analytical Instrumentation Market Trends and Insights
Regulatory push for in-process quality and emission compliance
A wave of fresh environmental statutes is forcing continuous monitoring across smokestacks, flares, and bioreactors, immediately enlarging the addressable base of the process analytical instrumentation market. The EU's Ambient Air Quality Directive of 2024 compels ultrafine-particle counting, while Canada's CEMS code tightens calibration cycles for SO2, NOx, and CO probes. Similar rulemaking in Asia is closing historical enforcement gaps, moving thousands of plants toward mandatory continuous emission monitoring. Vendors able to supply analyzers pre-certified to ISO 17025 and EN 15267 standards shorten customers' route to compliance. Beyond environmental stacks, the same regulatory intent is seeping into pharmaceutical GMP and food safety standards, where inline analytics mitigate batch rejection costs.
Digitalization and Industry 4.0 adoption across process industries
As cloud-native SCADA platforms and industrial IoT gateways proliferate, the process analytical instrumentation market gains new connectivity mandates, compelling instrument makers to embed OPC UA, MQTT, and secure IP stacks. Plants pairing analyzers with digital twins derive multivariate insights, such as feed-quality drift or catalyst aging, well before the product degrades. Software vendors' AI-enhanced chemometric engines now automate spectrum interpretation, expanding advanced analysis beyond PhD-level specialists. However, network exposure heightens cyber-risk, so firms promoting IEC 62443-certified appliances gain competitive credibility. This dual connectivity-and-security requirement propels recurring software and service revenues, tilting value creation from hardware toward digital offerings.
High capital and lifecycle costs of sophisticated analyzers
Complete CEMS platforms or triple-quadrupole mass spectrometers require outlays that exceed USD 500,000, with annual service costs reaching 20% of the purchase price. Emerging economies face currency volatility, import duties, and a dearth of local service hubs that inflate delivered pricing. In continuous-process plants where downtime penalties are brutal, redundancy becomes mandatory, doubling capital requirements. These economics delays analyzer adoption among small-scale chemical, food, and specialty-materials producers.
Other drivers and restraints analyzed in the detailed report include:
- Rising demand for real-time analytics in oil, gas and petrochemicals
- Rapid expansion of biopharma continuous manufacturing lines
- Shortage of skilled calibration and maintenance personnel
For complete list of drivers and restraints, kindly check the Table Of Contents.
Segment Analysis
Gas analyzers held a 34.25% process analytical instrumentation market share in 2025, underpinned by universal emission-monitor mandates and pervasive process-optimization routines across refineries, chemical crackers, and power boilers. Their share advantage stems from the necessity of continuous SO2, NOx, CO, and CO2 readouts to comply with environmental permits and carbon-pricing schemes. Spectrometer demand, while smaller, is climbing at a 6.38% CAGR to 2031 as portable XRF and handheld Raman devices push elemental and molecular identification to loading docks and utility skids.
In the second half of the decade, utilities retrofitting hydrogen co-firing lines and electrolyzer OEMs will widen the gas-analyzer installed base, yet spectrometers may erode share in biotech and battery-materials lines where real-time impurity tracking becomes critical. Micro-GC architectures, hydrogen carrier gases, and smart valve ovens counter helium shortages while preserving separation performance. The combined evolution sustains hardware sales yet shifts value toward application-specific chemometrics, reinforcing the strategic importance of software inside the process analytical instrumentation market.
Hardware contributed 51.35% to 2025 revenue, mirroring large sensor counts and the mechanical complexity of sample-conditioning systems that make up each analyzer skid. Sophisticated optics, ruggedized gas-cells, and explosion-proof enclosures keep average selling prices high. The process analytical instrumentation market size for software, however, is posting a 6.55% CAGR because embedded AI engines translate raw spectra into actionable set-point changes. Suppliers such as Bruker, integrating the SciY data platform across its portfolio, are packaging subscription-based chemometrics that boost gross margin and create annuity revenue.
Service contracts wrap calibration, validation, and cyber-patching into multi-year agreements; Emerson alone booked USD 4.06 billion from measurement & analytical services in 2024. The industry's skills gap elevates service intensity, giving vendors that maintain global field networks a structural advantage. As predictive-maintenance algorithms mature, software-as-a-service offerings will likely outgrow hardware capital sales beyond 2030.
Complete Report Scope:
- By Instrument Type
- Gas Chromatographs
- Gas Analyzers
- Liquid Analyzers
- Spectrometers
- By Component
- Hardware
- Software
- Services
- By End-user Industry
- Oil and Gas
- Chemicals and Petrochemicals
- Pharmaceutical and Biotechnology
- Metals and Mining
- Water and Wastewater
- Food and Beverage
- Power Generation
- By Installation Type
- In-line/On-line
- At-line
- Laboratory
- By Geography
- North America
- United States
- Canada
- Mexico
- South America
- Brazil
- Argentina
- Rest of South America
- Europe
- Germany
- United Kingdom
- France
- Italy
- Spain
- Russia
- Rest of Europe
- Asia-Pacific
- China
- Japan
- India
- South Korea
- South-East Asia
- Rest of Asia-Pacific
- Middle East and Africa
- Middle East
- Saudi Arabia
- United Arab Emirates
- Turkey
- Rest of Middle East
- Africa
- South Africa
- Nigeria
- Rest of Africa
- Middle East
- North America
Geography Analysis
North America held a 41.05% share in 2025 as the U.S. EPA's 40 CFR Part 60/75 rules and OSHA exposure limits necessitated continuous analyzers across refineries, chemical parks, and power plants. Ample capital budgets, established service infrastructures, and long-tenured workforces allow quick integration of AI-supported chemometrics. Persistent helium tightness and labor shortages do temper replacement cycles, but vendor-managed service agreements buffer downtime risk.
Asia-Pacific is growing 8.21% per year, making it the fastest-scaling geography in the process analytical instrumentation market. China's reinforced pollution-control ordinances, India's consent-to-operate mandates, and Japan's JAIMA-led standardization initiatives collectively open sizeable order backlogs. Continuous analyzers are being embedded not only in mega-refineries and steelworks but also in smaller specialty-chemical parks keen to meet export-market QC demands. Regional suppliers partner with global OEMs to localize service, easing import-duty burdens and language barriers.
Europe maintains steady expansion anchored to the October 2024 Ambient Air Quality Directive, which compels ultrafine-particle measurement across 27 member states. Petrochemical clusters along the Rhine and in Iberia replace legacy opacity meters with modern FTIR cells to satisfy CO2 taxation reporting. Simultaneously, green-hydrogen electrolyzer projects in Germany and Spain demand high-purity oxygen and hydrogen validation, catalyzing analyzer uptake. Eastern European processors, eager to secure REPowerEU funding, adopt Western emission standards, adding incremental volume for vendors.
- ABB Ltd
- Siemens AG
- Emerson Electric Co.
- Endress+Hauser Group Services AG
- Bruker Corporation
- Yokogawa Electric Corporation
- Thermo Fisher Scientific Inc.
- Agilent Technologies Inc.
- Honeywell International Inc.
- Mettler-Toledo International Inc.
- MKS Instruments Inc.
- Teledyne Technologies Incorporated
- Servomex Group Ltd.
- SICK AG
- Focused Photonics Inc.
- Hach Company (Danaher)
- Extrel CMS LLC
- Nova Analytical Systems Inc.
- Neo Monitors AS
- Rockwell Automation Inc.
Additional Benefits:
- The market estimate (ME) sheet in Excel format
- 3 months of analyst support
TABLE OF CONTENTS
1 INTRODUCTION
- 1.1 Study Assumptions and Market Definition
- 1.2 Scope of the Study
2 RESEARCH METHODOLOGY
3 EXECUTIVE SUMMARY
4 MARKET LANDSCAPE
- 4.1 Market Overview
- 4.2 Market Drivers
- 4.2.1 Regulatory push for in-process quality and emission compliance
- 4.2.2 Digitalization and Industry 4.0 adoption across process industries
- 4.2.3 Rising demand for real-time analytics in oil, gas and petrochemicals
- 4.2.4 Rapid expansion of biopharma continuous manufacturing lines
- 4.2.5 Green-hydrogen electrolyzer build-outs needing high-purity gas analysis
- 4.2.6 Deployment of digital-twin models requiring high-fidelity inline data
- 4.3 Market Restraints
- 4.3.1 High capital and lifecycle costs of sophisticated analyzers
- 4.3.2 Shortage of skilled calibration and maintenance personnel
- 4.3.3 Cyber-security vulnerabilities in networked analyzers
- 4.3.4 Global helium scarcity impacting GC operations
- 4.4 Porter's Five Forces Analysis
- 4.4.1 Bargaining Power of Suppliers
- 4.4.2 Bargaining Power of Buyers
- 4.4.3 Threat of New Entrants
- 4.4.4 Threat of Substitutes
- 4.4.5 Degree of Competition
- 4.5 Industry Supply Chain Analysis
- 4.6 Impact of Macroeconomic Factors
5 MARKET SIZE AND GROWTH FORECASTS (VALUE)
- 5.1 By Instrument Type
- 5.1.1 Gas Chromatographs
- 5.1.2 Gas Analyzers
- 5.1.3 Liquid Analyzers
- 5.1.4 Spectrometers
- 5.2 By Component
- 5.2.1 Hardware
- 5.2.2 Software
- 5.2.3 Services
- 5.3 By End-user Industry
- 5.3.1 Oil and Gas
- 5.3.2 Chemicals and Petrochemicals
- 5.3.3 Pharmaceutical and Biotechnology
- 5.3.4 Metals and Mining
- 5.3.5 Water and Wastewater
- 5.3.6 Food and Beverage
- 5.3.7 Power Generation
- 5.4 By Installation Type
- 5.4.1 In-line/On-line
- 5.4.2 At-line
- 5.4.3 Laboratory
- 5.5 By Geography
- 5.5.1 North America
- 5.5.1.1 United States
- 5.5.1.2 Canada
- 5.5.1.3 Mexico
- 5.5.2 South America
- 5.5.2.1 Brazil
- 5.5.2.2 Argentina
- 5.5.2.3 Rest of South America
- 5.5.3 Europe
- 5.5.3.1 Germany
- 5.5.3.2 United Kingdom
- 5.5.3.3 France
- 5.5.3.4 Italy
- 5.5.3.5 Spain
- 5.5.3.6 Russia
- 5.5.3.7 Rest of Europe
- 5.5.4 Asia-Pacific
- 5.5.4.1 China
- 5.5.4.2 Japan
- 5.5.4.3 India
- 5.5.4.4 South Korea
- 5.5.4.5 South-East Asia
- 5.5.4.6 Rest of Asia-Pacific
- 5.5.5 Middle East and Africa
- 5.5.5.1 Middle East
- 5.5.5.1.1 Saudi Arabia
- 5.5.5.1.2 United Arab Emirates
- 5.5.5.1.3 Turkey
- 5.5.5.1.4 Rest of Middle East
- 5.5.5.2 Africa
- 5.5.5.2.1 South Africa
- 5.5.5.2.2 Nigeria
- 5.5.5.2.3 Rest of Africa
- 5.5.5.1 Middle East
- 5.5.1 North America
6 COMPETITIVE LANDSCAPE
- 6.1 Market Concentration
- 6.2 Strategic Moves
- 6.3 Market Share Analysis
- 6.4 Company Profiles (includes Global level Overview, Market level overview, Core Segments, Financials as available, Strategic Information, Market Rank/Share for key companies, Products and Services, and Recent Developments)
- 6.4.1 ABB Ltd
- 6.4.2 Siemens AG
- 6.4.3 Emerson Electric Co.
- 6.4.4 Endress+Hauser Group Services AG
- 6.4.5 Bruker Corporation
- 6.4.6 Yokogawa Electric Corporation
- 6.4.7 Thermo Fisher Scientific Inc.
- 6.4.8 Agilent Technologies Inc.
- 6.4.9 Honeywell International Inc.
- 6.4.10 Mettler-Toledo International Inc.
- 6.4.11 MKS Instruments Inc.
- 6.4.12 Teledyne Technologies Incorporated
- 6.4.13 Servomex Group Ltd.
- 6.4.14 SICK AG
- 6.4.15 Focused Photonics Inc.
- 6.4.16 Hach Company (Danaher)
- 6.4.17 Extrel CMS LLC
- 6.4.18 Nova Analytical Systems Inc.
- 6.4.19 Neo Monitors AS
- 6.4.20 Rockwell Automation Inc.
7 MARKET OPPORTUNITIES AND FUTURE OUTLOOK
- 7.1 White-space and Unmet-need Assessment