

|
시장보고서
상품코드
2123378
B2B용 기업 및 산업용 웨어러블 시장 : 점유율 분석, 업계 동향과 통계, 성장 예측(2026-2031년)B2B Enterprise And Industrial Wearables - Market Share Analysis, Industry Trends & Statistics, Growth Forecasts (2026 - 2031) |
||||||
 Mordor Intelligence
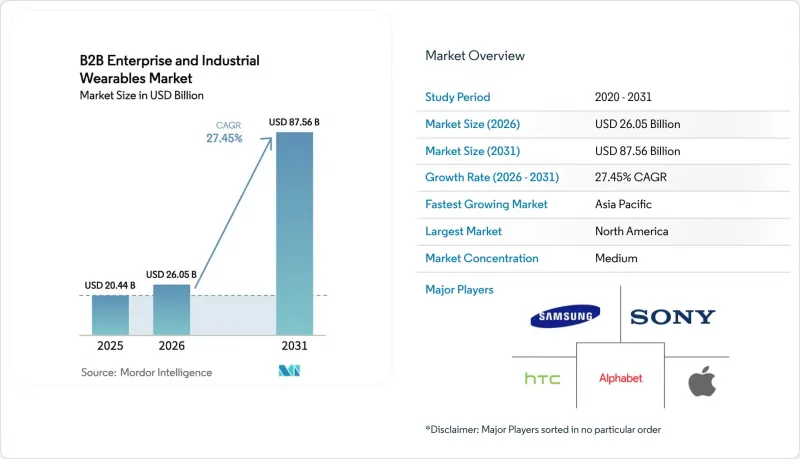
Mordor Intelligence에 의하면, B2B용 기업 및 산업용 웨어러블 시장 규모는 2025년에 204억 4,000만 달러로 평가되었고 2026년 260억 5,000만 달러에서 2031년까지 875억 6,000만 달러에 이를 것으로 예측되며, 예측 기간(2026-2031년) CAGR은 27.45%를 나타낼 전망입니다.
본 보고서는 기기 유형(HMD, 리스트웨어, 스마트 글래스 등), 최종 사용자 산업(IT 및 통신, 헬스케어 등), 구성 요소(센서, 디스플레이·광학 시스템 등), 용도(원격 지원·워크플로우 안내 등), 연결 기술(블루투스/BLE 등) 및 지역별로 분류되어 있습니다. 시장 전망은 금액(달러) 기준으로 제시되어 있습니다.
전 세계 B2B 기업 및 산업용 웨어러블 시장 동향과 인사이트
확대되는 앱 생태계가 기업 내 도입을 촉진
기업들은 디스플레이 해상도나 배터리 지속 시간이 아니라, 소프트웨어 스택이 기존의 ERP, MES, CMMS 워크플로우와 얼마나 원활하게 통합되는지에 따라 웨어러블 기기를 평가하는 경향이 강해지고 있습니다. PTC의 Vuforia Studio에는 현재 200개 이상의 모듈형 AR 워크플로가 기본으로 탑재되어 있으며, 사용자 정의 코드 없이 도입할 수 있어 파일럿 단계의 기간을 몇 개월에서 몇 주로 단축할 수 있습니다. Siemens의 Industrial Edge 마켓플레이스는 이와 유사한 플러그 앤 플레이 방식을 제조 실행 환경으로 확장하여, 공장이 최소한의 IT 투자로 병렬 생산 라인에서 동일한 워크플로를 실행할 수 있게 해줍니다. 보잉(Boeing)에서는 AR 기반 가이던스를 도입하여 와이어 하네스 조립 시간을 25% 단축하고 오류를 90% 줄였습니다. 이를 통해 전체 항공기에 이를 확대 적용하는 데 필요한 자금을 조달하기 전에 재무 부서가 요구하는 ROI에 대한 명확성을 확보할 수 있었습니다. 이러한 맞춤형 개발에서 API 우선 모듈로의 전환은 전환 비용을 절감하고 사용자 도입을 가속화하며, 시장을 단순한 연구 개발상의 호기심이 아닌 정식 자본 예산 항목으로 확고히 자리매김하게 했습니다.
스마트 팩토리 구축에 대한 수요
중국의 ‘중국 제조 2025’나 인도의 생산 연계형 인센티브 제도와 같은 국가 프로그램에서는 예외 처리나 품질 검사를 위해 웨어러블을 착용한 기술자에 의존하는 자동화 생산 라인에 수십억 단위의 예산이 배정되고 있습니다. BMW의 레겐스부르크 물류 팀은 스마트 글래스 도입 후 피킹 오류가 15% 감소했다고 보고한 반면, 보쉬(Bosch)는 웨어러블 센서에서 전송되는 데이터 스트림을 자사의 ‘ConnectedWorld’ IoT 플랫폼에 통합하여 예측 유지보수 작업 지시를 발동하고 있습니다. 이러한 이용 사례는 웨어러블 기기가 인더스트리 4.0에서 인간과 기계의 인터페이스 역할을 수행하며, 물리적 자산을 디지털 트윈에 연결하고, 공장 관리자가 실행에 옮기기 전에 공정 변경을 시뮬레이션한다는 주장을 뒷받침하고 있습니다. 공장이 데이터 팩토리로 변모함에 따라 헤드 마운트 디스플레이, 스마트 장갑, 생체 인식 조끼에 대한 수요도 함께 확대되고 있습니다.
비즈니스급 용도의 부족
많은 AR 및 워크플로우 지침 제품군은 여전히 시범 단계에 머물러 있으며, ISO 9001 감사 추적, 역할 기반 접근 제어, 또는 지속적인 생체 신호 원격 측정에 필요한 FDA 510(k) 검증과 같은 필수 기능이 부족합니다. 병원에서는 EHR(전자 건강 기록)의 상호 운용성 요건을 충족하지 못하는 소비자용 웨어러블 기기에 의존할 수밖에 없는 경우가 많으며, 그 결과 임상 직원이 수작업으로 데이터를 대조해야 합니다. Android, 자체 개발 RTOS, iOS와 같은 플랫폼 간의 분절화로 인해 IT 부서는 여러 코드베이스를 병행하여 유지 관리할 수밖에 없어 소유 비용이 증가하고 있습니다. EU-OSHA(유럽 직업안전보건청)는 불투명한 데이터 흐름이 심리사회적 위험을 높인다고 경고하고 있으며, 이는 노동자 평의회에 대한 위험 신호입니다. 소프트웨어가 기업의 거버넌스 기준을 따라잡을 때까지는 도입 진척도가 하드웨어 준비 상황에 뒤처지게 될 것입니다.
부문 분석
스마트 글래스는 2025년 매출의 31.02%를 차지하며, 핸즈프리 검사 및 원격 전문가에 의한 워크플로우에서 그 성숙도를 입증하고 있습니다. RealWear 및 Vuzix의 제품은 IP67 방수·방진 규격을 충족하며, 음성 제어와 고휘도 마이크로 OLED 광학 시스템을 결합하여 자동차 생산 라인 작업자가 장갑을 벗지 않고도 매뉴얼을 확인할 수 있게 해줍니다. 스마트글라스 시장 규모는 차세대 광학 기술로 인해 폼 팩터가 경량화되고 시야각이 확대됨에 따라 견조한 속도로 성장할 것으로 예측됩니다. 한편, 스마트 의류 및 신체 센서는 열 스트레스 및 유해 가스 노출을 실시간으로 모니터링하기 위한 규제 동향을 반영하여 연평균 성장률(CAGR) 28.74%로 성장할 전망입니다. PPG(맥파 측정),가속도계, CO₂ 센서를 내장한 Honeywell의 생체 인식 안전 조끼는 부피가 큰 장비를 추가하지 않고도 OSHA(미국 직업안전보건청)의 열사병 예방 지침을 충족하며, 직물에 통합된 웨어러블 기기를 지난 10년간의 획기적인 폼 팩터로 자리매김하고 있습니다.
도입 범위가 확대됨에 따라 현재는 2단계 인증 및 알림 신호를 발신하는 손목 착용형 기기, 밀폐 공간에서의 구조 훈련용 VR 훈련용 HMD, 법 집행 기관의 증거 수집용 웨어러블 카메라 등이 포함됩니다. 소니의 4K, 1인치 마이크로 OLED 디스플레이를 통해 처방전용 안경테와 유사하면서도 산업용 수준의 밝기를 구현하는 안경이 가능해졌으며, 과거 헤드마운트형 컴퓨터에 따르던 사회적 편견이 해소되었습니다. 팬케이크형 광학 시스템과 도파관 관련 특허를 통해 추가적인 경량화가 기대되며, 이를 통해 근무 시간 중의 편안함이 확보될 뿐만 아니라, 유지보수 작업에서 러기드 태블릿을 대체하는 속도가 가속화될 것입니다.
2025년 지출 중 제조업이 27.95%를 차지하고 있으며, 그 주된 요인은 예측 유지보수와 조립 가이드입니다. 이 분야 시장 점유율은 높은 인건비와 자동화 투자를 정당화하는 엄격한 100만 개당 불량 수 목표에 기인합니다. BMW와 Bosch의 사례에서 볼 수 있듯이, 재작업 감소는 안전 사고 감소를 고려하기 전이라도 즉시 투자 회수로 이어집니다. 의료 분야는 메디케어·메디케이드 서비스 센터(CMS)가 원격 환자 모니터링에 대한 진료 보수 코드를 인증하고, FDA가 임상용 바이오센서를 승인함에 따라 연평균 성장률(CAGR) 29.86%를 기록하며 가장 빠르게 성장하고 있는 분야입니다. 지속적인 원격 측정으로 입원 기간이 단축되어, 의료 제공업체는 가치 기반 계약에서 위험을 전가할 수 있게 됩니다.
IT 및 통신 분야의 현장 작업자는 AR 오버레이를 활용하여 출장 수리 횟수를 줄이고, 첫 수리 시 결함을 감소시키고 있습니다. 한편, 소매 창고에서는 장갑형 스캐너를 도입하여 피킹 주기를 몇 초 단축하고 있습니다. 운송 회사의 차량 팀에서는 운전자의 안전 모니터링 기능도 겸하는 스마트 워치를 배포하고 있으며, 텔레매틱스 데이터에 더해 심박 변동을 수집하여 피로를 예측했습니다. 유틸리티 및 석유 및 가스 기업에서는 검사원에게 ATEX 인증을 받은 스마트글래스를 착용하게 하여, 종이 기록을 음성으로 기록된 검사 기록으로 대체하고 있습니다.
지역별 분석
북미는 2025년 매출의 39.65%를 차지했습니다. 엄격한 OSHA 기준과 물류 대기업들의 AR 조기 도입이 보급의 기반을 마련했습니다. 미국의 항공우주, 자동차, 석유 대기업들은 디지털 트윈 로드맵에 웨어러블 기술을 지속적으로 통합하고 있으며, 이를 통해 시장을 확립된 연간 예산 수준으로 견인하고 있습니다. 캐나다에서는 외딴 지역의 광업 및 임업 현장에서 내구성이 뛰어난 스마트 글래스가 활용되고 있습니다. 이러한 현장에서는 ‘플라이-인-플라이-아웃(Fly-in-Fly-out)’ 방식으로 근무하는 작업자들이 Off-grid 환경에서 진단이 필요합니다. 멕시코의 마키라도라 공장에서는 북미 OEM 제조업체의 ‘제로 결함’ 요건을 충족하기 위해 웨어러블 단말기가 도입되고 있습니다.
아시아태평양은 2031년까지 연평균 성장률(CAGR) 30.90%를 나타낼 것으로 전망됩니다. 베이징의 ‘중국 제조 2025’ 계획은 양쯔강 삼각주 지역의 자동화 공장에 자금을 지원하며, 웨어러블 기기에서 수집된 데이터를 실시간 MES 대시보드에 통합하고 있습니다. 인도의 생산 연계 인센티브(PLI)를 통한 지출은 제약 및 자동차 부문을 위한 스마트웨어 시범 사업에 자금을 지원하여 노동력의 기술 격차 해소를 도모하고 있습니다. 일본의 ‘Society 5.0’ 구상에서는 웨어러블 기기가 고령화되는 노동력과 로봇 동료 사이의 인터페이스로 자리매김하고 있으며, 스마트 외골격과 생체 인식 슬리브가 근골격계의 부담을 줄이는 데 기여하고 있습니다. 한국의 반도체 제조 공장에서는 UWB 지원 배지를 도입하여 클린룸의 구역 분리를 철저히 하고 있는 반면, 호주의 광산에서는 사고 위험을 줄이기 위해 피로 감지 조끼가 채택되고 있습니다.
유럽에서는 견조하면서도 규제에 뒷받침된 성장이 나타나고 있습니다. 독일은 인더스트리 4.0 보조금과 CE 마킹에 관한 전문 지식을 활용하여 웨어러블 지원 턴키 생산 라인을 수출하고 있습니다. GDPR(EU 개인정보보호규정)에 따라 On-Premise 추론이 의무화됨에 따라 엣지 AI 칩 제조업체들이 주목받고 있습니다. 프랑스와 이탈리아에서는 노동자 평의회가 감시용 광학 기기에 대해 논의하고 있어 도입 속도가 둔화되고 있지만, 토리노와 모데나의 자동차 산업 클러스터에서는 토크 렌치 교정을 위한 스마트글라스 실증 실험이 진행되고 있습니다. 영국에서는 브렉시트 이후 기준이 분화되면서 규정 준수 복잡성이 증가하고 있지만, 한편으로는 혁신적인 공급업체에게는 신속한 시장 진입 경로가 열리고 있습니다. 그 밖의 지역에서는 중동이 건설 현장에서 웨어러블 안전 장비 착용을 의무화하는 것을 포함한 스마트 시티 메가 프로젝트에 투자하고 있는 반면, 남미에서는 브라질의 노천 광산에서 엣지 AI 지원 웨어러블 기기의 시범 도입이 진행되고 있습니다.
기타 혜택:
- 엑셀 형식 시장 전망(ME) 시트
- 3개월간 애널리스트 지원
자주 묻는 질문
목차
제1장 서론
제2장 조사 방법
제3장 주요 요약
제4장 시장 구도
제5장 시장 규모와 성장 예측
제6장 경쟁 구도
제7장 시장 기회와 향후 전망
JHS 26.09.11According to Mordor Intelligence, the B2B enterprise and industrial wearables market size was valued at USD 20.44 billion in 2025 and estimated to grow from USD 26.05 billion in 2026 to reach USD 87.56 billion by 2031, at a CAGR of 27.45% during the forecast period (2026-2031).
This report is Segmented by Device Type (HMDs, Wrist Wears, Smart Glass, and More), End-User Industry (IT and Telecom, Healthcare, and More), Component (Sensors, Displays and Optics, and More), Application (Remote Assistance and Workflow Guidance, and More), Connectivity Technology (Bluetooth/BLE, and More), and Geography. The Market Forecasts are Provided in Terms of Value (USD).
Global B2B Enterprise And Industrial Wearables Market Trends and Insights
Growing App Ecosystem Fuels Enterprise Adoption
Enterprises increasingly judge wearables by how well the software stack integrates with existing ERP, MES, and CMMS workflows, rather than by display resolution or battery longevity. PTC's Vuforia Studio now ships with over 200 modular AR workflows that can be deployed without custom code, shrinking pilot phases from months to weeks. Siemens' Industrial Edge Marketplace extends similar plug-and-play logic to manufacturing execution environments, allowing plants to run the same workflow in parallel lines with minimal IT investment. At Boeing, AR guidance reduced wiring-harness assembly time by 25% and errors by 90%, providing the ROI clarity that finance groups require before funding fleetwide rollouts. This pivot from bespoke development to API-first modules lowers switching costs, accelerates user onboarding, and solidifies the B2B enterprise and industrial wearables market as a line item in formal capital budgets, rather than an R&D curiosity.
Demand for Smart Factory Set-Ups
National programs such as China's Made in China 2025 and India's Production-Linked Incentive schemes earmark billions for automated production lines that rely on wearable-equipped technicians for exception handling and quality inspection. BMW's Regensburg logistics team reported a 15% reduction in picking errors after smart-glass deployment, while Bosch feeds wearable sensor streams into its ConnectedWorld IoT platform to trigger predictive maintenance work orders. These use cases validate the thesis that wearables serve as the human-machine interface of Industry 4.0, linking physical assets to digital twins that simulate process changes before plant managers pull the trigger. As factories become data factories, demand for head-mounted displays, smart gloves, and biometric vests scales in lockstep.
Lack of Business-Grade Applications
Many AR and workflow guidance suites remain pilot-grade, lacking essential features such as ISO 9001 audit trails, role-based access controls, or FDA 510(k) validations required for continuous vital-sign telemetry. Hospitals are often forced to rely on consumer-grade wearables that do not meet EHR interoperability requirements, leaving clinical staff to manually reconcile data. Fragmentation across Android, proprietary RTOS, and iOS platforms obliges IT to maintain parallel code bases, inflating ownership costs. EU-OSHA has warned that opaque data flows heighten psychosocial risks, a red flag for worker councils. Until software catches up with enterprise governance standards, adoption will lag hardware readiness.
Other drivers and restraints analyzed in the detailed report include:
- Rapid Gains in 5G Stand-Alone and Private Networks
- Edge AI Chips Reduce Latency and Power Budget
- Data Security and Legacy IT Integration Issues
For complete list of drivers and restraints, kindly check the Table Of Contents.
Segment Analysis
Smart glass delivered 31.02% of 2025 revenue, underscoring its maturity in hands-free inspection and remote expert workflows. RealWear and Vuzix units meet IP67 ingress ratings and pair voice control with high-brightness micro-OLED optics, letting automotive line workers navigate manuals without removing gloves. The B2B enterprise and industrial wearables market size for smart glass is projected to expand at a healthy clip as next-generation optics lighten form factors and extend field of view. Yet, smart clothing and body sensors are poised for a 28.74% CAGR, reflecting regulatory moves to monitor heat stress and hazardous gas exposure in real-time. Honeywell's biometric safety vest, which embeds PPG, accelerometer, and CO2 sensors, fulfills OSHA heat illness prevention guidance without adding bulky gear, positioning textile-integrated wearables as the breakout form factor of the decade.
The widening adoption spectrum now includes wrist wear for two-factor authentication and notification pings, HMDs for VR training in confined-space rescue, and wearable cameras for capturing law enforcement evidence. Sony's 4K, 1-inch micro-OLED display enables glasses that resemble prescription frames yet deliver industrial brightness, erasing the cultural stigma once associated with head-mounted computers. Pancake optics and waveguide patents promise further weight reductions, translating to full-shift comfort and accelerating replacement of rugged tablets in maintenance work orders.
Manufacturing accounted for 27.95% of the 2025 spend, primarily driven by predictive maintenance and assembly guidance. The B2B enterprise and industrial wearables market share for the sector stems from high labor costs and strict defect-per-million targets that justify automation outlays. BMW and Bosch demonstrate that reducing rework yields immediate payback, even before accounting for fewer safety incidents. Healthcare is the fastest-growing sector, with a 29.86% CAGR, as the Centers for Medicare and Medicaid Services reimburse remote patient monitoring codes and the FDA clears clinical-grade biosensors. Continuous telemetry reduces hospital stays, allowing providers to shift risk in value-based contracts.
IT and telecom field crews utilize AR overlays to reduce truck rolls and first-time-fix errors, while retail warehouses deploy glove scanners to shave seconds off of pick cycles. Transportation fleets issue smart watches that double as driver safety monitors, collecting heart-rate variability alongside telematics to predict fatigue. Utilities and oil and gas firms equip inspectors with ATEX-certified smart glasses, replacing paper logs with voice-captured inspection records.
Complete Report Scope:
- By Device Type
- HMDs
- Wrist Wears
- Smart Glass
- Smart Clothing and Body Sensors
- Wearable Cameras
- Other Device Types
- By End-User Industry
- IT and Telecom
- Healthcare
- Retail and E-Commerce
- Insurance and Financial Services
- Manufacturing
- Transportation and Logistics
- Other End-User Industries
- By Component
- Sensors
- Displays and Optics
- Processors and Memory
- Connectivity Modules
- Power and Battery
- Software and Services
- By Application
- Remote Assistance and Workflow Guidance
- Worker Safety and Health Monitoring
- Training and Simulation
- Predictive Maintenance
- Inventory and Asset Management
- Quality Inspection and Documentation
- By Connectivity Technology
- Bluetooth / BLE
- Wi-Fi / Wi-Fi 6 / 6E
- 4G LTE / LTE-M / NB-IoT
- 5G and 5G RedCap
- UWB and Short-Range RF
- By Geography
- North America
- United States
- Canada
- Mexico
- South America
- Brazil
- Argentina
- Rest of South America
- Europe
- Germany
- United Kingdom
- France
- Italy
- Spain
- Rest of Europe
- Asia-Pacific
- China
- Japan
- India
- South Korea
- Australia
- Rest of Asia-Pacific
- Middle East and Africa
- Middle East
- Saudi Arabia
- United Arab Emirates
- Turkey
- Rest of Middle East
- Africa
- South Africa
- Egypt
- Nigeria
- Rest of Africa
- Middle East
- North America
Geography Analysis
North America generated 39.65% of 2025 revenue. Stringent OSHA standards and early adoption of AR by logistics behemoths laid the groundwork for widespread uptake. U.S. aerospace, automotive, and oil majors continue to layer wearables on top of digital-twin roadmaps, driving the B2B enterprise and industrial wearables market toward established annual budgets. Canada utilizes rugged smart glass in remote mining and forestry operations, where fly-in-fly-out crews require off-grid diagnostics. Mexico's maquiladora plants adopt wearables to satisfy zero-defect mandates from North American OEMs.
Asia-Pacific is poised for a 30.90% CAGR through 2031. Beijing's Made in China 2025 agenda finances automated factories in the Yangtze River Delta, embedding wearable feeds into real-time MES dashboards. India's Production-Linked Incentive outlays fund smart clothing pilots for the pharmaceutical and automotive sectors, addressing labor-skill gaps. Japan's Society 5.0 vision positions wearables as the interface between an aging workforce and robotic co-workers, with smart exoskeletons and biometric sleeves helping to ease musculoskeletal strain. South Korea's semiconductor fabs deploy UWB-enabled badges to enforce cleanroom zoning, while Australia's mines adopt fatigue-detection vests to mitigate accident risks.
Europe shows robust yet regulated growth. Germany leverages Industrie 4.0 subsidies and CE-marking expertise to export turnkey wearable-enabled production lines. GDPR compels on-premises inference, putting the spotlight on edge AI chipmakers. France and Italy face slower roll-outs as worker councils debate surveillance optics, though automotive clusters in Turin and Modena pilot smart glasses for torque-wrench calibration. The United Kingdom's divergent post-Brexit standards add compliance complexity but also open fast-track routes for innovative suppliers. Elsewhere, the Middle East invests in smart-city megaprojects that include wearable safety mandates on construction sites, while South America pilots edge-AI-enabled wearables in Brazil's open-pit mines.
- Meta Platforms Inc. (Oculus VR LLC)
- Alphabet Inc.
- Samsung Electronics Co. Ltd.
- Sony Group Corporation
- HTC Corporation
- Apple Inc.
- Fitbit LLC (Google LLC)
- Xiaomi Corp.
- Seiko Epson Corporation
- Microsoft Corporation
- Texas Instruments Incorporated
- Toshiba Corporation
- Honeywell International Inc.
- RealWear Inc.
- Zebra Technologies Corporation
- Vuzix Corporation
- ProGlove GmbH
- Qualcomm Incorporated
- Panasonic Holdings Corporation
- Kopin Corporation
Additional Benefits:
- The market estimate (ME) sheet in Excel format
- 3 months of analyst support
TABLE OF CONTENTS
1 INTRODUCTION
- 1.1 Study Assumptions and Market Definition
- 1.2 Scope of the Study
2 RESEARCH METHODOLOGY
3 EXECUTIVE SUMMARY
4 MARKET LANDSCAPE
- 4.1 Market Overview
- 4.2 Market Drivers
- 4.2.1 Growing App Ecosystem Fuels Enterprise Adoption
- 4.2.2 Demand for Smart Factory Set-Ups
- 4.2.3 Rapid Gains in 5G Stand-Alone and Private Networks
- 4.2.4 Edge AI Chips Reduce Latency and Power Budget
- 4.2.5 Regulatory Push for Workforce Safety Compliance
- 4.2.6 Mainstreaming of Digital Twins in Heavy Industry
- 4.3 Market Restraints
- 4.3.1 Lack of Business-Grade Applications
- 4.3.2 Data Security and Legacy IT Integration Issues
- 4.3.3 High Up-Front TCO and Uncertain ROI
- 4.3.4 Worker Privacy and Wear Fatigue Concerns
- 4.4 Industry Value Chain Analysis
- 4.5 Regulatory Landscape
- 4.6 Technological Outlook
- 4.7 Impact of Macroeconomic Factors on the Market
- 4.8 Porter's Five Forces Analysis
- 4.8.1 Threat of New Entrants
- 4.8.2 Bargaining Power of Buyers
- 4.8.3 Bargaining Power of Suppliers
- 4.8.4 Threat of Substitute Products
- 4.8.5 Intensity of Competitive Rivalry
5 MARKET SIZE AND GROWTH FORECASTS (VALUE)
- 5.1 By Device Type
- 5.1.1 HMDs
- 5.1.2 Wrist Wears
- 5.1.3 Smart Glass
- 5.1.4 Smart Clothing and Body Sensors
- 5.1.5 Wearable Cameras
- 5.1.6 Other Device Types
- 5.2 By End-User Industry
- 5.2.1 IT and Telecom
- 5.2.2 Healthcare
- 5.2.3 Retail and E-Commerce
- 5.2.4 Insurance and Financial Services
- 5.2.5 Manufacturing
- 5.2.6 Transportation and Logistics
- 5.2.7 Other End-User Industries
- 5.3 By Component
- 5.3.1 Sensors
- 5.3.2 Displays and Optics
- 5.3.3 Processors and Memory
- 5.3.4 Connectivity Modules
- 5.3.5 Power and Battery
- 5.3.6 Software and Services
- 5.4 By Application
- 5.4.1 Remote Assistance and Workflow Guidance
- 5.4.2 Worker Safety and Health Monitoring
- 5.4.3 Training and Simulation
- 5.4.4 Predictive Maintenance
- 5.4.5 Inventory and Asset Management
- 5.4.6 Quality Inspection and Documentation
- 5.5 By Connectivity Technology
- 5.5.1 Bluetooth / BLE
- 5.5.2 Wi-Fi / Wi-Fi 6 / 6E
- 5.5.3 4G LTE / LTE-M / NB-IoT
- 5.5.4 5G and 5G RedCap
- 5.5.5 UWB and Short-Range RF
- 5.6 By Geography
- 5.6.1 North America
- 5.6.1.1 United States
- 5.6.1.2 Canada
- 5.6.1.3 Mexico
- 5.6.2 South America
- 5.6.2.1 Brazil
- 5.6.2.2 Argentina
- 5.6.2.3 Rest of South America
- 5.6.3 Europe
- 5.6.3.1 Germany
- 5.6.3.2 United Kingdom
- 5.6.3.3 France
- 5.6.3.4 Italy
- 5.6.3.5 Spain
- 5.6.3.6 Rest of Europe
- 5.6.4 Asia-Pacific
- 5.6.4.1 China
- 5.6.4.2 Japan
- 5.6.4.3 India
- 5.6.4.4 South Korea
- 5.6.4.5 Australia
- 5.6.4.6 Rest of Asia-Pacific
- 5.6.5 Middle East and Africa
- 5.6.5.1 Middle East
- 5.6.5.1.1 Saudi Arabia
- 5.6.5.1.2 United Arab Emirates
- 5.6.5.1.3 Turkey
- 5.6.5.1.4 Rest of Middle East
- 5.6.5.2 Africa
- 5.6.5.2.1 South Africa
- 5.6.5.2.2 Egypt
- 5.6.5.2.3 Nigeria
- 5.6.5.2.4 Rest of Africa
- 5.6.5.1 Middle East
- 5.6.1 North America
6 COMPETITIVE LANDSCAPE
- 6.1 Market Concentration
- 6.2 Strategic Moves
- 6.3 Market Share Analysis
- 6.4 Company Profiles (includes Global Level Overview, Market Level Overview, Core Segments, Financials as Available, Strategic Information, Market Rank/Share for Key Companies, Products and Services, and Recent Developments)
- 6.4.1 Meta Platforms Inc. (Oculus VR LLC)
- 6.4.2 Alphabet Inc.
- 6.4.3 Samsung Electronics Co. Ltd.
- 6.4.4 Sony Group Corporation
- 6.4.5 HTC Corporation
- 6.4.6 Apple Inc.
- 6.4.7 Fitbit LLC (Google LLC)
- 6.4.8 Xiaomi Corp.
- 6.4.9 Seiko Epson Corporation
- 6.4.10 Microsoft Corporation
- 6.4.11 Texas Instruments Incorporated
- 6.4.12 Toshiba Corporation
- 6.4.13 Honeywell International Inc.
- 6.4.14 RealWear Inc.
- 6.4.15 Zebra Technologies Corporation
- 6.4.16 Vuzix Corporation
- 6.4.17 ProGlove GmbH
- 6.4.18 Qualcomm Incorporated
- 6.4.19 Panasonic Holdings Corporation
- 6.4.20 Kopin Corporation
7 MARKET OPPORTUNITIES AND FUTURE OUTLOOK
- 7.1 White-Space and Unmet-Need Assessment


