|
시장보고서
상품코드
2124107
바이오차 시장 : 시장 점유율 분석, 업계 동향 및 통계, 성장 예측(2026-2031년)Biochar - Market Share Analysis, Industry Trends & Statistics, Growth Forecasts (2026 - 2031) |
||||||
 Mordor Intelligence
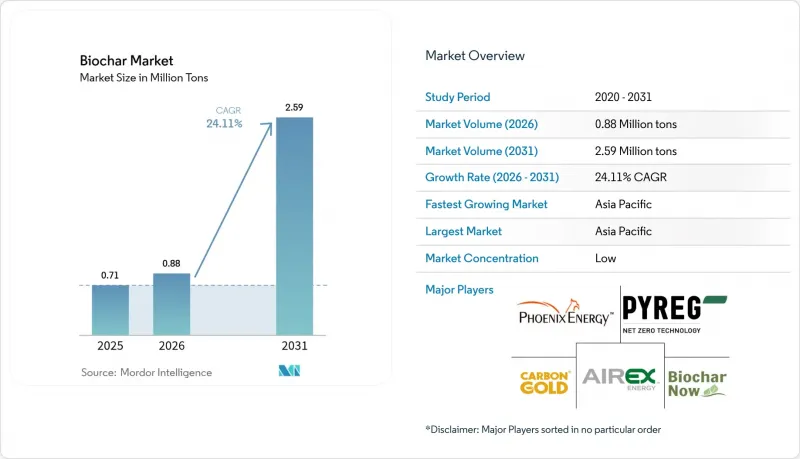
Mordor Intelligence에 의하면, 2026년 바이오차 시장 규모는 88만 톤으로 추정되고, 2025년 71만 톤으로부터 확대해, 2031년에는 259만 톤에 이를 것으로 예측됩니다.
2026-2031년 연평균 성장률(CAGR)은 24.11%를 나타낼 것으로 전망됩니다.
본 보고서는 기술별(열분해, 가스화 시스템 등), 원료별(목질 바이오매스, 농업 잔여물 등), 형태별(분말, 펠릿/과립, 액체 현탁액), 용도별(농업, 축산 등) 및 지역별(아시아태평양, 북미, 유럽, 남미, 중동 및 아프리카)로 분류되어 있습니다. 시장 예측은 수량(톤) 기준으로 제시되어 있습니다.
세계의 바이오차 시장 동향 및 인사이트
유기 농업 및 재생 농업에서 수요 증가
유기농 농가들은 프리미엄 인증에 필요한 토양 유기탄소 점수 향상을 목표로 합성 자재를 바이오차으로 대체하고 있습니다. 미국 20개 주에서는 이미 NRCS(미국 농무부 자연자원보전국)의 ‘토양 탄소 개량 808’ 기준이 시행되고 있으며, 검증된 바이오차 시비에 대해 생산자에게 보조금이 지급되고 있습니다. 수확량 시험에 따르면, 특히 영양분이 부족한 토양에서 첫해 생산성 향상률은 9%에 육박하며, 6개 시즌 후에는 누적 20% 이상의 향상이 확인되었습니다. 바이오차는 미처리 바이오매스를 원료로 하는 경우, 미국 농무부(USDA) 인증 유기농업 시스템에서의 사용이 허용됩니다. 이 규정은 시장의 주요 장벽을 제거하고 프리미엄 가격 책정을 뒷받침합니다. ‘캐스케이드 이용’이라는 개념-바이오차을 먼저 여과재나 가축 깔짚으로 사용한 후, 밭에 재투입하는 것-은 수입원을 확대하는 동시에 순환형 경제의 지침에도 부합합니다. 투입 자재 가격이 계속 변동하는 가운데, 생산자들은 바이오차을 안정적인 영양 공급과 장기적인 탄소 크레딧을 확보하기 위한 헤지 수단으로 여기고 있습니다.
탄소 흡수 소재 및 폐기물 유가화에 대한 정부의 인센티브
정책적 조치가 수요를 가속화하고 있습니다. ‘인플레이션 억제법’은 섹션 45Q 및 45V의 세액 공제 대상을 탄소 이용 경로까지 확대하여, 적격 바이오차 시설이 IRS(미국 국세청)에 생애주기 분석을 제출하면 현금화 가능한 인증서를 청구할 수 있도록 했습니다. 이와 병행하여, 유럽연합 집행위원회의 ‘탄소 제거 인증 프레임워크’에서는 바이오차에 특화된 정량화 규정이 마련되어, 이를 통해 지속가능성 증명이 표준화됨으로써 기관 투자자의 자본 유치가 기대됩니다. 워싱턴주를 비롯한 미국의 몇몇 주에서는 개정된 대기오염방지 조례에 따라 화염억제식 가마의 사용이 합법화되어, 원료의 운송 거리를 단축하는 분산형 생산 모델의 길이 열렸습니다. 이러한 인센티브는 규정 준수 위험을 줄이고 부채 상환 배율을 개선함으로써 민간 투자자들을 대규모 프로젝트로 유도하고 있습니다.
높은 생산 비용과 물류 비용
원료, 전처리, 열변환 각 공정이 각각 막대한 비용 요인이 되기 때문에 단위당 경제성은 여전히 과제로 남아 있습니다. 학술적인 비용 곡선에 따르면, 수분 함량, 플랜트 규모, 지역의 에너지 요금에 따라 전체 비용을 포함한 생산 비용은 1톤당 106-170달러로 추정됩니다. 부피 밀도가 낮기 때문에 40피트 컨테이너에는 합성 비료에 비해 훨씬 적은 양의 바이오차만 적재할 수 있어, 장거리 운송 경로에서 톤당 운임 비용이 증가하게 됩니다. 생산자는 원료 산지를 따라 이동하는 이동식 열분해 설비를 도입하거나, 물류 효율을 높이기 위해 철도와 연계된 허브를 건설하는 것 중 하나를 선택해야 하지만, 어느 전략이든 막대한 설비 투자가 필요하여 소규모 사업자들은 자금 조달에 어려움을 겪고 있습니다. 자동화된 고처리 능력의 공장이 보급되기 전까지는 규모의 경제 효과가 서서히만 나타날 것입니다.
부문 분석
2025년 시점에서 저속 및 중속 열분해 시스템은 안정적인 처리 능력, 유연한 원료 대응 범위, 그리고 바이오 오일 및 합성 가스를 포함한 제품별 라인업을 통해 바이오차 시장 점유율의 44.72%를 차지했습니다. 이러한 특성 덕분에 사업자는 핵심 사업인 바이오차 판매 외에도 전력 및 열 판매를 통해 수익을 창출함으로써 프로젝트 전체의 내부수익률(IRR)을 높일 수 있습니다. 자본 집약적인 로터리 킬른 방식은 대규모 설비에서 주류를 이루고 있지만, 소규모 레토르트 장치는 재생형 농업을 목적으로 하는 농장 내 프로그램에 활용되고 있습니다. 연속 공급형 반응 장치의 보급 확대에 따라 공정 제어 능력이 개선되고 수율의 안정성이 높아졌으며, 배출 가스 관리가 더욱 엄격해졌습니다. 이 점은 대기 질에 민감한 지역에서의 인허가 절차를 간소화하는 요인이 되고 있습니다.
수분 함량이 높은 원료를 비용이 많이 드는 예비 건조 과정 없이 처리할 수 있기 때문에 대체 공법에 대한 관심이 높아지고 있습니다. 수열 탄화는 180-260°C에서 수행되며, 하수 슬러지를 토양 개량 및 에너지 용도에 적합한 탄소 함량이 높은 하이드로챠일로 변환합니다. 가스화 시스템은 숯 수율이 낮은 편이지만, 열전병급 모듈과의 통합이 용이하여, 지자체 폐기물 처리 담당자는 폐기물을 베이스로드 전력 및 숯 제품으로 각각 전환할 수 있게 됩니다. 일본과 독일의 연구개발 컨소시엄은 에너지 효율 향상과 체류 시간 단축이 기대되는 마이크로파 보조 열분해의 시범 시험을 진행 중이며, 이러한 혁신 기술을 통해 기존 열화학적 처리법과의 비용 격차를 줄일 가능성이 있습니다. 예측 기간 동안 이러한 신흥 시스템은 연평균 성장률(CAGR) 24.63%를 나타낼 것으로 예측되며, 열분해의 지배적 지위는 점차 약화되겠지만 새로운 원료 유형가 시장에 진입함에 따라 바이오차 시장 규모 전체는 확대될 것으로 전망됩니다.
2025년에는 신뢰성이 높은 임업 잔재물, 균일한 입자 크기, 그리고 예측 가능한 품질의 숯을 생산하는 화학 조성 덕분에 목질 바이오매스가 전체의 61.15%를 차지했습니다. 브리티시컬럼비아주나 스칸디나비아 반도 등 목재 자원이 풍부한 지역에서는 산불 위험을 줄이기 위한 전용 간벌 프로그램이 시행되고 있어, 바이오차 공장이 다년 계약으로 확보할 수 있는 저가치 잔여물이 지속적으로 공급되고 있습니다. 침엽수 유래 원료에 포함된 높은 리그닌 함량은 고정 탄소율을 높입니다. 이 지표는 탄소 크레딧 감사관이 지속가능성 산정 시 중시하는 요소입니다.
옥수수 줄기와 잎, 벼 껍질, 사탕수수 바가스 등이 상업적 공급 계약의 대상이 됨에 따라 경쟁 구도는 변화하고 있습니다. 이동식 열분해 및 열처리 장치를 통해 비용이 많이 드는 베일 운송을 피하고, 발생 현장에서 흩어진 잔여물을 직접 처리하는 물류상의 실현 가능성이 입증되었습니다. 폐기물 소각 금지 및 매립세로 인해 자원화가 경제적으로 유리해짐에 따라, 농업 잔여물 시장 규모는 2031년까지 연평균 성장률(CAGR) 25.05%로 확대될 것으로 예측됩니다. 하수 슬러지와 가축 분뇨는 영양분이 풍부한 최종 제품을 제공하지만, 유럽의 비료 규제 하에서 더욱 엄격한 오염 물질 기준을 충족해야 합니다. 브라질과 인도의 대도시권에서는 하수 처리, 재생에너지, 바이오차 크레딧 판매를 결합한 민관 파트너십이 모색되고 있으며, 이는 바이오차 시장 전체에서 원료 포트폴리오가 궁극적으로 확대될 것임을 시사합니다.
지역별 분석
아시아태평양은 2025년에 전 세계 출하량의 39.88%를 차지했습니다. 이는 풍부한 바이오매스 자원 기반, 새로 설정된 탄소 제거 목표, 그리고 넉넉한 공공 연구개발(R&D) 자금을 반영한 것입니다. 중국에서만 매년 200건 이상의 동료 심사를 거친 바이오차 관련 논문이 발표되고 있으며, 이는 반응기 설계, 농업학적 시험 및 탄소 크레딧 프로토콜 개발 분야에서 중국의 리더십을 뒷받침합니다. 성(省) 차원의 보조금 덕분에 농촌 지역의 열분해 설비 자본 비용이 절감되어, 소규모 지자체에서도 작물 잔여물을 국가의 토양 재생 목표를 충족하는 제품으로 전환할 수 있게 되었습니다.
북미는 생산량 면에서는 2위이지만, 상업적인 탄소 크레딧 거래에서는 1위를 차지하고 있습니다. 마이크로소프트가 태평양 연안 북서부 시설에서 수년에 걸쳐 95,000 tCO2e를 조달하는 등 주목할 만한 기업용 구매 계약을 통해 예측 가능한 수익원이 확보되어, 부채를 통한 자금 조달의 위험이 경감되고 있습니다. 생산 세액 공제부터 미국 농무부(USDA)의 비용 분담 보조금에 이르기까지 연방 정부의 인센티브는 플랜트 수준의 투자를 더욱 촉진하고 있습니다. 이 지역의 성숙한 규제 체계가 도입을 가속화하고 있지만, 선행 기업들이 이미 쉽게 입수 가능한 원료의 대부분을 확보하고 있기 때문에 신흥 아시아 국가들에 비해 성장률은 완만할 것으로 보입니다.
유럽에서는 품질 기준과 정책의 일관성이 중시되고 있습니다. 탄소 제거 검증을 규정하는 EU 규정안은 회원국들에게 조사 방법의 통일을 촉구하며, 제거 크레딧의 국경 간 거래를 촉진하고 있습니다. 엄격한 국내 순제로 달성 기한에 직면한 스칸디나비아 국가들은 폐목재의 열분해를 통해 열 에너지와 고탄소 바이오차을 모두 공급하는 지역 난방 시스템과의 연계를 시범적으로 도입하고 있습니다. 한편, 라틴아메리카와 사하라 이남 아프리카에서는 풍부한 농업 잔여물을 바탕으로 한 장기적인 성장 여력이 있음에도 불구하고, 자금 조달 및 인프라 측면에서 뒤처져 있습니다. 개발 금융 기관들은 이러한 신흥 시장을 개척하고, 2028년 이후 세계 바이오차 시장에 상당한 생산량 증가를 가져올 가능성이 있는 혼합 자본 펀드의 시범 운영을 진행하고 있습니다.
기타 혜택 :
- 엑셀 형식 시장 예측(ME) 시트
- 3개월간의 애널리스트 지원
자주 묻는 질문
목차
제1장 서론
제2장 조사 방법
제3장 주요 요약
제4장 시장 구도
제5장 시장 규모 및 성장 예측
제6장 경쟁 구도
제7장 시장 기회 및 향후 전망
AJY 26.09.11According to Mordor Intelligence, biochar market size in 2026 is estimated at 0.88 Million tons, growing from 2025 value of 0.71 Million tons with 2031 projections showing 2.59 Million tons, growing at 24.11% CAGR over 2026-2031.
This report is Segmented by Technology (Pyrolysis, Gasification Systems, and More), Feedstock (Woody Biomass, Agricultural Residues, and More), Form (Powder, Pellets/Granules, and Liquid Suspension), Application (Agriculture, Animal Farming, and More), and Geography (Asia-Pacific, North America, Europe, South America, and Middle East and Africa). The Market Forecasts are Provided in Terms of Volume (Tons).
Global Biochar Market Trends and Insights
Rising Demand from Organic and Regenerative Farming
Organic farmers are replacing synthetic inputs with biochar as they chase higher soil-organic-carbon scores required for premium certification. Twenty US states have already activated the NRCS Soil Carbon Amendment 808 standard, which reimburses growers for verified biochar applications. Yield trials show first-year productivity gains near 9% and cumulative boosts that exceed 20% after six seasons, especially in nutrient-poor soils. Biochar qualifies for use in USDA-certified organic systems when sourced from untreated biomass, a rule that removes a major market barrier and supports premium pricing. The cascading-use concept-deploying biochar first in filtration or livestock bedding and later reincorporating it into fields-multiplies income streams and aligns with circular-economy mandates. As input prices remain volatile, growers view biochar as a hedge that locks in stable nutrient supply and long-term carbon credits.
Government Incentives for Negative-Carbon Materials and Waste Valorization
Policy levers are accelerating demand. The Inflation Reduction Act broadened Section 45Q and 45V tax credits to include carbon-utilisation pathways, letting qualified biochar facilities claim monetisable certificates once lifecycle analyses are filed with the IRS. In parallel, the European Commission's Carbon Removal Certification Framework is drafting biochar-specific quantification rules that should standardise permanence proofs and attract institutional capital. Several US states, notably Washington, have legalised flame-cap kilns under updated clean-air codes, clearing the way for distributed production models that shorten feedstock haulage. These incentives lower compliance risk and improve debt-service coverage ratios, nudging private investors toward large-scale projects.
High Production and Logistics Costs
Unit economics remain challenging because feedstock, preprocessing, and thermal conversion each add sizeable cost blocks. Academic cost curves place fully-loaded production between USD 106 and USD 170 per ton depending on moisture content, plant scale, and regional energy tariffs. Low bulk density means a 40-foot container carries far fewer tonnes of biochar than of synthetic fertiliser, inflating per-tonne freight costs on long-haul routes. Producers either adopt mobile pyrolysis units that follow feedstock sources or build rail-linked hubs to capture logistics efficiencies, yet both strategies demand capital outlays that small operators struggle to finance. Until automated, high-throughput plants gain traction, scale economies will arrive slowly.
Other drivers and restraints analyzed in the detailed report include:
- Carbon-Credit Monetisation for Soil Sequestration Projects
- Expanding Horticulture and Greenhouse Adoption
- Availability of Low-Cost Substitutes
For complete list of drivers and restraints, kindly check the Table Of Contents.
Segment Analysis
Slow and intermediate pyrolysis systems held 44.72% of biochar market share in 2025 thanks to reliable throughput, flexible feedstock windows, and a coproduct slate that includes bio-oil and syngas. These attributes let operators layer electricity or heat revenue onto core biochar sales, raising overall project internal-rate-of-return figures. Capital-intensive rotary-kiln designs dominate high-volume installations, while smaller retort units serve on-farm programmes that target regenerative agriculture. The wider diffusion of continuous-feed reactors has triggered process-control improvements, enabling better yield consistency and tighter emissions control, an aspect that simplifies permitting in air-quality-sensitive regions.
Alternative routes are gaining mindshare because they process high-moisture substrates without costly pre-drying. Hydrothermal carbonisation runs at 180-260 °C and converts sewage sludge into carbon-rich hydrochar suitable for soil amendment or energy applications. Gasification systems, though producing lower char yields, integrate readily with combined-heat-and-power modules, allowing municipal waste managers to transform refuse into baseload electricity and char by-products. R&D consortia in Japan and Germany are piloting microwave-assisted pyrolysis that promises higher energy efficiency and reduced residence times, innovations that could narrow cost gaps against incumbent thermochemical options. Over the forecast window, these emerging systems are anticipated to grow at a 24.63% CAGR, gradually diluting pyrolysis dominance yet collectively lifting the biochar market size as new feedstock classes come online.
Woody biomass provided 61.15% of total volume in 2025 due to reliable forestry residues, uniform particle sizes, and chemical compositions that yield predictable char quality. Timber-rich geographies such as British Columbia and Scandinavia run dedicated thinning programmes to mitigate wildfire risk, generating a continuous stream of low-value residues that biochar plants can secure on multi-year contracts. High lignin content in conifer fractions also enhances fixed-carbon percentages, a metric prized by carbon-credit auditors for permanence calculations.
The competitive landscape is shifting as corn stover, rice husks, and sugarcane bagasse enter commercial supply agreements. Mobile torrefaction and pyrolysis rigs have demonstrated the logistical viability of converting loose residues where they are generated, bypassing costly bale transport. Agricultural residues are forecast to expand at 25.05% CAGR to 2031, helped by waste-burn bans and landfill taxes that tilt economics toward valorisation. Sewage sludge and animal manure offer nutrient-enriched end-products but must clear tighter contaminant hurdles under European fertiliser regulations. Large urban centres in Brazil and India are exploring public-private partnerships that marry wastewater treatment, renewable power, and biochar credit sales, pointing to an eventual broadening of feedstock portfolios across the biochar market.
Complete Report Scope:
- By Technology
- Pyrolysis
- Gasification Systems
- Other Technologies (Hydrothermal Carbonization)
- By Feedstock
- Woody Biomass
- Agricultural Residues
- Animal Manure
- Sewage Sludge and Organic Waste
- By Form
- Powder
- Pellets/Granules
- Liquid Suspension
- By Application
- Agriculture
- Animal Farming
- Industrial Uses
- Other Applications (Construction Materials, Energy, etc.)
- By Geography
- Asia-Pacific
- China
- Japan
- India
- South Korea
- ASEAN Countries
- Rest of Asia-Pacific
- North America
- United States
- Canada
- Mexico
- Europe
- Germany
- United Kingdom
- France
- Italy
- Spain
- Russia
- NORDIC Countries
- Rest of Europe
- South America
- Brazil
- Argentina
- Rest of South America
- Middle East and Africa
- Saudi Arabia
- South Africa
- Rest of Middle East and Africa
- Asia-Pacific
Geography Analysis
Asia-Pacific captured 39.88% of global shipments in 2025, reflecting an abundant biomass resource base, emerging carbon-removal targets, and generous public R&D funding. China alone publishes over 200 peer-reviewed biochar papers each year, underpinning its leadership in reactor design, agronomic testing, and carbon-credit protocol development. Provincial subsidies lower the capital cost of rural pyrolysis units, enabling small municipalities to turn crop residues into products that meet national soil-restoration goals.
North America ranks second in volume but leads in commercial carbon-credit transactions. High-profile corporate offtake agreements, including Microsoft's multi-year procurement of 95,000 tCO2e from Pacific-Northwest facilities, provide predictable revenue tails that derisk debt financing. Federal incentives-ranging from production tax credits to USDA cost-share grants-further catalyse plant-level investment. Although the region's mature regulatory framework accelerates deployment, growth rates will moderate compared with emerging Asia because early movers have already secured a large share of easily accessible feedstocks.
Europe clusters around quality standards and policy alignment. Draft EU rules governing carbon-removal verification encourage member states to harmonise methodologies, facilitating cross-border trade in removal credits. Scandinavian countries, confronted with stringent national net-zero deadlines, are testing district-heating link-ups where waste-wood pyrolysis supplies both thermal energy and high-carbon biochar. Meanwhile, Latin America and Sub-Saharan Africa present long-term upside tied to abundant agricultural residues yet lag on financing and infrastructure. Development-finance institutions are piloting blended-capital funds that could unlock these frontier markets, potentially adding significant incremental tonnage to the global biochar market after 2028.
- Airex Energy
- Applied Carbon
- Arsta Eco
- Biochar Now LLC
- BIOSORRA
- Black Owl Biochar.
- Carbofex Ltd.
- Carbon Gold Ltd
- CharGrow
- Karr Group
- Myno Carbon
- Pacific Biochar Benefit Corporation
- Phoenix Energy
- Pyreg GmbH
- Standard Bio AS
- Swiss Biochar GmbH
- Wakefield Biochar
- Wonjin Group
Additional Benefits:
- The market estimate (ME) sheet in Excel format
- 3 months of analyst support
TABLE OF CONTENTS
1 Introduction
- 1.1 Study Assumptions and Market Definition
- 1.2 Scope of the Study
2 Research Methodology
3 Executive Summary
4 Market Landscape
- 4.1 Market Overview
- 4.2 Market Drivers
- 4.2.1 Rising Demand from Organic and Regenerative Farming
- 4.2.2 Government Incentives for Negative-Carbon Materials and Waste Valorization
- 4.2.3 Carbon-Credit Monetisation for Soil Sequestration Projects
- 4.2.4 Expanding Horticulture and Greenhouse Adoption
- 4.2.5 Biochar-Enhanced Asphalt and Concrete for Green Construction
- 4.3 Market Restraints
- 4.3.1 High Production and Logistics Costs
- 4.3.2 Availability of Low-Cost Substitutes
- 4.3.3 Regulatory Ambiguity on Fertiliser Registration
- 4.4 Value Chain Analysis
- 4.5 Porter's Five Forces
- 4.5.1 Bargaining Power of Suppliers
- 4.5.2 Bargaining Power of Buyers
- 4.5.3 Threat of New Entrants
- 4.5.4 Threat of Substitutes
- 4.5.5 Degree of Competition
5 Market Size and Growth Forecasts (Volume)
- 5.1 By Technology
- 5.1.1 Pyrolysis
- 5.1.2 Gasification Systems
- 5.1.3 Other Technologies (Hydrothermal Carbonization)
- 5.2 By Feedstock
- 5.2.1 Woody Biomass
- 5.2.2 Agricultural Residues
- 5.2.3 Animal Manure
- 5.2.4 Sewage Sludge and Organic Waste
- 5.3 By Form
- 5.3.1 Powder
- 5.3.2 Pellets/Granules
- 5.3.3 Liquid Suspension
- 5.4 By Application
- 5.4.1 Agriculture
- 5.4.2 Animal Farming
- 5.4.3 Industrial Uses
- 5.4.4 Other Applications (Construction Materials, Energy, etc.)
- 5.5 By Geography
- 5.5.1 Asia-Pacific
- 5.5.1.1 China
- 5.5.1.2 Japan
- 5.5.1.3 India
- 5.5.1.4 South Korea
- 5.5.1.5 ASEAN Countries
- 5.5.1.6 Rest of Asia-Pacific
- 5.5.2 North America
- 5.5.2.1 United States
- 5.5.2.2 Canada
- 5.5.2.3 Mexico
- 5.5.3 Europe
- 5.5.3.1 Germany
- 5.5.3.2 United Kingdom
- 5.5.3.3 France
- 5.5.3.4 Italy
- 5.5.3.5 Spain
- 5.5.3.6 Russia
- 5.5.3.7 NORDIC Countries
- 5.5.3.8 Rest of Europe
- 5.5.4 South America
- 5.5.4.1 Brazil
- 5.5.4.2 Argentina
- 5.5.4.3 Rest of South America
- 5.5.5 Middle East and Africa
- 5.5.5.1 Saudi Arabia
- 5.5.5.2 South Africa
- 5.5.5.3 Rest of Middle East and Africa
- 5.5.1 Asia-Pacific
6 Competitive Landscape
- 6.1 Market Concentration
- 6.2 Strategic Moves
- 6.3 Market Share(%)/Ranking Analysis
- 6.4 Company Profiles {(includes Global level Overview, Market level overview, Core Segments, Financials as available, Strategic Information, Market Rank/Share for key companies, Products and Services, and Recent Developments)}
- 6.4.1 Airex Energy
- 6.4.2 Applied Carbon
- 6.4.3 Arsta Eco
- 6.4.4 Biochar Now LLC
- 6.4.5 BIOSORRA
- 6.4.6 Black Owl Biochar.
- 6.4.7 Carbofex Ltd.
- 6.4.8 Carbon Gold Ltd
- 6.4.9 CharGrow
- 6.4.10 Karr Group
- 6.4.11 Myno Carbon
- 6.4.12 Pacific Biochar Benefit Corporation
- 6.4.13 Phoenix Energy
- 6.4.14 Pyreg GmbH
- 6.4.15 Standard Bio AS
- 6.4.16 Swiss Biochar GmbH
- 6.4.17 Wakefield Biochar
- 6.4.18 Wonjin Group
7 Market Opportunities and Future Outlook
- 7.1 White-space and Unmet-Need Assessment