|
시장보고서
상품코드
2124109
광센서 시장 : 점유율 분석, 업계 동향과 통계, 성장 예측(2026-2031년)Light Sensors - Market Share Analysis, Industry Trends & Statistics, Growth Forecasts (2026 - 2031) |
||||||
 Mordor Intelligence
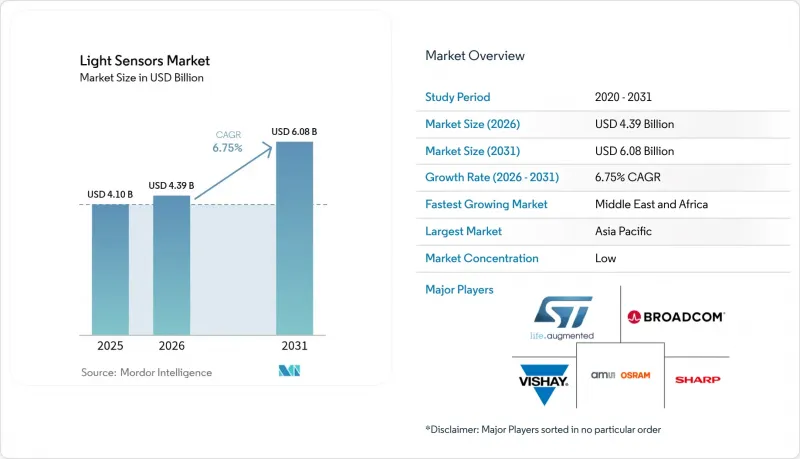
Mordor Intelligence에 의하면, 2026년 광센서 시장 규모는 43억 9,000만 달러로 추정되고 있어 2025년 41억 달러에서 확대되어, 2031년에는 60억 8,000만 달러에 이를 것으로 예측됩니다. 2026년부터 2031년까지 CAGR 6.75%로 성장할 전망입니다.
본 보고서는 기능별(환경광, 근접, RGB 컬러, 제스처 인식, UV, IR), 출력별(디지털, 아날로그), 기술별(CMOS, CCD/포토 IC, 포토다이오드, MEMS),스펙트럼별(가시광선, 적외선, UV), 집적도별(디스크리트, 콤보), 용도별(소비자 가전, 자동차, 산업용, 스마트 홈, 헬스케어) 및 지역별로 분류되어 있습니다. 시장 예측은 금액(달러) 기준으로 제시되어 있습니다.
전 세계 광센서 시장 동향 및 인사이트
OLED 스마트폰에서 주변광·근접 센서의 통합 가속화(아시아)
디스플레이 뒷면의 센싱 기술을 통해 스마트폰 제조업체는 자동 밝기 조절 및 근접 감지 기능을 저해하지 않으면서 전면 패널의 노치(notch)를 제거할 수 있게 되었습니다. ams-OSRAM의 TCS3701은 OLED 픽셀을 통해 주변광을 측정하는 센서로, 2024년에 양산을 시작하여 중국 및 한국의 주요 OEM 제조업체들에 의해 빠르게 채택되었습니다. 이러한 대규모 채택으로 인해 초슬림 광학 스택에 대한 공급망 투자가 가속화되면서, 스마트폰 기술 분야에서 아시아의 리더십이 더욱 공고해지고 있습니다.
주간 주행등 및 어댑티브 헤드램프 규제가 센서 수요를 견인(유럽)
유럽의 자동차 조명 규제로 인해 자동차 제조업체들이 어댑티브 헤드램프 시스템에 관한 ECE 및 NHTSA 기준을 준수함에 따라, 첨단 광센서에 대한 지속적인 수요가 발생하고 있습니다. 유엔 ECE 규정 제48호는 빔 패턴과 조도 수준을 최적화하기 위해 주변광을 지속적으로 모니터링해야 하는 특정 조명 기능을 의무화하고 있습니다. 이러한 규제 프레임워크로 인해 자동차 부품 공급업체들은 여러 유형의 센서를 단일 모듈로 통합해야 하는 압박을 받고 있으며, 주변광 감지, 근접 감지 및 스펙트럼 분석 기능을 결합한 통합 솔루션을 제공할 수 있는 기업들에게는 새로운 비즈니스 기회가 열리고 있습니다. 규제가 적응형 기능을 중시하고 있기 때문에 자동차 신뢰성 기준을 충족하면서 여러 조명 조건을 동시에 처리할 수 있는 CMOS 집적형 센서를 제공하는 공급업체가 특히 혜택을 보고 있습니다. 유럽의 각 OEM 업체들은 전체 모델 라인에 걸쳐 센서 사양을 표준화함으로써 이에 대응하고 있으며, AEC-Q100 등급 2 인증 요건을 충족할 수 있는 공급업체에게는 대량 수주 기회가 생기고 있습니다.
저조도 차량 실내 환경에서 포토다이오드의 선형성 한계
저조도 차량 실내 환경에서 포토다이오드의 성능 저하는 첨단 조명 시스템에서 정확한 주변광 측정이 필수적인 고급차 용도에서 센서의 정확도를 제한하는 기술적 제약으로 대두되고 있습니다. 조사에 따르면, 기존의 실리콘 포토다이오드는 10럭스 이하에서 비선형적인 응답 특성을 보이며, 측정 오차가 발생함으로써 어댑티브 헤드라이트의 성능이나 차량 내부 조명의 최적화가 저해된다는 사실이 밝혀졌습니다. 이러한 제약으로 인해 자동차 부품 공급업체들은 차량 용도에 필요한 전체 동적 범위에서 정확도를 유지하기 위해 복잡한 보정 알고리즘이나 멀티 센서 아키텍처를 도입할 수밖에 없습니다. 이러한 제약은 특히 고객이 매끄러운 조명 전환과 정밀한 색온도 제어를 기대하는 고급차 부문에 영향을 미치고 있으며, 일관된 저조도 성능을 제공하지 못하는 센서 제조업체에게는 차별화를 꾀하는 데 있어 과제가 되고 있습니다.
부문 분석
2025년에는 환경 광센서가 매출의 34.50%를 차지하며, 백라이트 밝기 조절 및 에너지 관리 분야에서 그 보급이 확대되었음을 입증했습니다. 한편, 제스처 센서는 의료 분야 및 프리미엄 소비자용 기기에서의 터치리스 제어를 배경으로 연평균 성장률(CAGR) 13.50%로 확대되고 있습니다. 제스처 모듈용 광센서 시장 규모는 아날로그 디바이스의 CN0569와 같은 2축 설계에 힘입어 2031년까지 11억 8,000만 달러에 달할 것으로 예측됩니다. 병원에서는 비접촉형 인터페이스가 선호되며, 자동차 제조업체들은 대시보드에 손 흔들기 제어 기능을 추가하고 있습니다. 이와 동시에 근접 센서와 RGB 센서는 이어폰 착용 감지 및 카메라 화이트 밸런스 조정에서 필수적이며, 다양한 수요 흐름을 확보하고 있습니다.
각 공급업체는 기판 면적을 절약하기 위해 제스처, 주변광, 근접 감지 기능을 단일 다이에 통합하고 있습니다. 이러한 복합 설계로 인해 조달 형태는 다기능 계약으로 전환되고 있으며, 이로 인해 전환 비용이 증가하고 브랜드 충성도가 강화되고 있습니다. 정밀 농업 분야에서는 PAR(광합성 유효 복사) 추적을 위한 UV 센서 수요가 증가하고 있는 반면, 멀티 스펙트럼 감지기는 결함 감지 및 조직 특성 평가에서 높은 평균 판매 가격(ASP)이 요구되는 고급 산업용 및 의료용 틈새 시장을 공략하고 있습니다. 광센서 시장에서는 대량 생산되는 환경광 제품과 전문성이 높은 제스처 및 스펙트럼 디바이스 간의 균형을 잘 맞추고 있는 기업들이 계속해서 혜택을 보고 있습니다.
디지털 출력 장치는 2025년에 매출의 59.40%를 차지하며, 2031년까지 연평균 성장률(CAGR) 9.10%를 기록할 전망입니다. 스마트폰 OEM 업체들은 부품 수(BOM) 감축에 필수적인 요소로서 직접 I2C 또는 SPI 연결을 중시하고 있습니다. 고도의 온칩 ADC 및 히스토그램 엔진 덕분에 디지털에 대한 선호도는 더욱 강해지고 있습니다. 아날로그 디바이스는 브레이크등 전환 등 시간이 중요한 분야나 안전 관련 분야에서 여전히 사용되고 있지만, 저지연 디지털 파이프라인이 등장함에 따라 그 격차는 점차 좁혀지고 있습니다.
시스템 통합사업자들은 디지털 부품이 제공하는 보정된 럭스 출력 및 내장된 플리커 감지 기능을 높이 평가했습니다. 이러한 특성 덕분에 특성 평가 작업이 실리콘 공급업체 측의 업스트림 공정으로 이관되므로 조달이 간소화됩니다. 한편, 아날로그 부품은 중장비나 레거시 PLC 환경에서 여전히 일정한 입지를 유지하고 있습니다. 공급업체 간의 차별화는 포토다이오드의 순수한 성능보다는 내장형 인텔리전스(노이즈 필터링 및 자동 이득 제어)에 점점 더 중점을 두고 있습니다.
지역별 분석
아시아태평양은 중국의 스마트폰 조립 활성화, 대만의 반도체 분야 주도적 지위, 그리고 한국의 전기차 생산 급증에 힘입어 2025년에는 매출의 40.10%를 차지했습니다. 대만은 전 세계 반도체의 63.8%를 생산하고 있으며, 이를 통해 이 지역의 벤더들은 최첨단 5nm 및 3nm 공정 노드에 근접한 환경을 확보하고 있습니다(taiwanembassy.org). 중국공급업체들은 정부의 우대 조치를 활용하여 중가대 환경 센서 시장에 진출하고 있으며, 기존 브랜드에 가격 면에서 압박을 가하고 있습니다.
북미의 성장 전망은 자동차 제조업체들이 전동화 및 레벨 3 자율주행에 대응하기 위해 공장 설비 현대화를 추진함에 따라 밝아지고 있습니다. 미국의 ‘CHIPS and Science Act’는 국내 파운드리 업체에 527억 달러를 배정하고 있으며, 이로 인해 센서의 리드타임이 단축될 가능성이 있습니다(commerce.gov). 1차 공급업체들은 현지 조달 요건을 충족하기 위해 디트로이트나 오스틴 근처에 위성 설계 센터를 개설하고 있습니다.
유럽은 여전히 규제 주도형 시장이며, 엄격한 조명 및 안전 기준 덕분에 센서에 대한 안정적인 수요가 확보되고 있지만, 웨이퍼 제조 공장 부족으로 인해 지역 내 공급은 제한되고 있습니다. 430억 유로 규모의 ‘유럽 칩 법(European Chips Act)’은 2030년까지 해당 지역의 반도체 점유율을 20%로 두 배로 늘리는 것을 목표로 하고 있습니다(ec.europa.eu). 한편, 중동의 스마트 시티 구상은 그린 빌딩 프로젝트 내에서 UV/IR 감지기에 대한 국지적인 수요를 창출하고 있습니다. 북유럽의 수직 농장도 UV-PAR 센서의 보급을 뒷받침하고 있으며, 틈새 시장이라 할지라도 전문 분야에서는 그 규모 이상의 영향력을 발휘할 수 있음이 입증되었습니다.
기타 혜택:
- 엑셀 형식 시장 예측(ME) 시트
- 3개월간의 애널리스트 지원
자주 묻는 질문
목차
제1장 서론
제2장 조사 방법
제3장 주요 요약
제4장 시장 구도
제5장 시장 규모와 성장 예측
제6장 경쟁 구도
제7장 시장 기회와 향후 전망
JHS 26.09.07According to Mordor Intelligence, the light sensor market size in 2026 is estimated at USD 4.39 billion, growing from 2025 value of USD 4.1 billion with 2031 projections showing USD 6.08 billion, growing at 6.75% CAGR over 2026-2031.
This report is Segmented by Function (Ambient Light, Proximity, RGB Color, Gesture Recognition, UV, IR), Output (Digital, Analog), Technology (CMOS, CCD/Photo-IC, Photodiodes, MEMS), Spectrum (Visible, Infrared, UV), Integration (Discrete, Combo), End-Use (Consumer Electronics, Automotive, Industrial, Smart Home, Healthcare), and Geography. The Market Forecasts are Provided in Terms of Value (USD).
Global Light Sensors Market Trends and Insights
Accelerating Integration of Ambient & Proximity Sensors in OLED Smartphones (Asia)
Behind-display sensing allows phone makers to remove front-panel cut-outs without sacrificing auto-brightness or proximity features. ams-OSRAM's TCS3701 measures ambient light through OLED pixels and entered mass production in 2024, quickly adopted by leading Chinese and Korean OEMs. Volume adoption accelerates supply-chain investments in ultra-thin optical stacks, reinforcing Asia's leadership in smartphone engineering.
Mandatory Daylight-Running & Adaptive Headlamp Regulations Boosting Sensor Demand (Europe)
European automotive lighting regulations have created sustained demand for sophisticated light sensors as vehicle manufacturers comply with ECE and NHTSA standards for adaptive headlamp systems. The UN ECE Regulation No. 48 mandates specific lighting functions that require continuous ambient light monitoring to optimize beam patterns and intensity levels. This regulatory framework has driven automotive suppliers to integrate multiple sensor types within single modules, creating opportunities for companies that can deliver integrated solutions combining ambient light detection, proximity sensing, and spectral analysis capabilities. The regulations' emphasis on adaptive functionality has particularly benefited suppliers offering CMOS-integrated sensors that can process multiple light conditions simultaneously while meeting automotive reliability standards. European OEMs have responded by standardizing sensor specifications across model lines, creating volume opportunities for suppliers capable of meeting AEC-Q100 Grade 2 qualification requirements.
Photodiode Linearity Limits Under Low-Illuminance Automotive Cabins
Photodiode performance degradation in low-illuminance automotive environments has emerged as a technical constraint limiting sensor accuracy in premium vehicle applications where precise ambient light measurement is critical for advanced lighting systems. Research demonstrates that conventional silicon photodiodes exhibit non-linear response characteristics below 10 lux, creating measurement errors that compromise adaptive headlamp performance and interior lighting optimization. This limitation has forced automotive suppliers to implement complex calibration algorithms and multi-sensor architectures to maintain accuracy across the full dynamic range required for vehicle applications. The constraint particularly affects luxury vehicle segments where customers expect seamless lighting transitions and precise color temperature control, creating differentiation challenges for sensor manufacturers unable to deliver consistent low-light performance.
Other drivers and restraints analyzed in the detailed report include:
- ADAS-Driven Camera & LiDAR Light Sensor Uptake (North America)
- Smart Lighting Codes Driving UV/IR Sensors in Commercial Buildings (Middle East)
- Severe Price Erosion from White-Label Chinese Vendors
For complete list of drivers and restraints, kindly check the Table Of Contents.
Segment Analysis
Ambient detectors retained 34.50% revenue in 2025, confirming their ubiquity in back-light dimming and energy management. Gesture sensors, however, are scaling at 13.50% CAGR on the back of touchless control in healthcare and premium consumer devices. The light sensor market size for gesture modules is projected to reach USD 1.18 billion by 2031, underpinned by dual-axis designs such as Analog Devices' CN0569. Hospitals prefer contact-free interfaces, and carmakers are adding hand-wave controls to dashboards. In parallel, proximity and RGB sensors remain indispensable for ear-in detection and camera white-balance, ensuring diversified demand streams.
Suppliers combine gesture, ambient, and proximity functions into single die to save board area. This combo design reshapes procurement toward multi-function contracts, boosting switching costs and reinforcing brand loyalty. Precision agriculture fuels UV sensors for PAR tracking, while multispectral detectors capture premium industrial and medical niches where defect detection or tissue characterization commands high ASPs. The light sensor market continues to reward firms that balance high-volume ambient products with specialized gesture and spectral devices.
Digital-output devices comprised 59.40% sales in 2025 and are on course for 9.10% CAGR through 2031. Smartphone OEMs view direct I2C or SPI connectivity as essential to shrink BOM count. Advanced on-chip ADCs and histogram engines further tilt preference toward digital. Analog devices persist in time-critical or safety-related domains such as brake-light switching, yet the gap narrows as low-latency digital pipelines emerge.
System integrators prize calibrated lux outputs and built-in flicker detection that digital parts deliver. These traits simplify procurement by moving characterization tasks upstream to the silicon vendor. Conversely, analog parts keep a foothold in heavy-duty machinery and legacy PLC environments. Vendor differentiation increasingly centers on embedded intelligence-noise filtering and automatic gain-rather than raw photodiode performance.
Complete Report Scope:
- By Function
- Ambient Light Sensors
- Proximity Sensors
- RGB Color Sensors
- Gesture Recognition Sensors
- UV Light Sensors
- Infrared Light Sensors
- Multispectral and Spectral Sensors
- By Output
- Digital Output
- Analog Output
- By Technology
- CMOS Integration
- CCD/Photo-IC
- Photodiodes and Phototransistors
- MEMS-based Technologies
- By Spectrum
- Visible Light (390-700 nm)
- Infrared (Greater than 700 nm)
- Ultraviolet (Less than 390 nm)
- By Integration Level
- Stand-Alone Discrete Sensors
- Integrated Combo Sensors and Modules
- By End-use Industry
- Consumer Electronics
- Automotive and Transportation
- Industrial Automation and Robotics
- Smart Home and Building Automation
- Healthcare and Medical Devices
- Agriculture and Environmental Monitoring
- Aerospace and Defense
- Others
- By Geography
- North America
- United States
- Canada
- Mexico
- South America
- Brazil
- Argentina
- Rest of South America
- Europe
- Germany
- United Kingdom
- France
- Italy
- Spain
- Nordics (Sweden, Norway, Denmark, Finland)
- Benelux (Belgium, Netherlands, Luxembourg)
- Middle East
- Saudi Arabia
- United Arab Emirates
- Israel
- Turkey
- Africa
- South Africa
- Nigeria
- Kenya
- Rest of Africa
- Asia-Pacific
- China
- Japan
- India
- South Korea
- ASEAN (Singapore, Malaysia, Thailand, Indonesia, Philippines, Vietnam)
- North America
Geography Analysis
Asia-Pacific commanded 40.10% revenues in 2025 due to intense smartphone assembly in China, semiconductor leadership in Taiwan, and burgeoning EV production in South Korea. Taiwan produces 63.8% of global semiconductors, granting regional vendors proximity to advanced 5 nm and 3 nm nodes taiwanembassy.org. Chinese suppliers leverage government incentives to enter mid-range ambient sensor tiers, placing pricing pressure on established brands.
North America's growth outlook brightens as automakers re-tool plants for electrification and Level-3 autonomy. U.S. CHIPS and Science Act allocates USD 52.7 billion to domestic foundries, potentially shortening sensor lead times commerce.gov. Tier-1 suppliers open satellite design centers near Detroit and Austin to secure local content mandates.
Europe remains a regulation-driven market; strict lighting and safety codes ensure steady sensor pull-through, though wafer-fab scarcity limits indigenous supply. The EUR 43 billion European Chips Act aims to double the region's semiconductor share to 20% by 2030 ec.europa.eu. Meanwhile, Middle Eastern smart-city initiatives create pockets of demand for UV/IR detectors within green-building projects. Nordic vertical farms also boost UV-PAR sensor uptake, proving that niche geographies can punch above their size in specialized categories.
- ams-OSRAM AG
- Sharp Corporation
- STMicroelectronics N.V.
- Broadcom Inc.
- Vishay Intertechnology Inc.
- Analog Devices Inc. (Maxim Integrated)
- Apple Inc.
- Elan Microelectronics Corp.
- Everlight Electronics Co., Ltd.
- Samsung Electronics Co., Ltd.
- Sitronix Technology Corporation
- ROHM Co., Ltd.
- Texas Instruments Incorporated
- onsemi Corporation
- Sony Semiconductor Solutions Corporation
- Omron Corporation
- Panasonic Holdings Corporation
- Alps Alpine Co., Ltd.
- Lite-On Technology Corporation
- Melexis NV
- TE Connectivity Ltd.
- Partron Co., Ltd.
- Himax Technologies, Inc.
- Hella GmbH and Co. KGaA
- Murata Manufacturing Co., Ltd.
Additional Benefits:
- The market estimate (ME) sheet in Excel format
- 3 months of analyst support
TABLE OF CONTENTS
1 INTRODUCTION
- 1.1 Study Assumptions and Market Definition
- 1.2 Scope of the Study
2 RESEARCH METHODOLOGY
3 EXECUTIVE SUMMARY
4 MARKET LANDSCAPE
- 4.1 Market Overview
- 4.2 Market Drivers
- 4.2.1 Accelerating Integration of Ambient and Proximity Sensors in OLED Smartphones (Asia)
- 4.2.2 Mandatory Daylight-Running and Adaptive Headlamp Regulations Boosting Sensor Demand (Europe)
- 4.2.3 ADAS-Driven Camera and LiDAR Light Sensor Uptake (North America)
- 4.2.4 Smart Lighting Codes Driving UV/IR Sensors in Commercial Buildings (Middle East)
- 4.2.5 Precision Indoor Farming Requiring PAR and UV Sensors (Nordics and East Asia)
- 4.2.6 Miniaturized Low-Power CMOS Architectures Enabling Wearables and AR Devices (Global)
- 4.3 Market Restraints
- 4.3.1 Photodiode Linearity Limits Under Low-Illuminance Automotive Cabins
- 4.3.2 Severe Price Erosion from White-Label Chinese Vendors
- 4.3.3 Thermal Crosstalk in Multi-Sensor Smartphone Modules
- 4.3.4 EU Regulatory Delays on Public-Space IR Gesture Spectrum Allocation
- 4.4 Value / Supply-Chain Analysis
- 4.5 Regulatory or Technological Outlook
- 4.5.1 Global Photodiode Roadmap and Miniaturization Trends
- 4.5.2 Automotive Headlamp and Ambient Lighting Regulations (ECE, NHTSA)
- 4.6 Porter's Five Forces
- 4.6.1 Bargaining Power of Suppliers
- 4.6.2 Bargaining Power of Consumers
- 4.6.3 Threat of New Entrants
- 4.6.4 Threat of Substitutes
- 4.6.5 Intensity of Competitive Rivalry
- 4.7 Investment Analysis (Capex, VC, MandA)
5 MARKET SIZE AND GROWTH FORECASTS (VALUE)
- 5.1 By Function
- 5.1.1 Ambient Light Sensors
- 5.1.2 Proximity Sensors
- 5.1.3 RGB Color Sensors
- 5.1.4 Gesture Recognition Sensors
- 5.1.5 UV Light Sensors
- 5.1.6 Infrared Light Sensors
- 5.1.7 Multispectral and Spectral Sensors
- 5.2 By Output
- 5.2.1 Digital Output
- 5.2.2 Analog Output
- 5.3 By Technology
- 5.3.1 CMOS Integration
- 5.3.2 CCD/Photo-IC
- 5.3.3 Photodiodes and Phototransistors
- 5.3.4 MEMS-based Technologies
- 5.4 By Spectrum
- 5.4.1 Visible Light (390-700 nm)
- 5.4.2 Infrared (Greater than 700 nm)
- 5.4.3 Ultraviolet (Less than 390 nm)
- 5.5 By Integration Level
- 5.5.1 Stand-Alone Discrete Sensors
- 5.5.2 Integrated Combo Sensors and Modules
- 5.6 By End-use Industry
- 5.6.1 Consumer Electronics
- 5.6.2 Automotive and Transportation
- 5.6.3 Industrial Automation and Robotics
- 5.6.4 Smart Home and Building Automation
- 5.6.5 Healthcare and Medical Devices
- 5.6.6 Agriculture and Environmental Monitoring
- 5.6.7 Aerospace and Defense
- 5.6.8 Others
- 5.7 By Geography
- 5.7.1 North America
- 5.7.1.1 United States
- 5.7.1.2 Canada
- 5.7.1.3 Mexico
- 5.7.2 South America
- 5.7.2.1 Brazil
- 5.7.2.2 Argentina
- 5.7.2.3 Rest of South America
- 5.7.3 Europe
- 5.7.3.1 Germany
- 5.7.3.2 United Kingdom
- 5.7.3.3 France
- 5.7.3.4 Italy
- 5.7.3.5 Spain
- 5.7.3.6 Nordics (Sweden, Norway, Denmark, Finland)
- 5.7.3.7 Benelux (Belgium, Netherlands, Luxembourg)
- 5.7.4 Middle East
- 5.7.4.1 Saudi Arabia
- 5.7.4.2 United Arab Emirates
- 5.7.4.3 Israel
- 5.7.4.4 Turkey
- 5.7.5 Africa
- 5.7.5.1 South Africa
- 5.7.5.2 Nigeria
- 5.7.5.3 Kenya
- 5.7.5.4 Rest of Africa
- 5.7.6 Asia-Pacific
- 5.7.6.1 China
- 5.7.6.2 Japan
- 5.7.6.3 India
- 5.7.6.4 South Korea
- 5.7.6.5 ASEAN (Singapore, Malaysia, Thailand, Indonesia, Philippines, Vietnam)
- 5.7.1 North America
6 COMPETITIVE LANDSCAPE
- 6.1 Market Concentration
- 6.2 Strategic Moves
- 6.3 Market Share Analysis
- 6.4 Company Profiles {(includes Global level Overview, Market level overview, Core Segments, Financials as available, Strategic Information, Market Rank/Share for key companies, Products and Services, and Recent Developments)}
- 6.4.1 ams-OSRAM AG
- 6.4.2 Sharp Corporation
- 6.4.3 STMicroelectronics N.V.
- 6.4.4 Broadcom Inc.
- 6.4.5 Vishay Intertechnology Inc.
- 6.4.6 Analog Devices Inc. (Maxim Integrated)
- 6.4.7 Apple Inc.
- 6.4.8 Elan Microelectronics Corp.
- 6.4.9 Everlight Electronics Co., Ltd.
- 6.4.10 Samsung Electronics Co., Ltd.
- 6.4.11 Sitronix Technology Corporation
- 6.4.12 ROHM Co., Ltd.
- 6.4.13 Texas Instruments Incorporated
- 6.4.14 onsemi Corporation
- 6.4.15 Sony Semiconductor Solutions Corporation
- 6.4.16 Omron Corporation
- 6.4.17 Panasonic Holdings Corporation
- 6.4.18 Alps Alpine Co., Ltd.
- 6.4.19 Lite-On Technology Corporation
- 6.4.20 Melexis NV
- 6.4.21 TE Connectivity Ltd.
- 6.4.22 Partron Co., Ltd.
- 6.4.23 Himax Technologies, Inc.
- 6.4.24 Hella GmbH and Co. KGaA
- 6.4.25 Murata Manufacturing Co., Ltd.
7 MARKET OPPORTUNITIES AND FUTURE OUTLOOK
- 7.1 White-space and Unmet-Need Assessment