

|
시장보고서
상품코드
2124151
기업 성과 관리 시장 : 시장 점유율 분석, 업계 동향 및 통계, 성장 예측(2026-2031년)Enterprise Performance Management - Market Share Analysis, Industry Trends & Statistics, Growth Forecasts (2026 - 2031) |
||||||
 Mordor Intelligence
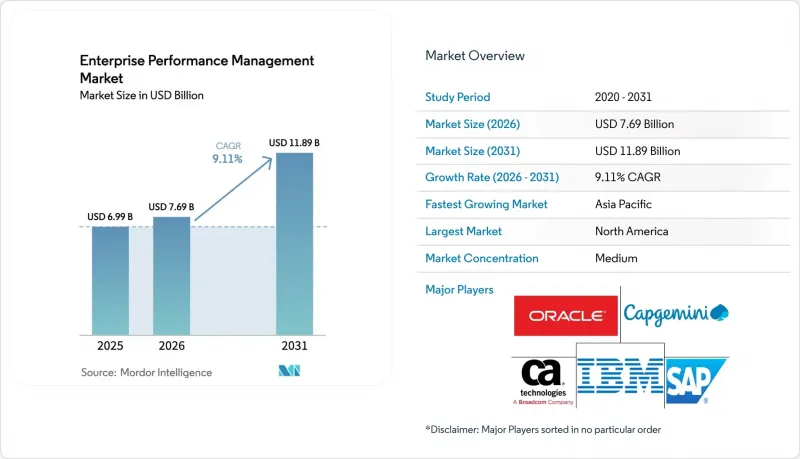
Mordor Intelligence에 의하면, 기업 성과 관리(EPM) 시장 규모는 2025년 69억 9,000만 달러로 평가되었고, 2026년 76억 9,000만 달러에서 2031년까지 118억 9,000만 달러로 확대될 전망이며, 2026-2031년 연평균 복합 성장률(CAGR)은 9.11%를 나타낼 것으로 예측됩니다.
본 보고서는 구성 요소별(솔루션 및 서비스), 도입 형태별(클라우드 및 온프레미스), 기업 규모별(중소기업 및 대기업), 최종 사용자 산업별(은행, 금융서비스 및 보험(BFSI), IT 및 통신, 의료, 제조, 소매 및 전자상거래, 에너지·유틸리티 등), 지역별로 분류되어 있습니다. 시장 예측은 금액(달러) 기준으로 제시되어 있습니다.
세계의 기업 성과 관리(EPM) 시장 동향 및 인사이트
북미 중견 기업 시장에서 실시간 FP&A(재무 계획 및 분석)를 위한 클라우드 네이티브 EPM 제품군으로의 전환
중견 기업들은 온프레미스 통합 도구를 폐지하고, 실시간 편차 분석 및 롤링 예측을 실현하는 클라우드 제품군을 도입하고 있습니다. 구독형 가격 책정으로 초기 투자가 필요 없을 뿐만 아니라, 모바일 액세스를 통해 원격 근무 형태도 지원됩니다. Oracle은 연간 매출액이 5억 달러에서 20억 달러인 기업을 대상으로 한 ‘Fusion Cloud EPM’의 수주액이 전년 대비 25% 증가했다고 보고했습니다. 워크데이는 2025년 초 기준으로 Adaptive Planning의 고객 수가 6,500개사를 넘어섰으며, 2024년 대비 30% 증가했다고 밝혔습니다. 이러한 성장은 내장된 이상 감지 모델 덕분인 것으로 분석됩니다. 자연어 쿼리 인터페이스를 통해 재무 전문가가 아닌 사용자층으로의 확산도 확대되고 있습니다.
유럽 다국적 기업의 시나리오 모델링에 AI 및 ML 통합
유럽의 제조 및 제약 기업들은 환율 변동과 공급망 혼란을 고려하기 위해 확률론적 예측을 채택하고 있습니다. 아나플랜(Anaplan)은 유럽 고객의 40%가 출시 후 12개월 이내에 ‘Predictive Insights’ 엔진을 도입했다고 밝혔습니다. IBM은 2024년 하반기에 ‘Planning Analytics’에 자동화된 ‘what-if’ 시나리오 생성 기능을 추가하여, 수천 가지의 시나리오 조합을 몇 분 만에 생성할 수 있게 했습니다. 규제 요인이 수요를 뒷받침하고 있습니다. 유럽은행감독청(EBA)의 최신 스트레스 테스트에서는 10년 단위의 기간에 걸친 기후 리스크 시뮬레이션이 요구되고 있습니다.
FP&A인력 부족이 유럽 내 고급 EPM 도입을 저해하고 있습니다.
CFO들은 드라이버 기반 모델을 구축하고 머신러닝의 결과를 해석할 수 있는 분석가를 채용하는 데 어려움을 겪고 있습니다. PwC의 2025년 인재 조사에 따르면, 유럽 재무 책임자의 58%가 FP&A 인재 부족을 상위 3대 장애물 중 하나로 꼽았습니다. 딜로이트는 사용자 교육 기간이 길어짐에 따라 프로젝트의 평균 소요 기간이 북미의 6개월에 비해 9개월로 늘어났습니다고 지적하고 있습니다. 전문 단체는 클라우드 EPM 인증 자격을 도입했으나, 인재 공급은 여전히 부족합니다.
부문 분석
2025년 매출액 중 솔루션이 71.42%를 차지했으며, 기업 성과 관리(EPM) 시장에서 주요 지출 요인이 소프트웨어 구독이라는 점이 재확인되었습니다. 한편, 서비스 부문은 연평균 성장률(CAGR) 9.89%로 더 빠르게 성장하고 있습니다. 이는 재무, 영업, 공급망 등 각 기능에 걸친 다중 모듈 도입 과정에서 변경 관리, 데이터 통합 및 교육과 관련된 전문 지식이 필요하지만, 이러한 전문 지식을 사내에 보유한 조직은 거의 없기 때문입니다. 컨설팅 기업에 따르면, 이러한 수요에 부응하기 위해 EPM 부문 인력이 35% 증가했다고 합니다.
서비스의 성장세는 월별 결산 지원 및 모델 조정을 제공하는 구독형 매니지드 서비스에 의해 뒷받침되고 있습니다. 도입 프로젝트의 평균 기간은 6-9개월이며, 기업들은 예산의 40-50%를 업무 지표와 재무 지표를 일치시키는 워크숍에 할당하고 있습니다. 생성형 AI를 활용한 코파일럿이 보급됨에 따라, 사용자 교육 패키지에 프롬프트 엔지니어링 커리큘럼이 추가되어 서비스 수익을 더욱 끌어올리고 있습니다.
2025년 도입 기반 중 클라우드 도입이 66.58%를 차지하며 연평균 성장률(CAGR) 9.57%로 확대되고 있어, 기업 성과 관리 시장이 구독형 제공 방식으로 결정적으로 전환되고 있음을 보여줍니다. API 우선 아키텍처를 통해 재무 책임자는 업무에 지장을 주는 시스템 교체를 하지 않고도 기존 ERP 코어에 베스트 오브 브리드 모듈을 중첩하여 도입할 수 있게 됩니다. 한편, 엄격한 데이터 현지화 요건이 부과되는 국방 분야나 일부 금융 부문에서는 여전히 온프레미스 도입이 지속되고 있습니다.
멀티테넌트형 클라우드의 분기별 기능 업데이트를 통해 혁신의 격차가 좁혀지고, 장기간의 업그레이드 없이도 AI 예측 및 자연어 쿼리 도구가 제공되고 있습니다. 온프레미스에서의 트랜잭션 처리와 클라우드에서의 계획 수립을 결합한 하이브리드 배포는 거주 규정이 여전히 엄격한 중국 등의 지역에서 부상하고 있습니다. 소버린 클라우드 제공은 탄력성을 희생하지 않으면서 현지 규정 준수 요건을 충족시킴으로써, 더욱 탄력을 받을 것으로 기대됩니다.
지역별 분석
북미는 2025년 매출의 41.37%를 차지했으며, 이는 클라우드의 조기 도입과 서번스-옥슬리법에 기반한 감사 관리를 반영한 것입니다. 미국의 중견 기업들은 결산 주기를 단축하기 위해 AI 기반 제품군으로 전환하고 있는 반면, 캐나다 기업들은 연방 기후 변화 정보 공개 규정을 준수하기 위해 ESG 데이터를 통합하고 있습니다. 멕시코에서 공유 서비스의 확대는 다중 통화 결산 통합 수요를 촉진하고 있습니다. 플랫폼 통합 동향은 총 소유 비용(TCO)을 절감하는 통합 제품군을 뒷받침하고 있습니다.
아시아태평양은 연평균 성장률(CAGR) 10.46%로 가장 빠르게 성장하고 있으며, 인도와 중국의 변혁 프로그램이 이를 주도하고 있습니다. 이들 국가에서는 대기업들이 다수의 자회사에 걸쳐 기획 업무를 표준화하고 있습니다. 분기별 실적 전망 공시를 의무화하는 일본의 규제 개혁으로 인해 클라우드 기반 계획 시스템 도입이 가속화되고 있습니다. 그러나 분산형 ERP 환경에서는 데이터 품질의 사일로화로 인해 도입 기간이 최대 50%까지 길어지는 사례가 나타나고 있습니다.
유럽의 동향은 ESG 보고의 표준화에 의해 형성되고 있으며, 대기업들은 탄소 배출량 지표를 법정 워크플로에 통합하고 있습니다. 중동에서는 국내에 새로운 클라우드 리전이 개설되었음에도 불구하고, 보안상의 우려로 인해 도입에 역풍을 맞고 있습니다. 한편, 라틴아메리카의 중소기업은 환율 변동 속에서 총소유비용(TCO) 문제에 직면해 있습니다. 아프리카의 초기 성장 단계에 있는 시장에서는 지역 확장을 지원하기 위해 EPM을 도입하는 남아프리카공화국 및 나이지리아의 은행들이 주도적인 역할을 하고 있습니다.
기타 혜택 :
- 엑셀 형식 시장 예측(ME) 시트
- 3개월간의 애널리스트 지원
자주 묻는 질문
목차
제1장 서론
제2장 조사 방법
제3장 주요 요약
제4장 시장 구도
제5장 시장 규모 및 성장 예측
제6장 경쟁 구도
제7장 시장 기회 및 향후 전망
AJY 26.09.09According to Mordor Intelligence, the enterprise performance management market size is projected to expand from USD 6.99 billion in 2025 and USD 7.69 billion in 2026 to USD 11.89 billion by 2031, registering a CAGR of 9.11% between 2026 to 2031.

This report is Segmented by Component (Solutions, and Services), Deployment Mode (Cloud, and On-Premise), Enterprise Size (Small and Medium Enterprises, and Large Enterprises), End-User Industry (BFSI, IT and Telecom, Healthcare, Manufacturing, Retail and E-Commerce, Energy and Utilities, and More), and Geography. The Market Forecasts are Provided in Terms of Value (USD).
Global Enterprise Performance Management Market Trends and Insights
Shift to Cloud-Native EPM Suites for Real-Time FP-and-A in Mid-Market North America
Mid-market companies are discarding on-premises consolidation tools in favour of cloud suites that deliver real-time variance analysis and rolling forecasts. Subscription pricing removes upfront capital expenditure, while mobile access supports remote work patterns. Oracle reported 25% year-over-year growth in Fusion Cloud EPM bookings for organizations with USD 500 million-USD 2 billion in annual revenue. Workday noted that its Adaptive Planning customer count exceeded 6,500 in early 2025, up 30% from 2024, attributing the expansion to embedded anomaly-detection models. Natural-language query interfaces are widening user adoption beyond finance specialists.
Integration of AI and ML for Scenario Modelling in European Multinationals
European manufacturers and pharmaceutical firms have embraced probabilistic forecasting to account for currency swings and supply-chain shocks. Anaplan disclosed that 40% of its European customers adopted the Predictive Insights engine within 12 months of launch. IBM added automated what-if generation to Planning Analytics in late 2024, enabling thousands of scenario permutations in minutes. Regulatory drivers amplify demand: updated European Banking Authority stress tests require climate-risk simulations over decade-long horizons.
Shortage of FP-and-A Talent Restricting Advanced EPM Rollouts in Europe
CFOs struggle to recruit analysts who can configure driver-based models and interpret machine-learning outputs. PwC's 2025 workforce survey indicated that 58% of European finance leaders cite FP-and-A talent shortages as a top three obstacle. Deloitte observed that average project timelines have stretched to nine months, versus six in North America, due to extended user training. Professional bodies have launched cloud-EPM certifications, yet supply remains insufficient.
Other drivers and restraints analyzed in the detailed report include:
- Convergence of EPM with ESG and Integrated Reporting Mandates in the EU
- Adoption of xP-and-A Across Global Retail Supply Chains
- Perceived Security Risks Hindering Cloud Migration in Middle East Financial Institutions
For complete list of drivers and restraints, kindly check the Table Of Contents.
Segment Analysis
Solutions accounted for 71.42% of 2025 revenue, reaffirming software subscriptions as the primary spending driver in the Enterprise Performance Management market. Services, however, are growing faster at a 9.89% CAGR because multi-module deployments across finance, sales, and supply-chain functions require change-management, data-integration, and training expertise that most organizations lack internally. Advisory firms reported 35% headcount growth in EPM practices to meet this demand.
Service momentum is sustained by subscription-based managed offerings that provide monthly close assistance and model tuning. Implementation projects average six to nine months, and enterprises allocate 40-50% of their budgets to workshops that align operational and financial metrics. As generative-AI copilots proliferate, user-training packages are expanding to include prompt-engineering curricula, further lifting services revenue.
Cloud installations represented 66.58% of the 2025 base and are advancing at a 9.57% CAGR, underscoring a decisive shift in the Enterprise Performance Management market toward subscription delivery. API-first architectures allow finance leaders to layer best-of-breed modules onto existing ERP cores without disruptive replacements. On-premises footprints persist in defense and certain financial sectors with strict data-localization mandates.
Quarterly feature updates on multi-tenant clouds shrink the innovation gap, delivering AI forecasting and natural-language query tools without protracted upgrades. Hybrid deployments, mixing on-premises transaction processing with cloud planning, are emerging in jurisdictions such as China where residency rules remain stringent. Sovereign-cloud offerings promise further momentum by satisfying local compliance without sacrificing elasticity.
Complete Report Scope:
- By Component
- Solutions
- Services
- By Deployment Mode
- Cloud
- On-Premise
- By Enterprise Size
- Small and Medium Enterprises (SMEs)
- Large Enterprises
- By End-user Industry
- BFSI
- IT and Telecom
- Healthcare
- Manufacturing
- Retail and E-Commerce
- Energy and Utilities
- Government and Public Sector
- Other End-user Industries
- By Geography
- North America
- United States
- Canada
- Mexico
- Europe
- Germany
- United Kingdom
- France
- Italy
- Spain
- Rest of Europe
- Asia Pacific
- China
- Japan
- India
- South Korea
- Southeast Asia
- Rest of Asia Pacific
- South America
- Brazil
- Argentina
- Rest of South America
- Middle East
- UAE
- Saudi Arabia
- Turkey
- Rest of Middle East
- Africa
- South Africa
- Nigeria
- Rest of Africa
- North America
Geography Analysis
North America retained 41.37% of 2025 revenue, reflecting early cloud adoption and Sarbanes-Oxley driven audit controls. U.S. mid-market firms migrate to AI-enabled suites to trim close cycles, whereas Canadian corporates integrate ESG data to comply with federal climate-disclosure rules. Mexico's shared-service expansion fuels multi-currency consolidation demand. Platform consolidation trends favour unified suites that lower total cost of ownership.
Asia Pacific is the fastest-growing region at a 10.46% CAGR, led by transformation programs in India and China where conglomerates standardize planning across numerous subsidiaries. Japanese reforms mandating quarterly guidance accelerate cloud-planning uptake. Data-quality silos, however, lengthen implementations by up to 50% in decentralized ERP environments.
Europe's trajectory is shaped by ESG reporting convergence, with large corporates integrating carbon metrics into statutory workflows. The Middle East faces adoption headwinds due to security concerns, despite new in-country cloud regions, while Latin American SMEs wrestle with total cost of ownership amidst currency volatility. Africa's nascent market centers on South African and Nigerian banks implementing EPM to support regional expansion.
- Oracle Corporation
- SAP SE
- IBM Corporation
- Broadcom Inc. (CA Technologies)
- Capgemini SE
- Workday Inc.
- Anaplan Inc.
- Infor Inc.
- Wolters Kluwer N.V. (CCH Tagetik)
- Board International S.A.
- OneStream Software LLC
- Planful Inc.
- Vena Solutions Inc.
- Prophix Software Inc.
- Jedox AG
- Solver Inc.
- Kepion Inc.
- Longview Solutions Inc.
- BlackLine Inc.
- Kaufman Hall and Associates LLC (Axiom)
- Unit4 N.V.
- Centage Corporation
- Host Analytics Inc. (legacy)
- Insightsoftware Inc.
- Syntellis Performance Solutions
Additional Benefits:
- The market estimate (ME) sheet in Excel format
- 3 months of analyst support
TABLE OF CONTENTS
1 INTRODUCTION
- 1.1 Study Assumptions and Market Definition
- 1.2 Scope of the Study
2 RESEARCH METHODOLOGY
3 EXECUTIVE SUMMARY
4 MARKET LANDSCAPE
- 4.1 Market Overview
- 4.2 Market Drivers
- 4.2.1 Shift to Cloud-Native EPM Suites for Real-Time FP&A in Mid-Market North America
- 4.2.2 Integration of AI/ML for Scenario Modeling in European Multinationals
- 4.2.3 Convergence of EPM with ESG and Integrated Reporting Mandates in EU
- 4.2.4 Digital Finance Transformation Programs Spurred by US SOX Modernization Act
- 4.2.5 Adoption of xP&A Across Global Retail Supply Chains
- 4.2.6 Rise of API-First Composable Finance Architectures Enabling Plug-and-Play EPM Modules
- 4.3 Market Restraints
- 4.3.1 Data-Quality Silos in Decentralized ERP Landscapes of Large Asian Conglomerates
- 4.3.2 Shortage of FP&A Talent Restricting Advanced EPM Rollouts in Europe
- 4.3.3 Perceived Security Risks Hindering Cloud Migration in Middle East Financial Institutions
- 4.3.4 High TCO for Multi-Module EPM Suites among Latin American SMEs
- 4.4 Industry Value-Chain Analysis
- 4.5 Technological Outlook
- 4.6 Regulatory Landscape
- 4.7 Impact of Macroeconomic Factors on the Market
- 4.8 Porter's Five Forces Analysis
- 4.8.1 Threat of New Entrants
- 4.8.2 Bargaining Power of Buyers
- 4.8.3 Bargaining Power of Suppliers
- 4.8.4 Threat of Substitutes
- 4.8.5 Intensity of Competitive Rivalry
5 MARKET SIZE AND GROWTH FORECASTS (VALUES)
- 5.1 By Component
- 5.1.1 Solutions
- 5.1.2 Services
- 5.2 By Deployment Mode
- 5.2.1 Cloud
- 5.2.2 On-Premise
- 5.3 By Enterprise Size
- 5.3.1 Small and Medium Enterprises (SMEs)
- 5.3.2 Large Enterprises
- 5.4 By End-user Industry
- 5.4.1 BFSI
- 5.4.2 IT and Telecom
- 5.4.3 Healthcare
- 5.4.4 Manufacturing
- 5.4.5 Retail and E-Commerce
- 5.4.6 Energy and Utilities
- 5.4.7 Government and Public Sector
- 5.4.8 Other End-user Industries
- 5.5 By Geography
- 5.5.1 North America
- 5.5.1.1 United States
- 5.5.1.2 Canada
- 5.5.1.3 Mexico
- 5.5.2 Europe
- 5.5.2.1 Germany
- 5.5.2.2 United Kingdom
- 5.5.2.3 France
- 5.5.2.4 Italy
- 5.5.2.5 Spain
- 5.5.2.6 Rest of Europe
- 5.5.3 Asia Pacific
- 5.5.3.1 China
- 5.5.3.2 Japan
- 5.5.3.3 India
- 5.5.3.4 South Korea
- 5.5.3.5 Southeast Asia
- 5.5.3.6 Rest of Asia Pacific
- 5.5.4 South America
- 5.5.4.1 Brazil
- 5.5.4.2 Argentina
- 5.5.4.3 Rest of South America
- 5.5.5 Middle East
- 5.5.5.1 UAE
- 5.5.5.2 Saudi Arabia
- 5.5.5.3 Turkey
- 5.5.5.4 Rest of Middle East
- 5.5.6 Africa
- 5.5.6.1 South Africa
- 5.5.6.2 Nigeria
- 5.5.6.3 Rest of Africa
- 5.5.1 North America
6 COMPETITIVE LANDSCAPE
- 6.1 Market Concentration
- 6.2 Strategic Moves
- 6.3 Market Share Analysis
- 6.4 Company Profiles {(includes Global level Overview, Market level overview, Core Segments, Financials as available, Strategic Information, Market Rank/Share for key companies, Products and Services, and Recent Developments)}
- 6.4.1 Oracle Corporation
- 6.4.2 SAP SE
- 6.4.3 IBM Corporation
- 6.4.4 Broadcom Inc. (CA Technologies)
- 6.4.5 Capgemini SE
- 6.4.6 Workday Inc.
- 6.4.7 Anaplan Inc.
- 6.4.8 Infor Inc.
- 6.4.9 Wolters Kluwer N.V. (CCH Tagetik)
- 6.4.10 Board International S.A.
- 6.4.11 OneStream Software LLC
- 6.4.12 Planful Inc.
- 6.4.13 Vena Solutions Inc.
- 6.4.14 Prophix Software Inc.
- 6.4.15 Jedox AG
- 6.4.16 Solver Inc.
- 6.4.17 Kepion Inc.
- 6.4.18 Longview Solutions Inc.
- 6.4.19 BlackLine Inc.
- 6.4.20 Kaufman Hall and Associates LLC (Axiom)
- 6.4.21 Unit4 N.V.
- 6.4.22 Centage Corporation
- 6.4.23 Host Analytics Inc. (legacy)
- 6.4.24 Insightsoftware Inc.
- 6.4.25 Syntellis Performance Solutions
7 MARKET OPPORTUNITIES AND FUTURE OUTLOOK
- 7.1 White-space and Unmet-Need Assessment


