|
시장보고서
상품코드
2124167
3D 센싱 및 이미징 시장 : 점유율 분석, 업계 동향과 통계, 성장 예측(2026-2031년)3D Sensing And Imaging - Market Share Analysis, Industry Trends & Statistics, Growth Forecasts (2026 - 2031) |
||||||
 Mordor Intelligence
Mordor Intelligence에 의하면, 3D 센싱 및 이미징 시장 규모는 2025년 131억 6,000만 달러에서 2026년에는 149억 8,000만 달러로 확대되어 2026년부터 2031년까지 CAGR 13.84%로 성장을 지속하여, 2031년에는 286억 5,000만 달러에 이를 것으로 예측됩니다.
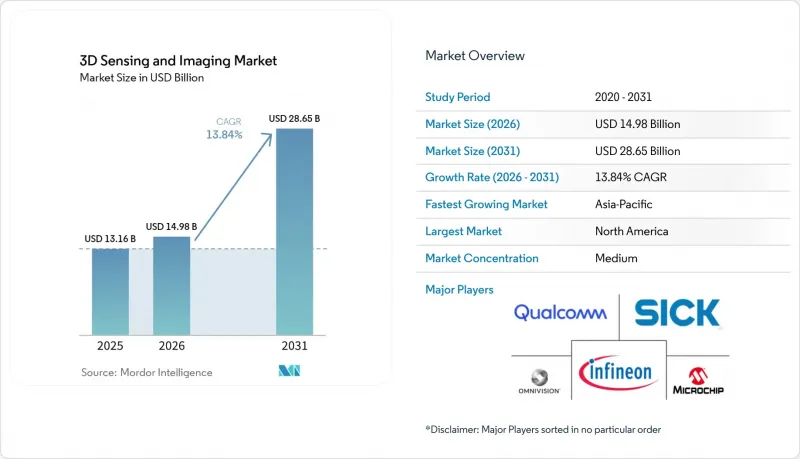
본 보고서는 구성 요소(하드웨어, 소프트웨어, 서비스), 기술(초음파, 구조화된 광 등), 센서 유형(위치 센서, 이미지 센서 등), 연결 방식(유선 네트워크 연결, 무선 네트워크 연결), 최종 사용자 산업(소비자 가전, 자동차 등) 및 지역별로 분류되어 있습니다. 시장 예측은 금액(달러) 기준으로 제시되어 있습니다.
세계 3D 센싱 및 이미징 시장 동향과 인사이트
스마트폰에 구조화된 광 3D 카메라의 보급
한때 프리미엄 플래그십 기종에만 국한되었던 구조화된 광 심도 모듈은 현재 중급형 스마트폰에서도 보편화되어 있으며, 도입 비용이 낮아짐에 따라 공간 사진, AR 게임, 안전한 얼굴 인식에 대한 사용자의 기대가 당연시되고 있습니다. 애플의 아이폰 15 프로에 탑재된 LiDAR 모듈은 공간 컴퓨팅에 대한 소비자 수요를 뒷받침하는 반면, 안드로이드 OEM 업체들은 비용을 절감한 구조화된 광학 솔루션을 신속하게 출시했습니다. 옴니비전이 2025년 4월에 발표한 운전자 모니터링용 1.5메가픽셀 세계 셔터 센서는 스마트폰에서 자동차로 기술이 확산되고 있음을 보여주며, 규모의 경제를 더욱 공고히 하고 있습니다. 생산량 확대에 따라 부품 가격은 1달러 미만의 수준으로 낮아졌으며, 산업용 스캐너 및 휴대용 의료기기에의 채택이 촉진되고 있습니다.
자동차용 ADAS에서의 솔리드 스테이트 LiDAR 깊이 맵 수요
각 자동차 제조업체들은 진동 내성, 속도 측정 기능, 그리고 저비용을 겸비한 솔리드 스테이트형 주파수 변조 연속파(FMCW) 유닛을 채택하는 방향으로 회전식 LiDAR 헤드를 단계적으로 폐지하고 있습니다. 다임러 트럭이 2024년에 Aeva사의 FMCW 라이다를 채택한 것은 레벨 4 트럭 차량군을 위한 칩 스케일 깊이 센서에 대한 업계의 신뢰를 뒷받침하는 것입니다. 자동차 형식 인증으로 인해 일정은 장기화되겠지만, 무결점 제조 실적을 보유한 1차 공급업체들은 ADAS가 차량 가격대의 하위 모델로 확산됨에 따라 지속적인 설계 수주를 확보할 수 있을 것으로 전망됩니다.
고출력 GaAs 에피웨하 공급 부족
갈륨 비소(GaAs) 기판 생산은 여전히 아시아태평양의 소수 제조업체에 집중되어 있어, 장거리 비행시간법(ToF) 모듈에 사용되는 고출력 VCSEL의 경우 가격 급등과 20주간의 리드 타임을 초래하고 있습니다. 각 센서 제조업체들은 피크 전류 소비를 줄이기 위해 광학 시스템의 재설계를 추진하고 있으며, 리스크 헤지 수단으로 실리콘 질화물 포토닉스의 도입을 모색하고 있지만, 단기적인 공급량 제약으로 인해 자동차용 LiDAR의 도입 일정은 여전히 제약을 받고 있습니다.
부문 분석
2025년 시점에서 3D 센싱 및 이미징 시장의 72.15%를 하드웨어가 차지했으나, 구매자들이 턴키 도입 및 성과 연계형 가격 책정을 요구함에 따라 서비스 부문은 2031년까지 연평균 성장률(CAGR) 14.88%로 성장하고 있습니다. Faro Technologies는 현재 분기 매출의 20.9%를 소프트웨어 및 지속적인 클라우드 분석 서비스에서 얻고 있으며, 이는 보정, 유지보수, AI 모델 업데이트가 어떻게 지속적인 수익원을 창출하고 있는지를 보여줍니다. 각 벤더들은 다년간의 계약을 확보하기 위해 도입 및 수명 주기 지원을 패키지로 묶고 있으며, 수익 구성은 서서히 서비스 쪽으로 이동하고 있습니다.
심도 맵을 실용적인 이벤트로 압축하는 엣지 AI 툴체인에 대한 수요가 소프트웨어 부가율을 더욱 끌어올리고 있습니다. 이러한 순수 하드웨어 사업의 이익률 하락으로 인해 부품 공급업체들은 클라우드 및 미들웨어 제공업체와의 제휴를 모색하고 있으며, 이를 통해 생태계의 안정성과 데이터 기반의 업셀링 가능성이 확보되고 있습니다.
2025년에도 비행시간법(ToF)은 43.25%의 점유율을 유지했습니다. 이는 실리콘 포토다이오드와 VCSEL 드라이버가 스마트폰의 비용 범위에 부합하며, 연간 수십억 개에 달하는 수요를 확보하고 있기 때문입니다. 한편, 초음파 기반 시스템을 이용한 3D 센싱 및 이미징 시장 규모는 음향 변환기가 밝은 햇빛 아래나 반투명 소재 환경에서 뛰어난 성능을 발휘하기 때문에 연평균 15.62%의 성장률을 보일 것으로 예측됩니다. 산업용 로봇에서는 광택이 있는 금속의 결함 검출에 광학 및 초음파를 결합한 하이브리드 방식이 채택되고 있는 반면, 병원에서는 방사선을 사용하지 않는 태아 및 심장 영상 촬영에 초음파 심도 프로브가 선호되고 있습니다. 센서 설계자들은 3D 적층 CMOS를 활용하여 초음파 수신 회로와 광학 이미저를 동일한 위치에 배치하고, 환경에 따라 감지 방식을 전환하는 센싱 클러스터를 구현하고 있습니다.
지역별 분석
2025년에는 자동차 및 의료기기 제조업체가 뿌리 깊은 북미가 매출의 37.85%를 차지하며 1위를 차지했지만, 아시아태평양은 연평균 성장률(CAGR) 15.74%로 급성장하고 있습니다. 중국의 휴대전화 및 수탁 제조 대기업들은 부품 원가(BOM)를 절감하여 심도 카메라의 보급을 촉진하고 있는 반면, 일본의 정밀 기계 제조업체들은 마이크론 수준의 3D 캡처가 필요한 품질 검사 기준을 높이고 있습니다. 한국의 디스플레이 제조업체들은 차세대 OLED 스택 검증에 인라인 3D 프로파일 측정기를 도입하고 있습니다. 인도에서는 농작물 수확량을 최적화하기 위해 위성을 활용한 3D 토양 수분 매핑 시범 운영이 진행되고 있어, 스마트 농업의 확산을 시사하고 있습니다. 유럽은 Euro NCAP 규제와 머신 비전 투자를 장려하는 산업 자동화 보조금에 힘입어 견조한 추세를 유지하고 있습니다.
기타 혜택:
- 엑셀 형식 시장 예측(ME) 시트
- 3개월간의 애널리스트 지원
자주 묻는 질문
목차
제1장 서론
제2장 조사 방법
제3장 주요 요약
제4장 시장 구도
제5장 시장 규모와 성장 예측
제6장 경쟁 구도
제7장 시장 기회와 향후 전망
JHSAccording to Mordor Intelligence, the 3D sensing and imaging market size is expected to grow from USD 13.16 billion in 2025 to USD 14.98 billion in 2026 and is forecast to reach USD 28.65 billion by 2031 at 13.84% CAGR over 2026-2031.
This report is Segmented by Component (Hardware, Software, and Services), Technology (Ultrasound, Structured Light, and More), Sensor Type (Position Sensors, Image Sensors, and More), Connectivity (Wired Network Connectivity and Wireless Network Connectivity), End-User Industry (Consumer Electronics, Automotive, and More), and Geography. The Market Forecasts are Provided in Terms of Value (USD).
Global 3D Sensing And Imaging Market Trends and Insights
Widespread Smartphone Integration of Structured-Light 3D Cameras
Structured-light depth modules once reserved for premium flagships are now commonplace in mid-range handsets, lowering entry costs and normalizing user expectations for spatial photography, AR gaming, and secure face authentication. Apple's iPhone 15 Pro LiDAR module validated consumer appetite for spatial computing, while Android OEMs rapidly released cost-reduced structured-light solutions. OmniVision's April 2025 unveiling of a 1.5-megapixel global-shutter sensor for driver monitoring illustrates technology spillover from phones to vehicles, deepening economies of scale. Volume ramp-ups push component pricing toward the sub-USD 1 threshold, unlocking adoption in industrial scanners and handheld medical devices.
Automotive ADAS Demand for Solid-State LiDAR Depth Maps
Vehicle makers are phasing out rotating LiDAR heads in favor of solid-state frequency-modulated continuous-wave (FMCW) units that offer vibration tolerance, velocity measurement, and lower cost. Daimler Truck's 2024 selection of Aeva FMCW LiDAR underscored industry confidence in chip-scale depth sensors for Level 4 trucking fleets. Although automotive homologation extends timelines, Tier-1 suppliers with zero-defect manufacturing credentials stand to gain recurring design wins as ADAS moves down the vehicle price curve.
Supply-Chain Scarcity of High-Power GaAs Epi-Wafers
Gallium arsenide substrate output remains concentrated among a handful of Asia-Pacific growers, creating price spikes and 20-week lead times for high-power VCSELs used in long-range time-of-flight modules. Sensor makers redesign optics for lower peak current draw and pursue silicon nitride photonics as a hedge, but near-term unit allocations still constrain automotive LiDAR rollout schedules.
Other drivers and restraints analyzed in the detailed report include:
- Industry 4.0 Adoption of 3D Machine-Vision Inspection Systems
- Healthcare Shift Toward Minimally Invasive, Real-Time 3D Imaging
- Calibration Complexity Across Multi-Sensor Camera Modules
For complete list of drivers and restraints, kindly check the Table Of Contents.
Segment Analysis
Hardware retained 72.15% of the 3D sensing and imaging market in 2025, yet services are growing 14.88% CAGR to 2031 as buyers seek turnkey deployments and outcome-based pricing. Faro Technologies now derives 20.9% of quarterly revenue from software and recurring cloud analytics, illustrating how calibration, maintenance, and AI model updates create annuity streams. Vendors package installation and lifetime support to secure multi-year deals, gradually tilting revenue mix toward services.
Demand for edge AI tool-chains that compress depth maps into actionable events further propels software attach rates. This erosion of pure-play hardware margins pressures component suppliers to form alliances with cloud and middleware providers, ensuring ecosystem stickiness and data-driven upsell potential.
Time-of-flight kept a 43.25% share in 2025 because its silicon photodiodes and VCSEL drivers align with smartphone cost envelopes, securing billions of annual units. The 3D sensing and imaging market size for ultrasound-based systems, however, is projected to expand 15.62% annually as acoustic transducers excel in bright-sunlight and translucent-material scenarios. Industrial robotics adopts hybrid optical-ultrasound stacks for defect detection on glossy metals, while hospitals favor ultrasound depth probes for radiation-free fetal and cardiac imaging. Sensor designers leverage 3D-stacked CMOS to co-locate ultrasound receive circuits and optical imagers, yielding sensing clusters that toggle modality based on the environment.
Complete Report Scope:
- By Component
- Hardware
- Software
- Services
- By Technology
- Ultrasound
- Structured Light
- Time-of-Flight
- Stereoscopic Vision
- Other Technologies
- By Sensor Type
- Position Sensors
- Image Sensors
- Temperature Sensors
- Accelerometer Sensors
- Proximity Sensors
- Other Sensor Types
- By Connectivity
- Wired Network Connectivity
- Wireless Network Connectivity
- By End-user Industry
- Consumer Electronics
- Automotive
- Healthcare
- Aerospace and Defense
- Security and Surveillance
- Media and Entertainment
- Other End-user Industries
- By Geography
- North America
- United States
- Canada
- Mexico
- South America
- Brazil
- Argentina
- Chile
- Rest of South America
- Europe
- Germany
- United Kingdom
- France
- Italy
- Spain
- Rest of Europe
- Asia-Pacific
- China
- Japan
- South Korea
- India
- Singapore
- Australia
- Rest of Asia-Pacific
- Middle East and Africa
- Middle East
- Saudi Arabia
- United Arab Emirates
- Turkey
- Rest of Middle East
- Africa
- South Africa
- Nigeria
- Egypt
- Rest of Africa
- Middle East
- North America
Geography Analysis
North America led with 37.85% revenue in 2025, owing to entrenched automotive and medical-device manufacturers, yet Asia-Pacific is climbing 15.74% CAGR. Chinese handset and contract-manufacturing giants compress bill-of-materials to democratize depth cameras, while Japanese precision-machinery firms elevate quality inspection standards that require micron-level 3D capture. Korean display producers deploy in-line 3D profilometers to validate next-gen OLED stacks. India pilots satellite-based 3D soil-moisture mapping to optimize crop yields, signaling broader smart-agriculture uptake. Europe remains steady, driven by Euro NCAP mandates and industrial automation subsidies that reward machine vision investments.
- Infineon Technologies AG
- Microchip Technology Inc.
- OmniVision Technologies Inc.
- Qualcomm Inc.
- Sick AG
- Keyence Corporation
- Texas Instruments Incorporated
- GE Healthcare Technologies Inc.
- STMicroelectronics N.V.
- Alphabet Inc. (Google LLC)
- Adobe Inc.
- Autodesk Inc.
- Panasonic Holdings Corporation
- Trimble Inc.
- FARO Technologies Inc.
- Lockheed Martin Corporation
- Dassault Systemes SE
- Sony Group Corporation
- Lumentum Holdings Inc.
- ams-OSRAM AG
Additional Benefits:
- The market estimate (ME) sheet in Excel format
- 3 months of analyst support
TABLE OF CONTENTS
1 INTRODUCTION
- 1.1 Study Assumptions and Market Definition
- 1.2 Scope of the Study
2 RESEARCH METHODOLOGY
3 EXECUTIVE SUMMARY
4 MARKET LANDSCAPE
- 4.1 Market Overview
- 4.2 Market Drivers
- 4.2.1 Widespread smartphone integration of structured-light 3D cameras
- 4.2.2 Automotive ADAS demand for solid-state LiDAR depth maps
- 4.2.3 Industry 4.0 adoption of 3D machine-vision inspection systems
- 4.2.4 Healthcare shift toward minimally-invasive, real-time 3D imaging
- 4.2.5 Emergence of VCSEL-on-CMOS chiplets for sub-USD 1 depth sensors
- 4.2.6 Satellite-based 3D Earth-observation constellations for climate analytics
- 4.3 Market Restraints
- 4.3.1 Supply-chain scarcity of high-power GaAs epi-wafers
- 4.3.2 Calibration complexity across multi-sensor camera modules
- 4.3.3 Cyber-security risks from depth-map spoofing in authentication
- 4.3.4 Regulatory uncertainty on public-space 3D biometric data capture
- 4.4 Industry Value Chain Analysis
- 4.5 Regulatory Landscape
- 4.6 Technological Outlook
- 4.7 Impact of Macroeconomic Factors
- 4.8 Porter's Five Forces Analysis
- 4.8.1 Bargaining Power of Suppliers
- 4.8.2 Bargaining Power of Consumers
- 4.8.3 Threat of New Entrants
- 4.8.4 Threat of Substitutes
- 4.8.5 Intensity of Competitive Rivalry
5 MARKET SIZE AND GROWTH FORECASTS (VALUES)
- 5.1 By Component
- 5.1.1 Hardware
- 5.1.2 Software
- 5.1.3 Services
- 5.2 By Technology
- 5.2.1 Ultrasound
- 5.2.2 Structured Light
- 5.2.3 Time-of-Flight
- 5.2.4 Stereoscopic Vision
- 5.2.5 Other Technologies
- 5.3 By Sensor Type
- 5.3.1 Position Sensors
- 5.3.2 Image Sensors
- 5.3.3 Temperature Sensors
- 5.3.4 Accelerometer Sensors
- 5.3.5 Proximity Sensors
- 5.3.6 Other Sensor Types
- 5.4 By Connectivity
- 5.4.1 Wired Network Connectivity
- 5.4.2 Wireless Network Connectivity
- 5.5 By End-user Industry
- 5.5.1 Consumer Electronics
- 5.5.2 Automotive
- 5.5.3 Healthcare
- 5.5.4 Aerospace and Defense
- 5.5.5 Security and Surveillance
- 5.5.6 Media and Entertainment
- 5.5.7 Other End-user Industries
- 5.6 By Geography
- 5.6.1 North America
- 5.6.1.1 United States
- 5.6.1.2 Canada
- 5.6.1.3 Mexico
- 5.6.2 South America
- 5.6.2.1 Brazil
- 5.6.2.2 Argentina
- 5.6.2.3 Chile
- 5.6.2.4 Rest of South America
- 5.6.3 Europe
- 5.6.3.1 Germany
- 5.6.3.2 United Kingdom
- 5.6.3.3 France
- 5.6.3.4 Italy
- 5.6.3.5 Spain
- 5.6.3.6 Rest of Europe
- 5.6.4 Asia-Pacific
- 5.6.4.1 China
- 5.6.4.2 Japan
- 5.6.4.3 South Korea
- 5.6.4.4 India
- 5.6.4.5 Singapore
- 5.6.4.6 Australia
- 5.6.4.7 Rest of Asia-Pacific
- 5.6.5 Middle East and Africa
- 5.6.5.1 Middle East
- 5.6.5.1.1 Saudi Arabia
- 5.6.5.1.2 United Arab Emirates
- 5.6.5.1.3 Turkey
- 5.6.5.1.4 Rest of Middle East
- 5.6.5.2 Africa
- 5.6.5.2.1 South Africa
- 5.6.5.2.2 Nigeria
- 5.6.5.2.3 Egypt
- 5.6.5.2.4 Rest of Africa
- 5.6.5.1 Middle East
- 5.6.1 North America
6 COMPETITIVE LANDSCAPE
- 6.1 Market Concentration
- 6.2 Strategic Moves
- 6.3 Market Share Analysis
- 6.4 Company Profiles (includes Global level Overview, Market level overview, Core Segments, Financials as available, Strategic Information, Market Rank/Share for key companies, Products and Services, and Recent Developments)
- 6.4.1 Infineon Technologies AG
- 6.4.2 Microchip Technology Inc.
- 6.4.3 OmniVision Technologies Inc.
- 6.4.4 Qualcomm Inc.
- 6.4.5 Sick AG
- 6.4.6 Keyence Corporation
- 6.4.7 Texas Instruments Incorporated
- 6.4.8 GE Healthcare Technologies Inc.
- 6.4.9 STMicroelectronics N.V.
- 6.4.10 Alphabet Inc. (Google LLC)
- 6.4.11 Adobe Inc.
- 6.4.12 Autodesk Inc.
- 6.4.13 Panasonic Holdings Corporation
- 6.4.14 Trimble Inc.
- 6.4.15 FARO Technologies Inc.
- 6.4.16 Lockheed Martin Corporation
- 6.4.17 Dassault Systemes SE
- 6.4.18 Sony Group Corporation
- 6.4.19 Lumentum Holdings Inc.
- 6.4.20 ams-OSRAM AG
7 MARKET OPPORTUNITIES AND FUTURE OUTLOOK
- 7.1 White-space and Unmet-need Assessment