

|
시장보고서
상품코드
2124248
인더스트리 4.0 시장 : 시장 점유율 분석, 업계 동향 및 통계, 성장 예측(2026-2031년)Industry 4.0 - Market Share Analysis, Industry Trends & Statistics, Growth Forecasts (2026 - 2031) |
||||||
 Mordor Intelligence
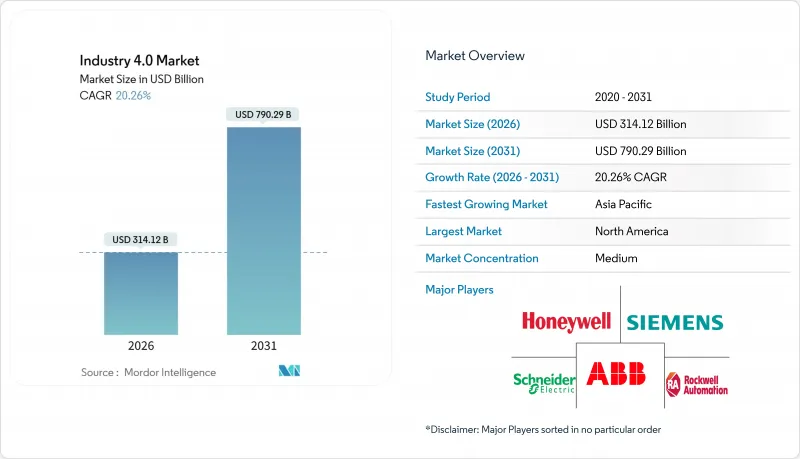
Mordor Intelligence에 의하면, 인더스트리 4.0 시장은 2026년에 3,141억 2,000만 달러로 추정되고, 2031년까지 7,902억 9,000만 달러까지 확대될 것으로 예측됩니다.
이는 예측 기간 동안 연평균 성장률(CAGR)이 20.26%임을 나타내며, 전 세계 생산 네트워크 전반에 걸쳐 사이버-물리 융합이 필수 불가결한 방향으로의 구조적 변화를 부각시키고 있습니다.
본 보고서는 기술 유형별(산업용 로봇, IIoT 등), 구성 요소별(하드웨어, 소프트웨어/플랫폼, 서비스), 도입 모델별(온프레미스, 클라우드, 하이브리드), 최종 사용자 산업별(이산형 제조, 자동차 등) 및 지역별(북미, 남미, 유럽, 중동 및 아프리카, 아시아태평양)별로 분류되어 있습니다. 시장 예측은 금액(달러)으로 제시됩니다.
인더스트리 4.0 시장 인사이트 및 동향
정부의 지원책 및 다자간 협력
각국 정부의 프로그램을 통해 시범 사업 비용을 부담하고, 모범 사례를 체계화하며, 인재 양성을 위한 로드맵을 제공함으로써 사이버-물리 시스템의 도입을 가속화하고 있습니다. 독일은 2025년에 머신 투 머신(M2M) 프로토콜을 검증하는 5G 테스트베드에 2억 유로(2억 2,600만 달러)를 투자하여 중견 공급업체의 통합 위험을 줄였습니다. 영국의 ‘Made Smarter’ 이니셔티브는 중소 제조업체의 자동화를 지원하기 위해 1억 2,000만 파운드(1억 5,600만 달러)를 배정하여, 많은 프로젝트에서 투자 회수 기간을 3년 미만으로 단축했습니다. 싱가포르의 첨단 재제조·기술 센터(ARTC)는 전 세계 OEM 기업들과 제휴하여 예측 유지보수 프로그램을 시범 운영했습니다. 이를 통해 예기치 못한 가동 중단 시간을 40% 줄이는 데 성공했으며, 이 성과는 현재 ‘스마트 산업 준비도 지수(Smart Industry Readiness Index)’에 반영되어 있습니다. 인도의 ‘생산 연계 인센티브(PLI)’ 제도는 최대 25%의 자본 보조금을 제공하고 있어, 전자 및 제약 업계에서 협동 로봇 수주가 급증하고 있습니다. 이러한 체계적인 노력을 통해 도입 주기가 수년 단위에서 분기 단위로 단축되었으며, 공급업체 선정을 용이하게 하는 사실상의 표준이 확립되었습니다.
산업용 로봇 및 협동 로봇에 대한 수요 급증
2024년 전 세계 로봇 도입 대수는 54만 2,000대에 달했으며, 가격 하락과 모듈식 아키텍처로 인해 새로운 이용 사례가 개척됨에 따라 10년 전의 2배 수준에 이르렀습니다. 2025년 출하 대수 중 협업 로봇(코봇)이 18%를 차지한 것으로 평가되었으며, 이는 제조업체들이 인간 작업자와 안전하게 공존할 수 있는 유연한 자동화를 추진하고 있음을 반영합니다. 현재 자동차 조립 라인에서는 전면 유리 접착이나 배터리 모듈 삽입과 같은 작업에 코봇이 활용되고 있습니다. 이러한 작업은 정밀도가 요구되는 한편, 사람 근처에서 작업하는 것이 허용되는 작업입니다. 대만과 한국의 반도체 파운드리에서는 인력 부족을 보완하면서 서브미크론 수준의 수율 목표를 달성하기 위해 2025년에 3만 5,000대 이상의 로봇을 도입했습니다. 각 공급업체들은 적응형 집게 기능을 구현하기 위해 비전 센서와 힘·토크 피드백 기능을 탑재하고 있으며, 그동안 수작업에 의존해 왔던 다품종 소량 생산 환경으로도 자동화를 확대되고 있습니다.
Tier 2 및 Tier 3 공급업체의 ROI에 대한 불확실성
2025년에 800개 제조업체를 대상으로 실시한 조사에 따르면, 중소 공급업체의 70%가 투자 회수 기간이 5년을 초과한다는 이유로 인더스트리 4.0 투자를 미루고 있었습니다. 이 5년이라는 기준은 변동이 심한 수주 상황과 부합하지 않습니다. 딜로이트의 조사에 따르면, 2024년에는 중소기업의 58%가 생산량 변동으로 인해 비용을 완전히 회수하기 전에 자산이 유휴 상태가 될 우려가 있다며 자동화 프로젝트를 연기했습니다. 효과 파악은 과제입니다. 한 독일의 Tier 1 공급업체는 디지털 트윈 스위트에 300만 유로(340만 달러)를 투자했으나, 여러 공정 변경이 동시에 발생하여 폐기율 12% 감축에 대한 기여도를 파악하는 데 어려움을 겪었습니다. 보조금을 통해 초기 비용은 경감되지만, 사내 엔지니어링 체계가 갖춰지지 않은 기업의 경우 신청 절차의 부담이 너무 커서 자금 활용이 지연될 가능성이 있습니다.
부문 분석
2025년, 산업용 자동화 기술은 매출의 38.33%를 차지했으며, 인더스트리 4.0 시장에 필수적인 프로그래머블 로직 컨트롤러(PLC)와 감시 제어 시스템을 통해 생산 라인을 뒷받침했습니다. 블록체인은 현재 지출 비중이 한 자릿수 중반에 머물러 있지만, 규제 당국이 의약품 및 자동차 부품에 대한 추적성 규정을 강화함에 따라 2031년까지 연평균 22.81%의 성장률을 보일 것으로 예측됩니다. 네슬레와 월마트는 2025년, 500개사로 구성된 식품 컨소시엄에 참여하여 콜드체인의 무결성을 보장하기 위한 허가형 원장 시스템에 대한 신뢰를 높였습니다. 산업용 IoT 센서는 기술 예산의 19%를 차지하며, 진동, 온도, 압력 데이터를 예측 유지보수 모델에 집계하고 있습니다. 인공지능(AI)은 14%의 점유율을 차지하며 주로 시각 검사나 수요 예측에 활용되고 있지만, 엣지 지원 칩으로 인해 추론 비용이 낮아지면서 이용 사례가 확대되고 있습니다. 항공우주 분야의 조립 업체들이 복잡한 기체 작업에서 오류율을 줄임에 따라, 증강현실(XR) 플랫폼 도입은 21% 증가했습니다. 디지털 트윈은 지출의 11%를 차지하며, 자동차 제조업체들이 자본을 투자하기 전에 생산 능력 변경을 시뮬레이션할 수 있도록 지원했습니다.
적층 가공 기술의 활용 확대에 따라 예비 부품의 물류 체계가 재구축되고 있습니다. GE 에어로스페이스는 2025년, 분말 베드 용융법을 사용하여 10만 개의 연료 노즐 부품을 생산함으로써 리드 타임을 18개월에서 3개월로 대폭 단축했습니다. 엣지 컴퓨팅과 프라이빗 5G 인프라는 7%의 점유율을 차지하고 있으며, 제조업체들이 데이터 주권 요건을 충족하고 클라우드 데이터 전송 비용을 절감하기 위해 온프레미스형 분석을 도입함에 따라 빠르게 성장하고 있습니다. 자동차 리콜 및 의약품 일련번호 부여에 관한 법규로 인해 위조가 불가능한 데이터 추적 기록이 의무화됨에 따라, 블록체인을 핵심으로 하는 인더스트리 4.0용 용도 시장 규모는 대폭 확대될 것으로 예측됩니다. AI 비전, 엣지 추론, 허가형 원장을 결합한 각 벤더들은 현재 인더스트리 4.0 업계에서 종단간 규정 준수 제공업체로서의 입지를 확립하고 있습니다.
하드웨어는 2025년 매출의 42.21%를 차지했으며, 이는 인더스트리 4.0 시장의 대규모 디지털화에 필수적인 로봇, 센서, 엣지 서버의 구매를 반영한 것입니다. 소프트웨어 분야는 영구 라이선스에서 SaaS로의 전환을 통해 중소기업의 첫해 비용을 절감하고 지속적인 업데이트를 보장함에 따라, 2031년까지 연평균 성장률(CAGR) 21.57%를 나타낼 것으로 예측됩니다. 지멘스의 MindSphere는 종량제 요금제를 채택하고, 예측 유지보수 및 에너지 대시보드를 하나의 계약으로 통합함으로써 2025년에 1,200개의 신규 고객을 확보했습니다. SAP의 ‘Digital Manufacturing Cloud’는 50개 이상의 장비 브랜드와 통합되어, 여러 거점에 걸친 재고 및 품질 데이터의 통일된 가시화를 실현했습니다. 구매자들이 복잡한 개조 작업을 외부에 위탁하는 가운데, 통합 및 관리형 지원을 포함한 서비스가 매출의 31%를 차지했습니다. 록웰 오토메이션에 따르면, 2025년 수주 건의 65%가 다년간의 서비스 계약을 수반했다고 합니다.
하드웨어 투자는 엣지 AI 가속기 및 스마트 카메라에 집중되고 있습니다. 인텔은 2025년 산업용 고객을 대상으로 230만 개의 추론 프로세서를 출하했으며, 카메라 내에 신경망을 내장함으로써 이미지를 로컬에서 처리하고 네트워크 트래픽을 줄였습니다. 규제적 압력 또한 소프트웨어 수요를 뒷받침하고 있습니다. FDA는 연속적인 의약품 제조에 대해 통계적 공정 관리를 의무화하고 있으며, 이에 따라 제약 공장은 실시간 데이터 히스토리안 및 실험실 정보 시스템과의 연동을 도입하고 있습니다. 그 결과, SaaS 기반 디지털 트윈, 히스토리안, 분석 도구의 인더스트리 4.0 시장 규모는 하드웨어 예산 증가율을 상회하는 속도로 확대되고 있으며, 이는 인더스트리 4.0 업계에서 데이터 기반 운영으로의 장기적인 전환을 여실히 보여주고 있습니다.
지역별 분석
북미는 2025년 매출의 35.13%를 차지했으며, 시뮬레이션 및 AI 워크로드를 위한 저지연 컴퓨팅을 제공하는 하이퍼스케일러의 850억 달러 규모 데이터센터 투자가 이를 뒷받침했습니다. 멕시코에서는 기업들이 관세 위험을 완화하기 위해 니어쇼어링을 진행하는 가운데, 2025년에 400억 달러 규모의 제조업 투자를 유치했습니다. 이러한 추세는 센서 및 로봇 수요를 촉진하고 있습니다. 미국의 ‘제조업 확장 파트너십(MEP)’은 중소기업의 확장 가능한 도입 사례를 보여주고 있으며, 연방 정부의 기술 지원이 다국적 기업을 넘어 디지털화의 확산을 가속화하고 있음을 입증하고 있습니다. CISA(미국 사이버보안 및 인프라 보안국)의 사이버보안 지침은 구매자들이 임베디드형 제로 트러스트 제어를 요구하는 가운데, 공급업체의 로드맵을 형성하고 있습니다.
아시아태평양은 중국의 1조 4,000억 달러 규모 ‘중국 제조 2025’ 계획,인도의 260억 달러 규모 ‘생산 연계형 인센티브’ 제도, 그리고 디지털 도구를 노동력 고령화라는 과제와 연계하는 일본의 ‘사회 5.0’ 정책에 힘입어 2031년까지 연평균 성장률(CAGR) 21.18%를 나타낼 것으로 예측됩니다. 한국은 2025년, 서브마이크론급 공차를 필요로 하는 반도체 및 배터리 셀 생산 라인에 중점을 두고, 스마트 팩토리 프로그램에 150억 달러를 투자했습니다. 싱가포르의 ‘스마트 산업 준비도 지수(Smart Industry Readiness Index)’는 300개 기업의 성숙도 평가를 지원하여, 과잉 투자를 피하면서 단계적인 디지털 도입을 가능하게 했습니다.
유럽은 2025년 매출의 22%를 차지했으며, 독일의 ‘인더스트리 4.0’ 플랫폼과 영국의 보조금에 힘입었습니다. SaaS 가격 책정이 현금 흐름과 조화를 이루면서 미텔슈탄트 기업들의 디지털 트윈 투자는 42% 증가했습니다. 2026년 1월에 발효된 유럽연합(EU)의 ‘탄소 국경 조정 메커니즘’은 관세 규제를 준수하기 위해 배출 데이터를 기록하는 에너지 관리 시스템의 도입을 촉진했습니다. 중동은 4%의 점유율을 차지하고 있으며, 사우디 아람코의 업스트림 부문 도입이 대표적인 사례인 것처럼 석유 및 가스 분야의 원격 모니터링에 지출을 집중하고 있습니다. 아프리카는 2%의 점유율을 차지하고 있으며, 남아프리카공화국의 자동차 공장이나 나이지리아의 식품 가공업체에서 초기 성과가 나타나고 있습니다. 다만, 인프라 격차와 인력 부족이 규모 확대의 걸림돌이 되고 있습니다.
기타 혜택 :
- 엑셀 형식 시장 예측(ME) 시트
- 3개월간의 애널리스트 지원
자주 묻는 질문
목차
제1장 서론
제2장 조사 방법
제3장 주요 요약
제4장 시장 구도
제5장 시장 규모 및 성장 예측
제6장 경쟁 구도
제7장 시장 기회 및 향후 전망
AJY 26.09.09According to Mordor Intelligence, the industry 4.0 market reached USD 314.12 billion in 2026 and is projected to climb to USD 790.29 billion by 2031, reflecting a 20.26% CAGR over the forecast period, underscoring the structural shift toward mandatory cyber-physical convergence across global production networks.
This report is Segmented by Technology Type (Industrial Robotics, Iiot, and More), Component (Hardware, Software/Platforms, and Services), Deployment Model (On-Premises, Cloud, and Hybrid), End-User Industry (Discrete Manufacturing, Automotive, and More), and Geography (North America, South America, Europe, Middle East, Africa, Asia-Pacific). The Market Forecasts are Provided in Terms of Value (USD).
Insights and Trends of Industry 4.0 Market
Favorable Government Initiatives And Multi-Stakeholder Collaborations
National programs are accelerating cyber-physical adoption by underwriting pilot expenses, codifying best practices, and providing workforce training roadmaps. Germany channeled EUR 200 million (USD 226 million) in 2025 to 5G testbeds that validate machine-to-machine protocols, cutting integration risk for mid-sized suppliers. The United Kingdom's Made Smarter initiative earmarked GBP 120 million (USD 156 million) to subsidize automation for smaller manufacturers, shortening payback periods to below three years for many projects. Singapore's Advanced Remanufacturing and Technology Centre partnered with global OEMs to demonstrate predictive-maintenance programs that trimmed unplanned downtime by 40%, a milestone now embedded in the Smart Industry Readiness Index. India's Production-Linked Incentive mechanism offers capital subsidies up to 25%, driving a surge in collaborative-robot orders across electronics and pharmaceutical verticals. These orchestrated efforts squeeze deployment cycles from years to quarters and create de facto standards that ease vendor selection.
Surging Demand For Industrial And Collaborative Robotics
Global robot installations reached 542,000 units in 2024, doubling the volume of a decade earlier as price declines and modular architectures unlocked new use cases. Cobots captured 18% of 2025 shipments, reflecting manufacturers' push for flexible automation that can coexist safely with human workers. Automotive assembly lines now rely on cobots for windshield bonding and battery-module insertion, tasks demanding precision but tolerant of human proximity. Semiconductor foundries across Taiwan and South Korea installed more than 35,000 robots in 2025 to offset labor shortages while meeting sub-micron yield targets. Vendors are embedding vision sensors and force-torque feedback to enable adaptive gripping, extending automation to high-mix environments previously relegated to manual labor.
Uncertain ROI Perception Among Tier-2 And Tier-3 Suppliers
A 2025 survey of 800 manufacturers revealed that 70% of smaller suppliers delayed Industry 4.0 investments due to payback horizons beyond five years, a threshold misaligned with volatile order books. Deloitte found that 58% of SMEs deferred automation projects in 2024 because potential volume swings could strand assets prior to full cost recovery. Attribution is challenging; a German tier-one spent EUR 3 million (USD 3.4 million) on a digital-twin suite yet struggled to isolate its contribution to a 12% scrap reduction because multiple process changes occurred simultaneously. While subsidies alleviate upfront costs, application paperwork can overwhelm firms without in-house engineering capacity, delaying access to funds.
Other drivers and restraints analyzed in the detailed report include:
- Rapid SME-Led Digital Transformation Programs
- Edge And Private 5G Rollouts Enabling Ultra-Low-Latency Factory Networks
- Workforce Upskilling And Union Push-Back On Cobot Adoption
For complete list of drivers and restraints, kindly check the Table Of Contents.
Segment Analysis
Industry automation technologies held 38.33% revenue in 2025, anchoring production lines with programmable logic controllers and supervisory systems vital to the Industry 4.0 market. Blockchain, though only mid-single-digit spending today, is forecast to grow at 22.81% annually through 2031 as regulators tighten traceability rules for pharmaceuticals and vehicle components. Nestle and Walmart joined a 500-member food consortium in 2025, raising confidence in permissioned ledgers for cold-chain integrity. Industrial IoT sensors captured 19% of technology budgets, funneling vibration, temperature, and pressure data into predictive-maintenance models. Artificial intelligence held 14% share, mainly vision inspection and demand forecasting, but edge-compatible chips are lowering inference costs, broadening use cases. Extended-reality platforms posted a 21% jump as aerospace assemblers cut error rates on complex airframe tasks. Digital twins represented 11% of spending, aiding automotive firms in simulating capacity changes before committing capital.
Expanded use of additive manufacturing is reshaping spare-parts logistics. GE Aerospace produced 100,000 fuel-nozzle parts via powder-bed fusion in 2025, slashing lead times from 18 months to three. Edge computing and private 5G infrastructure, at 7% share, are growing swiftly as manufacturers adopt on-premises analytics to satisfy data-sovereignty mandates and lower cloud egress fees. The Industry 4.0 market size for blockchain-centric applications is expected to widen considerably as automotive recalls and pharmaceutical serialisation laws enforce immutable data trails. Vendors combining AI vision, edge inference, and permissioned ledgers now position themselves as end-to-end compliance providers in the Industry 4.0 industry.
Hardware captured 42.21% of 2025 revenue, reflecting robot, sensor, and edge-server purchases indispensable to large-scale digitization in the Industry 4.0 market. Software is projected to grow at a 21.57% CAGR through 2031 as perpetual licenses give way to SaaS, slicing first-year costs for SMEs and ensuring continuous updates. Siemens MindSphere attracted 1,200 new clients in 2025 on pay-as-you-go rates, bundling predictive maintenance and energy dashboards under one contract. SAP Digital Manufacturing Cloud integrated with over 50 equipment brands, enabling unified visibility across multi-site inventory and quality data. Services, including integration and managed support, accounted for 31% revenue as buyers outsource complex retrofits; Rockwell Automation noted 65% of 2025 bookings carried multi-year service terms.
Hardware spending is concentrating in edge-AI accelerators and smart cameras. Intel shipped 2.3 million inference processors to industrial clients in 2025, embedding neural networks inside cameras, cutting network traffic by processing images locally. Regulatory pressure also drives software demand; the FDA requires statistical process control for continuous drug manufacturing, prompting pharma plants to adopt real-time data historians and lab-information links. In turn, the Industry 4.0 market size for SaaS-based twins, historians, and analytics tools is widening faster than hardware budgets, underscoring a secular transition toward data-driven operations within the Industry 4.0 industry.
Complete Report Scope:
- By Technology Type
- Industrial Robotics
- Industrial Internet of Things (IIoT)
- Artificial Intelligence and Machine Learning
- Blockchain
- Extended Reality (AR/VR/MR)
- Digital Twin
- 3D Printing / Additive Manufacturing
- Edge Computing and Private 5G
- By Component
- Hardware
- Software / Platforms
- Services (Integration, Consulting, Support)
- By Deployment Model
- On-Premises
- Cloud
- Hybrid
- By End-User Industry
- Discrete Manufacturing
- Automotive
- Oil and Gas
- Energy and Utilities
- Electronics and Semiconductor Foundry
- Food and Beverage
- Aerospace and Defense
- Healthcare and Pharma
- Logistics and Warehousing
- By Geography
- North America
- United States
- Canada
- Mexico
- South America
- Brazil
- Rest of South America
- Europe
- Germany
- United Kingdom
- France
- Italy
- Spain
- Nordics
- Rest of Europe
- Middle East
- Saudi Arabia
- United Arab Emirates
- Rest of Middle East
- Africa
- South Africa
- Nigeria
- Rest of Africa
- Asia-Pacific
- China
- Japan
- South Korea
- India
- Singapore
- Australia
- Rest of Asia-Pacific
- North America
Geography Analysis
North America commanded 35.13% revenue in 2025, aided by USD 85 billion hyperscaler data-center spending that supplies low-latency compute for simulations and AI workloads. Mexico drew USD 40 billion manufacturing investment in 2025 as firms nearshored to cut tariff exposure, a trend bolstering sensor and robotics demand. The U.S. Manufacturing Extension Partnership demonstrated scalable SME adoption, reinforcing that federal technical assistance accelerates digital penetration beyond multinationals. Cybersecurity guidelines from CISA are shaping vendor roadmaps as buyers demand built-in zero-trust controls.
Asia Pacific is forecast to grow at a 21.18% CAGR through 2031, powered by China's USD 1.4 trillion Made in China 2025 agenda, India's USD 26 billion Production-Linked Incentive schemes, and Japan's Society 5.0 policy that aligns digital tools with aging-workforce challenges. South Korea invested USD 15 billion in smart-factory programs in 2025, concentrating on semiconductor and battery-cell lines requiring sub-micron tolerances. Singapore's Smart Industry Readiness Index helped 300 firms benchmark maturity, enabling phased digital rollouts that avoid over-capitalization.
Europe held 22% revenue in 2025, underpinned by Germany's Industrie 4.0 platform and U.K. subsidies. Mittelstand firms ramped digital-twin investment by 42% as SaaS pricing harmonized with cash flows. The European Union's Carbon Border Adjustment Mechanism, effective January 2026, has spurred energy-management installations that log emissions data for tariff compliance. The Middle East, with 4% share, channels spending into remote monitoring for oil and gas, exemplified by Saudi Aramco's upstream deployments. Africa, at 2%, shows early gains in South African automotive plants and Nigerian food processors, although infrastructure gaps and skills shortages limit scale.
- ABB Ltd
- Siemens AG
- Schneider Electric SE
- Rockwell Automation Inc.
- Honeywell International Inc.
- Robert Bosch GmbH
- Emerson Electric Co.
- General Electric Co.
- Cisco Systems Inc.
- Intel Corporation
- Fanuc Corporation
- Denso Corporation
- Mitsubishi Electric Corp.
- Yaskawa Electric Corp.
- PTC Inc.
- SAP SE
- Dassault Systemes SE
- IBM Corp.
- Microsoft Corp.
- Oracle Corp.
Additional Benefits:
- The market estimate (ME) sheet in Excel format
- 3 months of analyst support
TABLE OF CONTENTS
1 INTRODUCTION
- 1.1 Study Assumptions and Market Definition
- 1.2 Scope of the Study
2 RESEARCH METHODOLOGY
3 EXECUTIVE SUMMARY
4 MARKET LANDSCAPE
- 4.1 Market Overview
- 4.2 Market Drivers
- 4.2.1 Favorable Government Initiatives and Multi-Stakeholder Collaborations
- 4.2.2 Surging Demand for Industrial and Collaborative Robotics
- 4.2.3 Rapid SME-Led Digital Transformation Programs
- 4.2.4 Edge and Private 5G Rollouts Enabling Ultra-Low-Latency Factory Networks
- 4.2.5 Decarbonisation Premiums for Smart-Energy, Self-Optimising Plants
- 4.2.6 AI-Powered Generative Design Cutting Prototyping Cost and Time
- 4.3 Market Restraints
- 4.3.1 Uncertain ROI Perception Among Tier-2 and Tier-3 Suppliers
- 4.3.2 Workforce Upskilling and Union Push-Back on Cobot Adoption
- 4.3.3 Cyber-Physical Security Liabilities and Patch-Management Costs
- 4.3.4 Fragmented Interoperability Standards Across Brownfield Assets
- 4.4 Industry Value Chain Analysis
- 4.5 Regulatory Landscape
- 4.6 Technological Outlook
- 4.7 Porter's Five Forces Analysis
- 4.7.1 Bargaining Power of Suppliers
- 4.7.2 Bargaining Power of Buyers
- 4.7.3 Threat of New Entrants
- 4.7.4 Threat of Substitutes
- 4.7.5 Intensity of Competitive Rivalry
- 4.8 Impact of Macroeconomic Factors on the Market
5 MARKET SIZE AND GROWTH FORECASTS (VALUE)
- 5.1 By Technology Type
- 5.1.1 Industrial Robotics
- 5.1.2 Industrial Internet of Things (IIoT)
- 5.1.3 Artificial Intelligence and Machine Learning
- 5.1.4 Blockchain
- 5.1.5 Extended Reality (AR/VR/MR)
- 5.1.6 Digital Twin
- 5.1.7 3D Printing / Additive Manufacturing
- 5.1.8 Edge Computing and Private 5G
- 5.2 By Component
- 5.2.1 Hardware
- 5.2.2 Software / Platforms
- 5.2.3 Services (Integration, Consulting, Support)
- 5.3 By Deployment Model
- 5.3.1 On-Premises
- 5.3.2 Cloud
- 5.3.3 Hybrid
- 5.4 By End-User Industry
- 5.4.1 Discrete Manufacturing
- 5.4.2 Automotive
- 5.4.3 Oil and Gas
- 5.4.4 Energy and Utilities
- 5.4.5 Electronics and Semiconductor Foundry
- 5.4.6 Food and Beverage
- 5.4.7 Aerospace and Defense
- 5.4.8 Healthcare and Pharma
- 5.4.9 Logistics and Warehousing
- 5.5 By Geography
- 5.5.1 North America
- 5.5.1.1 United States
- 5.5.1.2 Canada
- 5.5.1.3 Mexico
- 5.5.2 South America
- 5.5.2.1 Brazil
- 5.5.2.2 Rest of South America
- 5.5.3 Europe
- 5.5.3.1 Germany
- 5.5.3.2 United Kingdom
- 5.5.3.3 France
- 5.5.3.4 Italy
- 5.5.3.5 Spain
- 5.5.3.6 Nordics
- 5.5.3.7 Rest of Europe
- 5.5.4 Middle East
- 5.5.4.1 Saudi Arabia
- 5.5.4.2 United Arab Emirates
- 5.5.4.3 Rest of Middle East
- 5.5.5 Africa
- 5.5.5.1 South Africa
- 5.5.5.2 Nigeria
- 5.5.5.3 Rest of Africa
- 5.5.6 Asia-Pacific
- 5.5.6.1 China
- 5.5.6.2 Japan
- 5.5.6.3 South Korea
- 5.5.6.4 India
- 5.5.6.5 Singapore
- 5.5.6.6 Australia
- 5.5.6.7 Rest of Asia-Pacific
- 5.5.1 North America
6 COMPETITIVE LANDSCAPE
- 6.1 Market Concentration
- 6.2 Strategic Moves
- 6.3 Market Share Analysis
- 6.4 Company Profiles (includes Global Level Overview, Market Level Overview, Core Segments, Financials as Available, Strategic Information, Market Rank/Share for Key Companies, Products and Services, and Recent Developments)
- 6.4.1 ABB Ltd
- 6.4.2 Siemens AG
- 6.4.3 Schneider Electric SE
- 6.4.4 Rockwell Automation Inc.
- 6.4.5 Honeywell International Inc.
- 6.4.6 Robert Bosch GmbH
- 6.4.7 Emerson Electric Co.
- 6.4.8 General Electric Co.
- 6.4.9 Cisco Systems Inc.
- 6.4.10 Intel Corporation
- 6.4.11 Fanuc Corporation
- 6.4.12 Denso Corporation
- 6.4.13 Mitsubishi Electric Corp.
- 6.4.14 Yaskawa Electric Corp.
- 6.4.15 PTC Inc.
- 6.4.16 SAP SE
- 6.4.17 Dassault Systemes SE
- 6.4.18 IBM Corp.
- 6.4.19 Microsoft Corp.
- 6.4.20 Oracle Corp.
7 MARKET OPPORTUNITIES AND FUTURE OUTLOOK
- 7.1 White-Space and Unmet-Need Assessment


