|
시장보고서
상품코드
2124249
교육용 가상현실 시장 : 시장 점유율 분석, 업계 동향 및 통계, 성장 예측(2026-2031년)Virtual Reality In Education - Market Share Analysis, Industry Trends & Statistics, Growth Forecasts (2026 - 2031) |
||||||
 Mordor Intelligence
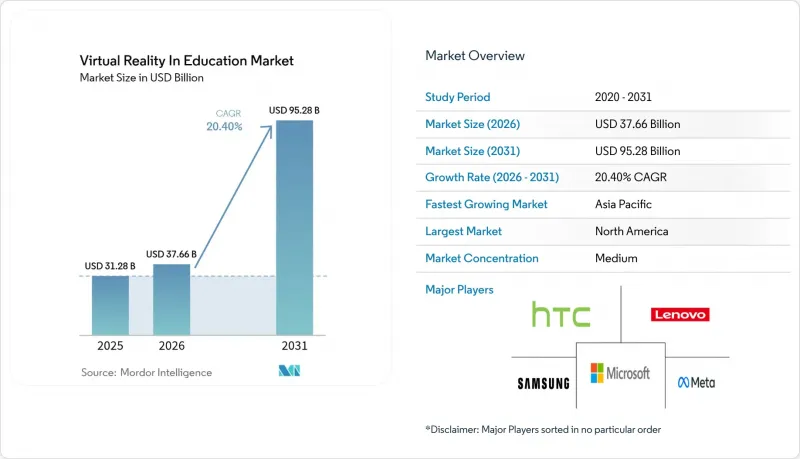
Mordor Intelligence에 의하면, 교육용 가상현실(VR) 시장 규모는 2025년에 312억 8,000만 달러로 평가되었고, 2026년 376억 6,000만 달러에서 2031년까지 952억 8,000만 달러에 이를 것으로 예측되며, 예측 기간(2026-2031년) CAGR은 20.4%를 나타낼 전망입니다.
본 보고서는 구성 요소별(하드웨어, 소프트웨어, 서비스), 최종 사용자별(학술 기관, 기업 대상 교육), 기기 유형별(독립형 헤드셋, 유선 연결형 PC-VR 헤드셋, 기타), 용도 분야별(STEM 및 기술 교육, 의료 및 헬스케어 교육, 기타), 지역별(북미, 기타)로 분류되어 있습니다. 시장 예측은 금액(달러) 기준으로 제시되어 있습니다.
세계의 교육용 가상현실 시장 동향 및 인사이트
상호작용적이고 개인화된 학습에 대한 수요 증가
교육 기관은 다양한 학습 스타일에 적응하는 몰입형 수업을 점점 더 중시하고 있으며, 조사에 따르면 VR 학습자는 교실 내 학습 그룹에 비해 자신감이 275% 높아지고, 과정을 4배 더 빨리 이수하는 것으로 나타났습니다. 대학들은 현재 VR 커리큘럼에서 디자인 사고 기술이 부족하다고 지적하고 있으며, 기술적 엄밀성과 교육학을 융합한 제공업체에게 새로운 기회가 열리고 있습니다. AI 기반 엔진은 각 학습자에 맞추어 컨텐츠를 최적화합니다. 예를 들어, zSpace의 ‘Career Coach AI’는 지역 노동 시장 데이터와 개인의 학습 경로를 대조합니다. 또한, 통제된 가상 환경은 정서적 장애를 가진 학생의 불안을 완화하는 동시에 학습 정착율을 높입니다. 학습자 중심 모델이 주류를 이루면서, 교육 분야의 VR 시장은 성과 향상을 목표로 하는 교육 기관에게 핵심 인프라로 자리 잡고 있습니다.
참여도 향상에 따른 이해관계자의 수용도 증대
정량화된 성과가 교육 관리자, 학부모, 기업의 학습·개발(L&D) 담당자들의 마음을 움직이고 있습니다. 간호 프로그램의 경우, VR로 시나리오를 실시했을 때 참여율이 95%에 달하는 반면, 기존 실습실에서는 15%에 그치고 있습니다. 제조 기업에서는 VR을 활용한 안전 훈련 실시 후, 직장에서의 부상 건수가 43% 감소했다고 보고되고 있습니다. 수학 수업에서는 학생들이 추상적인 개념을 명확히 하는 3D 객체를 조작함으로써 학습 참여도가 비약적으로 높아지고 있습니다. 13개 대학과 협력하는 Meta의 프로그램은 교육 기관의 신뢰를 뒷받침하며, 동종 업계의 다른 학교들이 이를 도입하도록 촉진하는 모범 사례를 만들어내고 있습니다. 이러한 성과는 교육 분야의 VR 시장에서 투자와 수용의 선순환을 만들어내고 있습니다.
교육 과정에 부합하는 고품질 VR 컨텐츠의 부족
많은 애플리케이션이 교육 효과보다 오락성을 우선시하고 있기 때문에 특히 영어권 이외 시장에서는 교육자들이 학습 기준에 부합하는 교재를 확보하지 못하고 있습니다. 교사들은 평가 도구나 구성주의적 기법이 통합된 VR 모듈을 찾는 데 어려움을 겪고 있으며, 하드웨어는 구할 수 있음에도 불구하고 도입이 저해되고 있습니다. 의료 등 전문 분야에서는 규제 준수가 필요하지만, 검증된 시나리오 공급은 여전히 부족한 상황입니다. 피어슨(Pearson)과 XR 부트캠프(XR Bootcamp)간의 제휴와 같은 사례는 초기 진전을 보여주고 있지만, 전 세계적인 수요를 충족시키기에는 부족합니다. 컨텐츠 라이브러리가 확대되기 전까지는 교육 분야 VR 시장의 성장이 그 기반이 되는 하드웨어의 성능을 따라잡지 못할 것으로 보입니다.
부문 분석
2025년, 학교 및 연수 센터에서의 기기 도입 확대에 힘입어 하드웨어는 교육 분야 VR 시장 점유율의 60.72%를 차지했습니다. 그러나 교육 기관들이 컨텐츠, 기기 관리, 분석 기능을 한데 묶은 구독형 패키지를 선호하는 경향이 있어, 서비스 부문은 연평균 성장률(CAGR) 22.2%의 속도로 성장할 전망입니다. 서비스와 관련된 교육용 VR 시장 규모는 2031년경에는 소프트웨어 매출을 넘어설 것으로 예측됩니다. 스탠드얼론형 헤드셋의 가격이 저렴하기 때문에 하드웨어의 중요성은 여전히 높지만, 플랫폼 벤더들은 이미 지속적인 업데이트를 번들로 제공하고 있어 이로 인해 교체 주기가 단축되고 있습니다.
또한, 구독 모델은 예산이 제한된 학군에 있어 설비 투자의 장벽을 완화합니다. ArborXR의 학습 분석으로의 전환과 zSpace의 AI 기반 지도 도구는 벤더들이 하드웨어 기반의 입지를 지속적인 수익을 창출하는 생태계로 전환하고 있음을 보여줍니다. 교육 설계를 개선하는 교육 및 컨설팅 서비스는 현재 제안 요청서(RFP)에서 중요한 요소로 자리 잡고 있습니다. 이러한 추세는 성과 기반 조달로의 전환을 나타내며, 교육 분야 VR 시장 전체의 지속적인 수익원을 강화하고 있습니다.
교육 분야 VR 시장의 64.62%는 여전히 교육 기관이 차지했으며, 이는 K-12 및 대학의 초기 보조금 지원 시범 사업을 반영한 것입니다. 한편, 기업용 교육은 안전, 규정 준수, 고객 서비스와 같은 시나리오에서 측정 가능한 ROI에 힘입어 연평균 성장률(CAGR) 22.9%로 확대되고 있습니다. 교육용 가상현실 시장에서 기업 부문이 차지하는 규모는 2031년까지 교육 기관과 동등한 수준에 도달할 것으로 예측됩니다. 의료 및 광업 분야의 기업에서는 몰입형 프로그램을 도입한 후 오류가 40% 이상 감소하고 투자 회수 기간이 단축되었습니다.
기업들은 소프트 스킬 및 제품 지식 모듈을 중시하고 있으며, 이는 래피드 오서링 툴 및 분석 기능과의 통합에 대한 수요를 촉진하고 있습니다. 학술 부문의 성장은 지속되고 있으나, 예산 주기나 커리큘럼 승인 절차와 같은 과제에 직면해 있습니다. 벤더 입장에서는 두 부문 모두를 아우르는 다양한 포트폴리오를 구축하는 것이 교육 분야 VR 시장의 경제적 변동성에 대한 저항력을 높이는 데 기여할 것입니다.
지역별 분석
북미는 탄탄한 보조금 프로그램과 성숙한 EdTech 생태계 덕분에 2025년 매출의 38.95%를 차지했습니다. 정부가 지원한 2억 7,700만 달러 규모의 혁신 보조금은 몰입형 대수학 도구에 할당된 반면, 미국 국립과학재단(NSF)은 연구 개발(R&D)에 2,500만 달러를 투자하여 대학과의 제휴를 촉진하고 있습니다. 기업 내 도입은 의료, 소매, 숙련 기술직 부문으로 확대되고 있으며, Interplay Learning과 같은 기업들은 인력 부족에 대응하기 위해 VR 모듈을 확대되고 있습니다. 이러한 요인으로 인해 교육 분야의 가상현실 시장은 꾸준한 속도로 확대를 이어가고 있지만, 보급이 진행됨에 따라 성장세는 완만해지고 있습니다.
아시아태평양은 2031년까지 21.5%라는 지역별 최고 연평균 성장률(CAGR)을 보일 것으로 전망됩니다. 중국의 각 성에서는 2025년 한 해 동안만 직업 훈련용 VR 실험실 구축을 위해 1,500만 달러가 넘는 입찰이 진행되었으며, 한편 일본의 ‘DX 고등학교’ 제도에서는 디지털화를 위한 시설 업그레이드에 학교당 최대 1,000만 엔이 지원되고 있습니다. 한국의 교육 기관에서는 기술 훈련에 드는 설비 비용을 절감하기 위해 VR을 도입하고 있으며, 이러한 접근 방식은 세계은행 연구진에게도 주목받고 있습니다. 이러한 협력적인 시책이 교실 내 도입을 가속화함에 따라, 교육 분야 VR 시장에서 아시아태평양이 북미와의 격차를 좁힐 태세를 갖추고 있습니다.
유럽에서는 ‘디지털 유럽 프로그램’을 통한 13억 유로의 예산 배분에 더해, 가상 세계 커리큘럼을 포함한 전문 아카데미를 위해 1억 800만 유로가 배정되어 그 혜택을 누리고 있습니다. 스코틀랜드 전역의 지방 자치 단체에서 ‘ClassVR’을 도입한 것은 지역 기관들이 체계적인 조달을 적극적으로 도입하고 있음을 보여줍니다. 남미와 중동의 신흥 시장에서는 하드웨어 가격이 300달러 아래로 떨어짐에 따라 도입이 진행되고 있으나, 인프라 제약으로 인해 당분간 보급은 제한되고 있습니다. 전반적으로 정책의 일관성과 자금 투입의 집중도가 교육 분야 VR 시장의 지역적 보급을 예측하는 주요 요인으로 계속 작용하고 있습니다.
기타 혜택
- 엑셀 형식 시장 예측(ME) 시트
- 3개월간의 애널리스트 지원
자주 묻는 질문
목차
제1장 서론
제2장 조사 방법
제3장 주요 요약
제4장 시장 구도
제5장 시장 규모 및 성장 예측
제6장 경쟁 구도
제7장 시장 기회 및 향후 전망
AJYAccording to Mordor Intelligence, the virtual reality in education market size was valued at USD 31.28 billion in 2025 and estimated to grow from USD 37.66 billion in 2026 to reach USD 95.28 billion by 2031, at a CAGR of 20.4% during the forecast period (2026-2031).
This report is Segmented by Component (Hardware, Software, and Services), End User (Academic Institutions, and Corporate Training), Device Type (Standalone Headsets, Tethered PC-VR Headsets, and More), Application Area (STEM and Technical Education, Medical and Healthcare Training, and More), and Geography (North America, and More). The Market Forecasts are Provided in Terms of Value (USD).
Global Virtual Reality In Education Market Trends and Insights
Rising Demand for Interactive and Personalized Learning
Institutions increasingly value immersive lessons that adapt to diverse learning styles, with studies showing VR learners achieve 275% higher confidence and complete courses four times faster than classroom cohorts. Universities highlight gaps in design-thinking skills within current VR curricula, opening opportunities for providers that combine technical rigor with pedagogy. AI-driven engines tailor content to each learner; zSpace's Career Coach AI, for instance, matches local labor-market data to personalized study pathways Controlled virtual environments also reduce anxiety for students with emotional impairments while boosting retention. As learner-centric models move mainstream, the virtual reality in education market becomes core infrastructure for institutions seeking improved outcomes.
Greater Stakeholder Acceptance from Higher Engagement
Quantified gains are persuading administrators, parents, and corporate L&D heads alike. Nursing programs see 95% participation when scenarios run in VR versus 15% in traditional labs. Manufacturing firms report 43% drops in workplace injuries after VR safety drills. Classroom engagement spikes in mathematics when students manipulate 3-D objects that clarify abstract concepts. Meta's program with 13 universities demonstrates institutional confidence, creating reference sites that spur peer adoption. These outcomes generate a virtuous cycle of investment and acceptance for the virtual reality in education market.
Scarcity of Quality Curriculum-Aligned VR Content
Many applications prioritize entertainment over pedagogy, leaving educators short of materials that match learning standards, especially outside English-speaking markets. Teachers struggle to locate VR modules that embed assessment tools and constructivist methods, hampering adoption despite hardware availability. Specialized domains such as medicine need regulatory compliance, yet the pipeline of validated scenarios remains thin. Partnerships like Pearson-XR Bootcamp illustrate early progress but are insufficient to satisfy global demand. Until content libraries scale, growth of the virtual reality in education market will trail underlying hardware capability.
Other drivers and restraints analyzed in the detailed report include:
- Falling Prices and Ubiquity of Standalone VR Headsets
- Government/Institutional EdTech Funding Post-Pandemic
- Teacher Training Gaps and Pedagogical Resistance
For complete list of drivers and restraints, kindly check the Table Of Contents.
Segment Analysis
Hardware captured 60.72% of the virtual reality in education market share in 2025 on the strength of device rollouts across schools and training centers. However, the services segment is on pace for 22.2% CAGR as institutions favor subscription bundles that bundle content, device management, and analytics. The virtual reality in education market size tied to services is poised to overtake software revenue approaching 2031. Standalone headset affordability keeps hardware relevant, yet platform vendors are already bundling perpetual updates, reducing replacement cycles.
Subscription models also mitigate capital-expenditure barriers for districts with limited budgets. ArborXR's shift into learning analytics and zSpace's AI-powered guidance tools illustrate how vendors convert hardware footholds into recurring-revenue ecosystems. Training and consulting services that improve instructional design now factor prominently in RFPs. These patterns signal a pivot toward outcomes-based procurement, reinforcing recurrent income streams across the virtual reality industry.
Academic institutions still own 64.62% of the virtual reality in education, reflecting early grant-funded pilots across K-12 and universities. Yet corporate training advances at 22.9% CAGR, propelled by measurable ROI in safety, compliance, and customer-service scenarios. The virtual reality in education market size attributable to enterprises is projected to approach parity with academia by 2031. Corporations in healthcare and mining have logged 40%-plus error reductions after immersive programs, shortening payback periods.
Enterprises champion soft-skills and product-knowledge modules, fueling demand for rapid-authoring tools and analytics integrations. Academic growth continues but faces budget cycles and curriculum-approval processes. For vendors, diversified portfolios that address both segments offer resilience against economic swings within the virtual reality industry.
Complete Report Scope:
- By Component
- Hardware
- Software
- Services
- By End User
- Academic Institutions
- K-12 Learning
- Higher Education
- Corporate Training
- IT and Telecom
- Healthcare
- Retail and E-commerce
- Other Corporate Users
- Academic Institutions
- By Device Type
- Standalone Headsets
- Tethered PC-VR Headsets
- Smartphone-Enabled VR
- Mixed-Reality Head-Mounted Displays
- By Application Area
- STEM and Technical Education
- Medical and Healthcare Training
- Language and Arts Learning
- Vocational and Technical Skills
- Soft-Skills and Team Collaboration
- By Geography
- North America
- United States
- Canada
- Mexico
- South America
- Brazil
- Argentina
- Rest of South America
- Europe
- Germany
- United Kingdom
- France
- Spain
- Rest of Europe
- Asia-Pacific
- China
- India
- Japan
- South Korea
- ASEAN
- Rest of Asia-Pacific
- Middle East and Africa
- Middle East
- Saudi Arabia
- United Arab Emirates
- Turkey
- Rest of Middle East
- Africa
- South Africa
- Nigeria
- Kenya
- Rest of Africa
- Middle East
- North America
Geography Analysis
North America retained 38.95% of 2025 revenue thanks to robust grant programs and a mature EdTech ecosystem. The Administration's USD 277 million innovation grants earmark immersive algebra tools, while the National Science Foundation commits USD 25 million to R&D, seeding university partnerships. Corporate uptake spans healthcare, retail, and skilled trades as companies such as Interplay Learning scale VR modules for talent shortages. These forces keep the virtual reality market in education expanding at a healthy clip, though growth moderates as penetration rises.
Asia Pacific is set to log the fastest regional CAGR of 21.5% through 2031. China's provinces issued tenders exceeding USD 15 million for vocational VR labs in 2025 alone, while Japan's DX High School scheme funds up to JPY 10 million per campus for digital upgrades. South Korean institutions deploy VR to cut equipment costs in technical training, an approach highlighted by World Bank researchers. These coordinated policies accelerate classroom integration, positioning Asia Pacific to narrow its gap with North America in the virtual reality in education market.
Europe benefits from the Digital Europe Programme's EUR 1.3 billion allocation and EUR 108 million for specialist academies that include virtual-worlds curricula. Scotland's council-wide ClassVR rollout shows regional bodies embracing systemic procurement. Emerging markets in South America and the Middle East follow as hardware prices dip below USD 300, though infrastructure constraints still curb immediate uptake. Overall, policy alignment and funding density remain the primary predictors of regional traction for the virtual reality in education market.
- Meta Platforms, Inc.
- HTC Corporation
- Lenovo Group Limited
- Samsung Electronics Co., Ltd.
- Microsoft Corporation
- Sony Group Corporation
- Alphabet Inc.
- Pico Technology Co., Ltd.
- Valve Corporation
- Unity Technologies SF
- Epic Games, Inc.
- zSpace, Inc.
- EON Reality, Inc.
- Avantis Systems Ltd.
- Veative Labs Pvt. Ltd.
- Virtalis Holdings Limited
- Nearpod, Inc.
- Labster ApS
- Immerse VR Ltd.
- VictoryXR, Inc.
- Dreamscape Immersive, Inc.
- Alchemy Immersive Limited
Additional Benefits:
- The market estimate (ME) sheet in Excel format
- 3 months of analyst support
TABLE OF CONTENTS
1 INTRODUCTION
- 1.1 Study Assumptions and Market Definition
- 1.2 Scope of the Study
2 RESEARCH METHODOLOGY
3 EXECUTIVE SUMMARY
4 MARKET LANDSCAPE
- 4.1 Market Overview
- 4.2 Market Drivers
- 4.2.1 Rising demand for interactive and personalized learning
- 4.2.2 Greater stakeholder acceptance from higher engagement
- 4.2.3 Falling prices and ubiquity of standalone VR headsets
- 4.2.4 Government/Institutional EdTech funding post-COVID
- 4.2.5 Integration of eye-tracking analytics for adaptive VR
- 4.2.6 WebXR standards lowering total cost of ownership
- 4.3 Market Restraints
- 4.3.1 Scarcity of quality curriculum-aligned VR content
- 4.3.2 High upfront and maintenance costs for institutions
- 4.3.3 Biometric data-privacy concerns in classrooms
- 4.3.4 Teacher training gaps and pedagogical resistance
- 4.4 Regulatory Landscape
- 4.5 Technological Outlook
- 4.6 Industry Value Chain Analysis
- 4.7 Porter's Five Forces Analysis
- 4.7.1 Bargaining Power of Suppliers
- 4.7.2 Bargaining Power of Consumers
- 4.7.3 Threat of New Entrants
- 4.7.4 Threat of Substitutes
- 4.7.5 Intensity of Competitive Rivalry
- 4.8 Pricing Analysis - VR App Distribution and Pricing Models
- 4.9 Key Use-Cases and Implementation Case Studies
- 4.9.1 China's classroom roll-out programmes
- 4.9.2 Corporate VR training for service standardisation
- 4.9.3 Virtual field trips (e.g., Google Expeditions)
- 4.10 Assessment of Macroeconomic Factors on the Market
- 4.11 Investment Analysis
5 MARKET SIZE AND GROWTH FORECASTS (VALUE)
- 5.1 By Component
- 5.1.1 Hardware
- 5.1.2 Software
- 5.1.3 Services
- 5.2 By End User
- 5.2.1 Academic Institutions
- 5.2.1.1 K-12 Learning
- 5.2.1.2 Higher Education
- 5.2.2 Corporate Training
- 5.2.2.1 IT and Telecom
- 5.2.2.2 Healthcare
- 5.2.2.3 Retail and E-commerce
- 5.2.2.4 Other Corporate Users
- 5.2.1 Academic Institutions
- 5.3 By Device Type
- 5.3.1 Standalone Headsets
- 5.3.2 Tethered PC-VR Headsets
- 5.3.3 Smartphone-Enabled VR
- 5.3.4 Mixed-Reality Head-Mounted Displays
- 5.4 By Application Area
- 5.4.1 STEM and Technical Education
- 5.4.2 Medical and Healthcare Training
- 5.4.3 Language and Arts Learning
- 5.4.4 Vocational and Technical Skills
- 5.4.5 Soft-Skills and Team Collaboration
- 5.5 By Geography
- 5.5.1 North America
- 5.5.1.1 United States
- 5.5.1.2 Canada
- 5.5.1.3 Mexico
- 5.5.2 South America
- 5.5.2.1 Brazil
- 5.5.2.2 Argentina
- 5.5.2.3 Rest of South America
- 5.5.3 Europe
- 5.5.3.1 Germany
- 5.5.3.2 United Kingdom
- 5.5.3.3 France
- 5.5.3.4 Spain
- 5.5.3.5 Rest of Europe
- 5.5.4 Asia-Pacific
- 5.5.4.1 China
- 5.5.4.2 India
- 5.5.4.3 Japan
- 5.5.4.4 South Korea
- 5.5.4.5 ASEAN
- 5.5.4.6 Rest of Asia-Pacific
- 5.5.5 Middle East and Africa
- 5.5.5.1 Middle East
- 5.5.5.1.1 Saudi Arabia
- 5.5.5.1.2 United Arab Emirates
- 5.5.5.1.3 Turkey
- 5.5.5.1.4 Rest of Middle East
- 5.5.5.2 Africa
- 5.5.5.2.1 South Africa
- 5.5.5.2.2 Nigeria
- 5.5.5.2.3 Kenya
- 5.5.5.2.4 Rest of Africa
- 5.5.5.1 Middle East
- 5.5.1 North America
6 COMPETITIVE LANDSCAPE
- 6.1 Market Concentration
- 6.2 Strategic Moves
- 6.3 Market Share Analysis
- 6.4 Company Profiles (includes Global level Overview, Market level overview, Core Segments, Financials as available, Strategic Information, Market Rank/Share for key companies, Products and Services, and Recent Developments)
- 6.4.1 Meta Platforms, Inc.
- 6.4.2 HTC Corporation
- 6.4.3 Lenovo Group Limited
- 6.4.4 Samsung Electronics Co., Ltd.
- 6.4.5 Microsoft Corporation
- 6.4.6 Sony Group Corporation
- 6.4.7 Alphabet Inc.
- 6.4.8 Pico Technology Co., Ltd.
- 6.4.9 Valve Corporation
- 6.4.10 Unity Technologies SF
- 6.4.11 Epic Games, Inc.
- 6.4.12 zSpace, Inc.
- 6.4.13 EON Reality, Inc.
- 6.4.14 Avantis Systems Ltd.
- 6.4.15 Veative Labs Pvt. Ltd.
- 6.4.16 Virtalis Holdings Limited
- 6.4.17 Nearpod, Inc.
- 6.4.18 Labster ApS
- 6.4.19 Immerse VR Ltd.
- 6.4.20 VictoryXR, Inc.
- 6.4.21 Dreamscape Immersive, Inc.
- 6.4.22 Alchemy Immersive Limited
7 MARKET OPPORTUNITIES AND FUTURE OUTLOOK
- 7.1 White-space and Unmet-Need Assessment