
|
시장보고서
상품코드
2124269
제로 트러스트 보안 시장 : 시장 점유율 분석, 업계 동향 및 통계, 성장 예측(2026-2031년)Zero Trust Security - Market Share Analysis, Industry Trends & Statistics, Growth Forecasts (2026 - 2031) |
||||||
 Mordor Intelligence
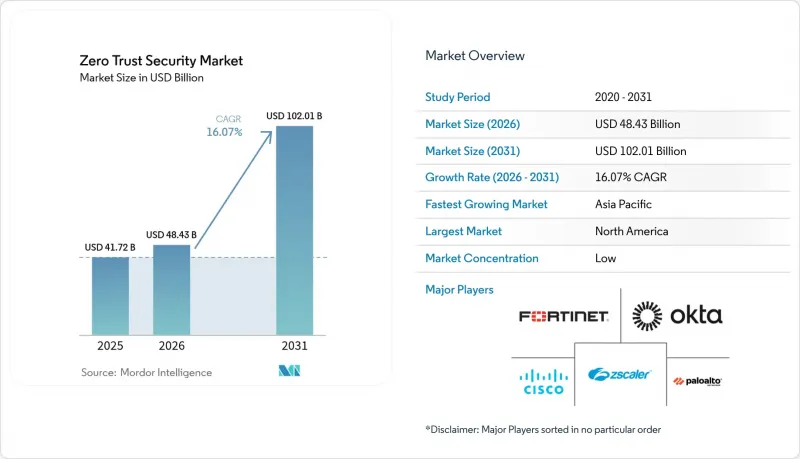
Mordor Intelligence에 의하면, 제로 트러스트 보안 시장 규모는 2025년 417억 2,000만 달러로 평가되었고, 2026년에는 484억 3,000만 달러로 추정되고, 2026-2031년 CAGR 16.07%로 성장할 전망이며, 2031년에는 1,020억 1,000만 달러에 달할 것으로 예측됩니다.
본 보고서는 제공 형태별(솔루션 및 서비스), 도입 형태별(온프레미스 및 클라우드), 조직 규모별(중소기업 및 대기업), 인증 유형별(단일 요소 인증 및 다중 요소 인증), 최종 사용자 산업별(IT 및 통신, 은행, 금융서비스 및 보험(BFSI), 제조업 등) 및 지역별로 분류되어 있습니다. 시장 예측은 금액(달러) 기준으로 제시되어 있습니다.
세계의 제로 트러스트 보안 시장 동향 및 인사이트
데이터 침해 건수 증가
2024년에는 제로데이 취약점이 3배 증가했으며, 92%의 산업에서 전체 침해 사고의 3분의 1을 랜섬웨어가 차지했습니다. 사고의 68%는 인적 요인에 기인한 것으로, 기업들은 내부 침해를 전제로 한 지속적인 검증 체계를 도입해야 하는 상황에 직면해 있습니다. 제3자 취약점은 68% 증가하여, 조직들은 제로 트러스트 원칙을 공급업체로까지 확대 적용할 수밖에 없게 되었습니다. 내부자에 의한 위협은 금융 기관에 건당 평균 1,620만 달러의 손해를 초래하고 있습니다. 따라서 데이터 침해로 인한 경제적 영향을 고려할 때, 고액의 사후 대응보다는 제로 트러스트 대책에 대한 예방적 투자가 유리합니다.
원격/하이브리드 근무의 확대
영구적인 원격 근무의 확산으로 인해 VPN을 중심으로 한 접근 방식은 더 이상 효과적이지 않게 되었습니다. 제로 트러스트 아키텍처를 도입한 조직에서는 사고 대응 시간이 83% 단축되었고, 침해 성공률이 80% 감소했습니다. NTT DATA의 도입 사례에서는 30일 만에 5만 명의 사용자를 연결하여 클라우드를 통한 확장성을 입증했습니다. 원격 브라우저 분리 도구는 생산성을 저해하지 않으면서 분산된 직원을 더욱 보호하고, 제로 트러스트 네트워크 액세스에 대한 지속적인 수요를 뒷받침하고 있습니다.
레거시 시스템 통합의 과제
수십년전의 용도는 최신 인증 기능을 갖추지 못한 경우가 많아, 그 결과 도입 일정을 연장시키는 맞춤형 커넥터의 사용을 피할 수 없습니다. 의료시설에서는 보안을 고려하지 않고 구축된 네트워크 연결 의료기기의 개량에 어려움을 겪고 있습니다. 제조업 분야에서도 가동 시간이 보안보다 우선시되는 운영 기술(OT) 분야에서 유사한 제약에 직면해 있습니다. 사전 구성된 통합 솔루션을 제공하는 벤더는 이러한 과제를 완화하고 프로젝트의 투자 회수 기간을 단축합니다.
부문 분석
솔루션은 2025년 매출의 66.55%를 차지했으며, 통합된 정책 엔진과 분석 대시보드를 통해 제로 트러스트 보안 시장의 기반을 뒷받침하고 있습니다. 그러나 기업들이 하이브리드 환경 전반에 걸친 아키텍처의 설계, 도입, 미세 조정을 파트너에 의존함에 따라 서비스 부문은 연평균 성장률(CAGR) 19.05%로 성장하고 있습니다.
전문 서비스는 전략의 지침이 되며, 관리형 서비스는 인력을 대폭 늘리지 않고도 지속적인 최적화를 실현합니다. Cimpress의 세계 액세스 제어 혁신과 같은 주목할 만한 도입 사례는 기술 혁신과 병행하여 필요한 조직적 변화 관리를 부각시키며, 제로 트러스트 보안 시장이 서비스 주도형 가치 제공으로 계속 전환되고 있는 이유를 설명합니다.
온프레미스 솔루션은 2025년 지출의 53.85%를 차지했으며, 이는 규제 대상 워크로드가 여전히 기업 데이터센터 내에 남아 있음을 반영합니다. 연평균 성장률(CAGR) 19.66%로 성장하고 있는 클라우드 도입은 즉각적인 확장성과 간소화된 업데이트를 원하는 기업들을 끌어들이고 있습니다.
하이브리드 모델이 주류를 이루고 있습니다. 기밀 데이터는 온프레미스에 보관되며, SaaS 게이트웨이가 ID 관리와 정책 로직을 관리합니다. 규정 준수 프레임워크가 클라우드 상의 데이터 저장에 대한 관리를 인정하는 방향으로 진화함에 따라, 클라우드 모델과 관련된 제로 트러스트 보안 시장 규모는 급속히 확대되어 예측 기간 동안 온프레미스형과의 격차가 좁혀질 것으로 예측됩니다.
지역별 분석
북미는 성숙한 규제, 광범위한 클라우드 도입 및 벤더 집중으로 인해 2025년 매출의 34.72%를 차지했습니다. 연방 정부의 의무화 조치로 인해 정부 기관과 계약업체들은 일관된 아키텍처로의 전환을 강요받고 있는 반면, 뉴욕과 토론토의 금융 허브에서는 다른 산업 분야로도 파급될 수 있는 참고할 만한 도입 사례가 나타나고 있습니다. 그러나 클라우드 네이티브 신생 기업들이 가격 및 자동화 측면에서 기존 기업들에 도전장을 내밀면서 경쟁 압력은 더욱 거세지고 있습니다.
아시아태평양은 2031년까지 18.63%라는 가장 높은 연평균 성장률(CAGR)을 보일 것으로 전망됩니다. 싱가포르에서 일본에 이르는 각국 정부는 제로 트러스트 원칙을 반영한 사이버 보안 로드맵을 수립하고 있으며, 이를 통해 기업들은 기존의 방화벽을 넘어 클라우드를 통해 제공되는 제어 수단을 채택할 수 있게 되었습니다. 제조업 집적지에서는 IT와 OT가 융합된 환경을 보호하기 위해 마이크로 세분화이 활용되고 있으며, 이로 인해 해당 지역의 제로 트러스트 보안 시장은 더욱 확대되고 있습니다.
유럽에서의 꾸준한 진전은 개인정보 보호형 아키텍처를 권장하는 GDPR(EU 개인정보보호규정) 및 부문별 지침에 기인합니다. 세밀한 감사 추적 기록과 EU 내 데이터센터를 제공하는 벤더들이 지지를 얻고 있습니다. 한편, 중동 및 아프리카에서는 디지털 정부를 통한 현대화에 대한 자금 투입으로 새로운 가능성이 보이지만, 현지 인력 및 인프라 부족으로 인해 도입은 여전히 더딘 상황입니다.
기타 혜택 :
- 엑셀 형식 시장 전망(ME) 시트
- 3개월간의 애널리스트 지원
자주 묻는 질문
목차
제1장 서론
제2장 조사 방법
제3장 주요 요약
제4장 시장 구도
제5장 시장 규모 및 성장 예측
제6장 경쟁 구도
제7장 시장 기회 및 향후 동향
AJY 26.09.09According to Mordor Intelligence, the zero trust security market size is expected to grow from USD 41.72 billion in 2025 to USD 48.43 billion in 2026 and is forecast to reach USD 102.01 billion by 2031 at 16.07% CAGR over 2026-2031.
This report is Segmented by Offering (Solutions and Services), Deployment Mode (On-Premise and Cloud), Organization Size (Small and Medium Enterprises and Large Enterprises), Authentication Type (Single-Factor and Multi-Factor), End-User Industry (IT and Telecom, BFSI, Manufacturing, and More), and Geography. The Market Forecasts are Provided in Terms of Value (USD).
Global Zero Trust Security Market Trends and Insights
Increasing number of data breaches
Zero-day vulnerabilities tripled in 2024, and ransomware represented one-third of all breaches across 92% of industries. Human factors contributed to 68% of incidents, pressing enterprises to adopt continuous verification that assumes internal compromise. Third-party weaknesses climbed 68%, forcing organizations to extend zero trust principles to suppliers. Insider threats cost financial institutions USD 16.2 million per event on average. Breach economics, therefore, favor preventative spending on zero trust controls over expensive post-incident remediation.
Expansion of remote/hybrid workforces
Permanent remote work invalidates VPN-centric access. Organizations that adopted zero trust architectures saw an 83% cut in incident-response times and an 80% drop in successful breaches. NTT DATA's rollout connected 50,000 users in 30 days, proving cloud-delivered scalability. Remote Browser Isolation tools further protect distributed staff without hindering productivity, fueling sustained demand for zero-trust network access.
Legacy integration hurdles
Decades-old applications often lack modern authentication hooks, forcing custom connectors that extend deployment schedules. Healthcare facilities struggle to retrofit network-enabled medical devices built without security in mind. Manufacturers face similar constraints with operational technology, where uptime trumps security. Vendors that package pre-configured integrations ease friction and shorten project payback.
Other drivers and restraints analyzed in the detailed report include:
- Rising regulatory mandates
- Explosion of machine and API traffic
- High up-front architecture cost
For complete list of drivers and restraints, kindly check the Table Of Contents.
Segment Analysis
Solutions accounted for 66.55% of 2025 revenue, anchoring the zero trust security market through integrated policy engines and analytics dashboards. However, services are rising at a 19.05% CAGR as enterprises rely on partners to design, deploy, and fine-tune architectures across hybrid landscapes.
Professional services guide strategy, while managed offerings deliver continuous optimization without ballooning headcount. High-profile rollouts-such as Cimpress transforming global access controls-underline the organizational change management needed alongside technology shifts, explaining why the zero trust security market continues to pivot toward service-led value delivery.
On-premise solutions preserved 53.85% of 2025 spending, reflecting regulated workloads that remain inside corporate data centers. Cloud deployments, growing at 19.66% CAGR, attract firms seeking instant scalability and simplified updates.
Hybrid patterns dominate: sensitive data stays on-site while SaaS gateways manage identity and policy logic. As compliance frameworks evolve to recognize cloud residency controls, the zero trust security market size attached to cloud models is expected to expand rapidly, narrowing the on-premise lead over the forecast period.
Complete Report Scope:
- By Offering
- Solutions
- Services
- By Deployment Mode
- On-premise
- Cloud
- By Organisation Size
- Small and Medium Enterprises (SMEs)
- Large Enterprises
- By Authentication Type
- Single-Factor
- Multi-Factor
- By End-user Industry
- IT and Telecom
- BFSI
- Manufacturing
- Healthcare
- Energy and Utilities
- Retail and E-commerce
- Government and Defense
- Other End-user Industries
- By Geography
- North America
- United States
- Canada
- Mexico
- South America
- Brazil
- Argentina
- Chile
- Rest of South America
- Europe
- Germany
- United Kingdom
- France
- Italy
- Spain
- Russia
- Rest of Europe
- Asia-Pacific
- China
- India
- Japan
- South Korea
- Australia
- Singapore
- Malaysia
- Rest of Asia-Pacific
- Middle East and Africa
- Middle East
- United Arab Emirates
- Saudi Arabia
- Turkey
- Rest of Middle East
- Africa
- South Africa
- Nigeria
- Rest of Africa
- Middle East
- North America
Geography Analysis
North America secured 34.72% of 2025 revenue through mature regulations, extensive cloud adoption, and vendor density. Federal mandates push agencies and contractors toward consistent architectures, while financial hubs in New York and Toronto showcase reference deployments that ripple across other verticals. Competitive pressure, however, is intensifying as newer cloud-native entrants challenge incumbents on price and automation.
Asia-Pacific commands the fastest CAGR at 18.63% to 2031. Governments from Singapore to Japan enact cybersecurity roadmaps that embed zero trust principles, letting firms leapfrog legacy firewalls in favor of cloud-delivered controls. Manufacturing clusters rely on micro-segmentation to protect converged IT/OT environments, further expanding the zero-trust security market in the region.
Europe's steady progression stems from GDPR and sector-specific directives that favor privacy-preserving architectures. Vendors that provide granular audit trails and EU-based data centers gain traction. Meanwhile, the Middle East and Africa register emerging potential as digital governments fund modernization, though adoption still lags due to limited local skill sets and infrastructure.
- Palo Alto Networks Inc.
- Cisco Systems Inc.
- Zscaler Inc.
- Okta Inc.
- Fortinet Inc.
- CrowdStrike Holdings Inc.
- Check Point Software Tech.
- IBM Corporation
- Akamai Technologies Inc.
- Illumio Inc.
- Appgate Inc.
- Netskope Inc.
- Cloudflare Inc.
- Duo Security LLC
- BeyondTrust Corp.
- CyberArk Software Ltd.
- Ping Identity Corp.
- SailPoint Technologies
- One Identity LLC
- Banyan Security Inc.
- Zero Networks Ltd.
- Elisity Inc.
- Versa Networks Inc.
- Vectra AI Inc.
- Guardicore Ltd. (Cisco Networks)
Additional Benefits:
- The market estimate (ME) sheet in Excel format
- 3 months of analyst support
TABLE OF CONTENTS
1 INTRODUCTION
- 1.1 Study Assumptions and Market Definition
- 1.2 Scope of the Study
2 RESEARCH METHODOLOGY
3 EXECUTIVE SUMMARY
4 MARKET LANDSCAPE
- 4.1 Market Overview
- 4.2 Market Drivers
- 4.2.1 Increasing number of data breaches
- 4.2.2 Expansion of remote/hybrid workforces
- 4.2.3 Rising regulatory mandates
- 4.2.4 Explosion of machine and API traffic
- 4.2.5 Smart-NIC micro-segmentation
- 4.2.6 Identity-network convergence
- 4.3 Market Restraints
- 4.3.1 Legacy integration hurdles
- 4.3.2 High up-front architecture cost
- 4.3.3 Shadow-IT SaaS bypass
- 4.3.4 Supplier data-sharing clauses
- 4.4 Industry Value Chain Analysis
- 4.5 Regulatory Landscape
- 4.6 Technological Outlook
- 4.7 Industry Attractiveness - Porter's Five Forces Analysis
- 4.7.1 Bargaining Power of Suppliers
- 4.7.2 Bargaining Power of Buyers
- 4.7.3 Threat of New Entrants
- 4.7.4 Threat of Substitutes
- 4.7.5 Intensity of Competitive Rivalry
- 4.8 Impact of Macroeconomic Factors on the Market
5 MARKET SIZE AND GROWTH FORECASTS (VALUES)
- 5.1 By Offering
- 5.1.1 Solutions
- 5.1.2 Services
- 5.2 By Deployment Mode
- 5.2.1 On-premise
- 5.2.2 Cloud
- 5.3 By Organisation Size
- 5.3.1 Small and Medium Enterprises (SMEs)
- 5.3.2 Large Enterprises
- 5.4 By Authentication Type
- 5.4.1 Single-Factor
- 5.4.2 Multi-Factor
- 5.5 By End-user Industry
- 5.5.1 IT and Telecom
- 5.5.2 BFSI
- 5.5.3 Manufacturing
- 5.5.4 Healthcare
- 5.5.5 Energy and Utilities
- 5.5.6 Retail and E-commerce
- 5.5.7 Government and Defense
- 5.5.8 Other End-user Industries
- 5.6 By Geography
- 5.6.1 North America
- 5.6.1.1 United States
- 5.6.1.2 Canada
- 5.6.1.3 Mexico
- 5.6.2 South America
- 5.6.2.1 Brazil
- 5.6.2.2 Argentina
- 5.6.2.3 Chile
- 5.6.2.4 Rest of South America
- 5.6.3 Europe
- 5.6.3.1 Germany
- 5.6.3.2 United Kingdom
- 5.6.3.3 France
- 5.6.3.4 Italy
- 5.6.3.5 Spain
- 5.6.3.6 Russia
- 5.6.3.7 Rest of Europe
- 5.6.4 Asia-Pacific
- 5.6.4.1 China
- 5.6.4.2 India
- 5.6.4.3 Japan
- 5.6.4.4 South Korea
- 5.6.4.5 Australia
- 5.6.4.6 Singapore
- 5.6.4.7 Malaysia
- 5.6.4.8 Rest of Asia-Pacific
- 5.6.5 Middle East and Africa
- 5.6.5.1 Middle East
- 5.6.5.1.1 United Arab Emirates
- 5.6.5.1.2 Saudi Arabia
- 5.6.5.1.3 Turkey
- 5.6.5.1.4 Rest of Middle East
- 5.6.5.2 Africa
- 5.6.5.2.1 South Africa
- 5.6.5.2.2 Nigeria
- 5.6.5.2.3 Rest of Africa
- 5.6.5.1 Middle East
- 5.6.1 North America
6 COMPETITIVE LANDSCAPE
- 6.1 Market Concentration
- 6.2 Strategic Moves
- 6.3 Market Share Analysis
- 6.4 Company Profiles (includes Global level Overview, Market level overview, Core Segments, Financials as available, Strategic Information, Market Rank/Share for key companies, Products and Services, and Recent Developments)
- 6.4.1 Palo Alto Networks Inc.
- 6.4.2 Cisco Systems Inc.
- 6.4.3 Zscaler Inc.
- 6.4.4 Okta Inc.
- 6.4.5 Fortinet Inc.
- 6.4.6 CrowdStrike Holdings Inc.
- 6.4.7 Check Point Software Tech.
- 6.4.8 IBM Corporation
- 6.4.9 Akamai Technologies Inc.
- 6.4.10 Illumio Inc.
- 6.4.11 Appgate Inc.
- 6.4.12 Netskope Inc.
- 6.4.13 Cloudflare Inc.
- 6.4.14 Duo Security LLC
- 6.4.15 BeyondTrust Corp.
- 6.4.16 CyberArk Software Ltd.
- 6.4.17 Ping Identity Corp.
- 6.4.18 SailPoint Technologies
- 6.4.19 One Identity LLC
- 6.4.20 Banyan Security Inc.
- 6.4.21 Zero Networks Ltd.
- 6.4.22 Elisity Inc.
- 6.4.23 Versa Networks Inc.
- 6.4.24 Vectra AI Inc.
- 6.4.25 Guardicore Ltd. (Cisco Networks)
7 MARKET OPPORTUNITIES AND FUTURE TRENDS
- 7.1 White-Space and Unmet-Need Assessment