

|
시장보고서
상품코드
2124378
학생 정보 시스템 시장 : 점유율 분석, 업계 동향과 통계, 성장 예측(2026-2031년)Student Information System - Market Share Analysis, Industry Trends & Statistics, Growth Forecasts (2026 - 2031) |
||||||
 Mordor Intelligence
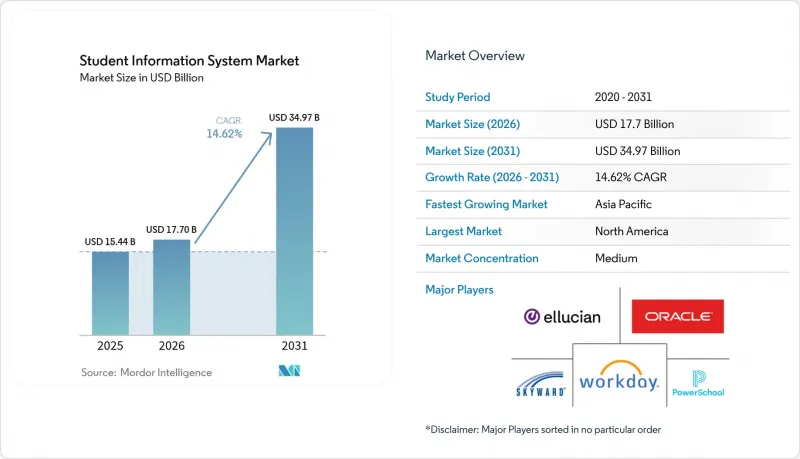
Mordor Intelligence에 의하면, 학생 정보 시스템 시장 규모는 2025년에 154억 4,000만 달러로 평가되었고 2026년 177억 달러에서 2031년까지 349억 7,000만 달러에 이를 것으로 예측되며, 예측 기간(2026-2031년) CAGR은 14.62%를 나타낼 전망입니다.

본 보고서는 유형별(솔루션 및 서비스), 최종 사용자별(K-12 교육 및 고등교육), 배포 방식별(On-Premise 및 클라우드),기관 규모별(학생 수 5,000명 이하(소규모), 5,001-2만 명(중규모), 2만 명 초과(대규모)) 및 지역별로 분류되어 있습니다. 시장 예측은 금액(달러) 기준으로 제시되어 있습니다.
전 세계 학생 정보 시스템 시장 동향 및 인사이트
‘클라우드 퍼스트’ 디지털 전환 추진의 확대
각 교육 기관은 통합된 데이터 기반, 실시간 분석, 원활한 연동을 실현하기 위해 클라우드 네이티브 SIS 플랫폼으로 전면적으로 전환하고 있습니다. 웨스턴 시드니 대학교는 10개 캠퍼스에 걸쳐 있는 4만 5,000명의 학생을 지원하기 위해 여러 용도를 Ellucian Banner로 통합하고, 분산되어 있던 On-Premise 시스템을 단일 클라우드 환경으로 대체했습니다. 그 후, 라번 대학교는 동일한 클라우드 스택에 AI를 도입함으로써 데이터 다운로드 속도를 50% 향상시켰습니다. 클라우드 보급률은 이미 72.6%에 달했으며, 많은 교육 기관은 현재 하이브리드 모델을 불필요한 복잡성으로 간주하고 있습니다. 또한 클라우드 아키텍처는 레거시 시스템으로는 감당할 수 없는 영역인 예측 분석의 기반도 마련합니다. 그 결과, 벤더들은 지속적인 혁신에 자금을 지원하는 구독 모델로 전환하고 있으며, 고객은 자동 업데이트와 더욱 견고한 보안 체계의 혜택을 누리고 있습니다.
종합적인 데이터 기반 학생 성공 분석의 필요성
대학들은 사후 대응형 학생 지원에서 예측 모델링을 통한 적극적인 개입으로 전환하고 있습니다. 조지아 주립대학교는 예측 알림을 활용하여 졸업률을 향상시켰고, 켄튀르키예 대학교는 SIS(학생 정보 시스템)에서 얻은 인사이트력을 활용하여 위험에 처한 학습자를 식별하고 지원했습니다. 이러한 가치를 이끌어내기 위해 듀크 대학교는 직원들이 대시보드를 효과적으로 해석할 수 있도록 온라인 데이터 분석 교육 과정을 개설했습니다. 최신 플랫폼에서는 학업 성적, 행동 징후, 재정 데이터가 통합되어 각 학습자에 대한 360도 전방위적 관점을 제공합니다. 이러한 변화로 인해 학생 정보 시스템 시장은 교육 기관의 자원 배분, 재정 지원 대상 선정, 커리큘럼 설계의 지침이 되는 전략적 분석의 기반으로 변모하고 있습니다.
교육 직원의 역량과 변화 관리의 격차
플랫폼의 급속한 진화에는 데이터 리터러시와 프로세스 재설계 기술이 요구되지만, 많은 교육 기관에서는 이러한 역량이 부족합니다. 듀크 대학교의 직원 연수 프로그램은 지식 격차를 해소하는 데 필요한 투자를 여실히 보여주고 있습니다. 수작업에 익숙한 직원들 사이에서는 자동화된 워크플로우에 대한 거부감이 여전히 남아 있으며, 특히 전문 역량 개발 예산이 제한적인 소규모 학교에서 두드러집니다. 기술 향상이 이루어지지 않으면 교육 기관은 첨단 기능을 충분히 활용하지 못하게 되어 투자 대비 효과가 떨어지고, 구식 프로세스에 대한 의존이 장기화될 것입니다. 이러한 제약으로 인해 학생 정보 시스템 시장 전반, 특히 인적 자원이 제한된 환경에서 클라우드로의 전환이나 기능 도입이 지연되고 있습니다.
부문 분석
2025년에는 교육 기관들이 풀스택 플랫폼으로의 표준화를 추진하는 가운데, 솔루션 부문이 매출의 67.80%를 차지했습니다. PowerSchool이 4만 명의 학생을 대상으로 90일 만에 도입을 완료한 사례는 벤더들이 도입 툴킷을 정교화하고 일정을 단축하고 있음을 여실히 보여줍니다. 서비스 부문은 지출의 32.20%에 그치지만, 고급 기능을 활용하기 위해 각 캠퍼스가 설정, 교육, 분석에 대한 전문 지식을 필요로 하고 있기 때문에 연평균 성장률(CAGR) 16.1%로 성장하고 있습니다. 턴키 솔루션의 지속적인 매력이 산업 재편을 촉진하고 있으며, 플랫폼 주요 기업들은 수직적 기능을 강화하고 지원 팀을 확대하기 위해 지역 특화 전문 기업을 인수하고 있습니다. 동시에 서비스 부문은 기본적인 도입에서 지속적인 최적화, 데이터 사이언스 컨설팅, AI 모델 튜닝으로 진화하고 있습니다. 이러한 공생 관계를 통해 라이선스 비용 이외의 수익원을 창출하는 벤더와 고객 간의 장기적인 파트너십이 구축되어 학생 정보 시스템 시장이 확대되고 있습니다.
고등교육 부문은 복잡한 기능 요구 사항과 평균 계약 규모가 크기 때문에 2025년에도 58.20%의 점유율을 유지했습니다. 그러나 팬데믹 이후의 디지털화 보조금으로 인해 K-12(유치원부터 고등학교까지) 부문 수요가 급증하여, 2031년의 연평균 성장률(CAGR)은 16.8%를 나타낼 것으로 전망됩니다. 학군 전체의 공동 구매 컨소시엄이 유리한 조건을 협상함에 따라, 고급 기능에 대한 접근성이 널리 보급되고 있습니다. ‘Infinite Campus’는 현재 46개 주에 걸쳐 1,000만 명의 학습자에게 서비스를 제공하며, K-12 부문에서 규모의 경제 효과를 입증하고 있습니다. 한편, 대학은 신입생 수 감소 및 레거시 시스템과의 연동 문제와 같은 과제에 직면해 있어, 이로 인해 전환이 지연되고 있습니다. K-12 부문에서의 도입이 확대됨에 따라, 각 벤더들은 더 어린 학습자 특유의 워크플로우에 맞추어 사용자 경험(UX) 및 규정 준수 모듈을 최적화하고 있으며, 이는 학생 정보 시스템 시장의 이 부문에서 성장세를 더욱 가속화하고 있습니다.
지역별 분석
북미는 탄탄한 IT 예산과 긴밀한 벤더 생태계의 지원에 힘입어 2025년 매출의 37.60%를 차지했습니다. 그러나 각 캠퍼스가 전면적인 교체보다는 기존 시스템 스택의 최적화를 추구함에 따라 지출 증가세는 둔화되고 있습니다. ESSER(교육 지원 구제법) 자금 공급이 중단됨에 따라 K-12 예산에 대한 압박은 커지고 있는 반면, 대학은 입학자 수 변동에 직면하고 있습니다. 그럼에도 불구하고, 이 지역은 여전히 혁신의 시험장이자, 향후 전 세계로 확대될 AI 기반 학생 유지율 향상 모듈의 시범 운영이 이루어지고 있습니다. 아시아태평양은 레거시 시스템의 부담을 피할 수 있는 그린필드형 클라우드 도입의 혜택을 받아, 2031년 연평균 성장률(CAGR)이 16.4%로 가장 빠르게 성장하고 있는 지역입니다. PowerSchool은 지역 수요를 활용하기 위해 5년 이내에 인도 내 직원 수를 2,000명으로 확대할 계획입니다. Tribal Group은 British University Vietnam과 300만 달러 상당의 계약을 체결하며, 신흥 시장에서의 투자 의욕 고조를 여실히 보여주었습니다. 유럽에서는 ‘프라이버시 바이 디자인(Privacy by Design)’을 접목한 플랫폼의 가치를 높이는 GDPR(EU 개인정보보호규정)(일반 데이터 보호 규정) 준수가 원동력이 되어, 꾸준한 도입이 진행되고 있습니다. 캐나다 대서양 연안 지역을 대상으로 한 Ellucian과 Interuniversity Services Inc. 간의 5년 계약은 유럽의 컨소시엄에서도 재현 가능한 국경을 초월한 협력 모델의 좋은 사례가 되고 있습니다. 중동 및 아프리카는 규모 면에서는 뒤처져 있지만, 통신 인프라 구축 프로젝트와 인력 양성을 목적으로 한 교육 시책이 탄력을 받으면서 장기적인 성장 여력이 예상됩니다. 이러한 동향은 전반적으로 학생 정보 시스템 시장의 주요 시장 진출기업들이 채택하고 있는 지역 횡단적 확장 전략을 뒷받침하는 것입니다.
기타 혜택
- 엑셀 형식 시장 예측(ME) 시트
- 3개월간의 애널리스트 지원
자주 묻는 질문
목차
제1장 서론
제2장 조사 방법
제3장 주요 요약
제4장 시장 구도
제5장 시장 규모와 성장 예측
제6장 경쟁 구도
제7장 시장 기회와 향후 동향
JHS 26.09.11According to Mordor Intelligence, the student information system market size was valued at USD 15.44 billion in 2025 and estimated to grow from USD 17.7 billion in 2026 to reach USD 34.97 billion by 2031, at a CAGR of 14.62% during the forecast period (2026-2031).
This report is Segmented by Type (Solutions and Services), End-User (K-12 Education and Higher Education), Deployment Mode (On-Premise and Cloud), Institution Size (<=5, 000 Students (Small), 5, 001-20, 000 Students (Medium), and >20, 000 Students (Large)), and Geography. The Market Forecasts are Provided in Terms of Value (USD).
Global Student Information System Market Trends and Insights
Growing Cloud-First Digital-Transformation Mandates
Institutions are shifting wholesale to cloud-native SIS platforms to gain unified data backbones, real-time analytics, and frictionless integrations. Western Sydney University consolidated multiple applications onto Ellucian Banner to support 45,000 students across 10 campuses, replacing disparate on-premises systems with a single cloud environment. The University of La Verne later increased data-download speed by 50% after layering AI on the same cloud stack. With cloud penetration already at 72.6%, many institutions now deem hybrid models an unnecessary complication. Cloud architectures also lay the groundwork for predictive analytics, an area where legacy systems cannot compete. As a result, vendors are pivoting to subscription models that fund continuous innovation while customers benefit from automatic updates and stronger security postures.
Mandate for Holistic Data-Driven Student-Success Analytics
Universities are migrating from reactive student support toward proactive engagement informed by predictive modelling. Georgia State University improved graduation rates using predictive alerts, and the University of Kentucky used SIS-generated insights to flag and support at-risk learners. To unlock such value, Duke University launched online data-training courses so staff can interpret dashboards effectively. Modern platforms now merge academic records, behavioural signals, and financial data, delivering a 360-degree view of each learner. This shift is transforming the student information system market into a strategic analytics cornerstone that informs institutional resource allocation, financial aid targeting, and curriculum design.
Skills and Change-Management Gaps Among Education Staff
Rapid platform evolution demands data literacy and process redesign skills that many institutions lack. Duke University's staff training programme illustrates the investment needed to close knowledge gaps. Resistance to automated workflows persists among employees accustomed to manual procedures, especially in small schools with limited professional-development budgets. Without upskilling, institutions under-utilise advanced features, diminishing return on investment, and prolonging reliance on obsolete processes. This restraint slows cloud migrations and feature adoption across the student information system market, particularly where staffing resources are thin.
Other drivers and restraints analyzed in the detailed report include:
- Heightened Compliance and Reporting Burdens on Institutions
- Demand for Unified EdTech Stacks and API-Ready SIS Platforms
- Capital-Expenditure Constraints in Low-Income Regions
For complete list of drivers and restraints, kindly check the Table Of Contents.
Segment Analysis
Solutions captured 67.80% revenue in 2025 as institutions standardised on full-stack platforms. PowerSchool's 90-day deployment for 40,000 students underscores how vendors refine implementation toolkits to compress timelines. Services, although only 32.20% of spend, are compounding at 16.1% CAGR as campuses need configuration, training, and analytics expertise to unlock advanced features.The lasting appeal of turnkey solutions drives consolidation: platform leaders acquire regional specialists to deepen vertical functionality and scale support teams. Simultaneously, services arms are evolving from basic deployment to continuous optimisation, data-science consulting and AI model tuning. This symbiosis expands the student information system market by embedding long-term vendor-client partnerships that refresh revenue streams beyond licence fees.
Higher Education maintained a 58.20% share in 2025 due to complex feature requirements and larger average deal sizes. Yet post-pandemic digitisation grants have sparked a sharp rise in K-12 demand, propelling a 16.8% CAGR to 2031. District-wide purchasing consortia negotiate favourable terms that democratise access to advanced functionality.Infinite Campus now serves 10 million learners across 46 states, demonstrating the scale benefits in K-12. Conversely, universities face enrolment headwinds and legacy entanglements that slow migrations. As K-12 adoption expands, vendors tailor UX and compliance modules to the unique workflows of younger learners, further accelerating momentum in this segment of the student information system market.
Complete Report Scope:
- By Type
- Solutions
- Services
- By End-user
- K-12 Education
- Higher Education
- By Deployment Mode
- On-Premise
- Cloud
- By Institution Size
- <=5,000 Students (Small)
- 5,001-20,000 Students (Medium)
- >20,000 Students (Large)
- By Geography
- North America
- United States
- Canada
- Mexico
- South America
- Brazil
- Argentina
- Chile
- Rest of South America
- Europe
- Germany
- United Kingdom
- France
- Italy
- Spain
- Russia
- Rest of Europe
- Asia-Pacific
- China
- India
- Japan
- South Korea
- Singapore
- Malaysia
- Australia
- Rest of Asia-Pacific
- Middle East and Africa
- Middle East
- United Arab Emirates
- Saudi Arabia
- Turkey
- Rest of Middle East
- Africa
- South Africa
- Nigeria
- Rest of Africa
- Middle East
- North America
Geography Analysis
North America accounted for 37.60% of 2025 revenue, supported by substantial IT budgets and a dense vendor ecosystem. Yet spending growth is moderating as campuses optimise existing stacks rather than pursue wholesale replacements. The ESSER funding cliff intensifies pressure on K-12 budgets, while universities confront enrolment volatility. Nevertheless, the region remains an innovation test bed, piloting AI-powered retention modules that later roll out globally.Asia-Pacific is the fastest-growing region at a 16.4% CAGR through 2031, benefiting from greenfield cloud deployments that bypass legacy baggage. PowerSchool plans to scale its Indian workforce to 2,000 within five years to capitalise on regional demand. Tribal Group won a USD 3 million AUD contract with British University Vietnam, highlighting rising investment appetite in emerging markets.Europe records steady uptake, driven by GDPR compliance that elevates the value of platforms embedding privacy-by-design. A five-year Ellucian-Interuniversity Services Inc. deal covering Atlantic Canada illustrates cross-border collaboration models that could replicate across European consortia. Middle East and Africa trail in scale but present long-term upside as connectivity projects and workforce-ready education agendas gather momentum. Collectively, these trends reinforce the cross-regional expansion strategy adopted by the major players in the student information system market.
- PowerSchool Holdings Inc.
- Ellucian Company LP
- Oracle Corporation (Student Cloud)
- Workday Inc.
- Skyward Inc.
- Infinite Campus Inc.
- Jenzabar Inc.
- Tribal Group plc
- Unit4 NV
- Instructure Holdings Inc. (Canvas SIS)
- Blackbaud Inc.
- FACTS Management (Nelnet)
- Edupoint Educational Systems
- Senior Systems (Community Brands)
- Rediker Software Inc.
- Gradelink Corporation
- Classe365 Pty Ltd
- OpenEduCat Inc.
- Foradian Technologies
- Octoze Technologies (MyClassCampus)
- Serosoft Solutions (PARENTSALERT)
- Populi Inc.
- Anthology Inc. (CampusNexus Student)
- Alma SIS
- Illuminate Education Inc.
- Hero K12
Additional Benefits:
- The market estimate (ME) sheet in Excel format
- 3 months of analyst support
TABLE OF CONTENTS
1 INTRODUCTION
- 1.1 Study Assumptions and Market Definition
- 1.2 Scope of the Study
2 RESEARCH METHODOLOGY
3 EXECUTIVE SUMMARY
4 MARKET LANDSCAPE
- 4.1 Market Overview
- 4.2 Market Drivers
- 4.2.1 Growing cloud-first digital-transformation mandates
- 4.2.2 Mandate for holistic data-driven student-success analytics
- 4.2.3 Heightened compliance and reporting burdens on institutions
- 4.2.4 Demand for unified EdTech stacks and API-ready SIS platforms
- 4.2.5 Emergence of micro-credentialing/Lifelong-learning models
- 4.2.6 AI-powered predictive retention solutions embedded in SIS
- 4.3 Market Restraints
- 4.3.1 Skills and change-management gaps among education staff
- 4.3.2 Capital-expenditure constraints in low-income regions
- 4.3.3 Heightened data-privacy/residency regulations
- 4.3.4 Vendor lock-in and legacy-migration complexity
- 4.4 Industry Value Chain Analysis
- 4.5 Regulatory Landscape
- 4.6 Technological Outlook
- 4.7 Industry Attractiveness - Porter's Five Forces Analysis
- 4.7.1 Bargaining Power of Suppliers
- 4.7.2 Bargaining Power of Consumers
- 4.7.3 Threat of New Entrants
- 4.7.4 Threat of Substitutes
- 4.7.5 Intensity of Competitive Rivalry
- 4.8 Impact of Macroeconomic Factors on the Market
5 MARKET SIZE AND GROWTH FORECASTS (VALUES)
- 5.1 By Type
- 5.1.1 Solutions
- 5.1.2 Services
- 5.2 By End-user
- 5.2.1 K-12 Education
- 5.2.2 Higher Education
- 5.3 By Deployment Mode
- 5.3.1 On-Premise
- 5.3.2 Cloud
- 5.4 By Institution Size
- 5.4.1 <=5,000 Students (Small)
- 5.4.2 5,001-20,000 Students (Medium)
- 5.4.3 >20,000 Students (Large)
- 5.5 By Geography
- 5.5.1 North America
- 5.5.1.1 United States
- 5.5.1.2 Canada
- 5.5.1.3 Mexico
- 5.5.2 South America
- 5.5.2.1 Brazil
- 5.5.2.2 Argentina
- 5.5.2.3 Chile
- 5.5.2.4 Rest of South America
- 5.5.3 Europe
- 5.5.3.1 Germany
- 5.5.3.2 United Kingdom
- 5.5.3.3 France
- 5.5.3.4 Italy
- 5.5.3.5 Spain
- 5.5.3.6 Russia
- 5.5.3.7 Rest of Europe
- 5.5.4 Asia-Pacific
- 5.5.4.1 China
- 5.5.4.2 India
- 5.5.4.3 Japan
- 5.5.4.4 South Korea
- 5.5.4.5 Singapore
- 5.5.4.6 Malaysia
- 5.5.4.7 Australia
- 5.5.4.8 Rest of Asia-Pacific
- 5.5.5 Middle East and Africa
- 5.5.5.1 Middle East
- 5.5.5.1.1 United Arab Emirates
- 5.5.5.1.2 Saudi Arabia
- 5.5.5.1.3 Turkey
- 5.5.5.1.4 Rest of Middle East
- 5.5.5.2 Africa
- 5.5.5.2.1 South Africa
- 5.5.5.2.2 Nigeria
- 5.5.5.2.3 Rest of Africa
- 5.5.5.1 Middle East
- 5.5.1 North America
6 COMPETITIVE LANDSCAPE
- 6.1 Market Concentration
- 6.2 Strategic Moves
- 6.3 Market Share Analysis
- 6.4 Company Profiles (includes Global level Overview, Market level overview, Core Segments, Financials as available, Strategic Information, Market Rank/Share for key companies, Products and Services, and Recent Developments)
- 6.4.1 PowerSchool Holdings Inc.
- 6.4.2 Ellucian Company LP
- 6.4.3 Oracle Corporation (Student Cloud)
- 6.4.4 Workday Inc.
- 6.4.5 Skyward Inc.
- 6.4.6 Infinite Campus Inc.
- 6.4.7 Jenzabar Inc.
- 6.4.8 Tribal Group plc
- 6.4.9 Unit4 NV
- 6.4.10 Instructure Holdings Inc. (Canvas SIS)
- 6.4.11 Blackbaud Inc.
- 6.4.12 FACTS Management (Nelnet)
- 6.4.13 Edupoint Educational Systems
- 6.4.14 Senior Systems (Community Brands)
- 6.4.15 Rediker Software Inc.
- 6.4.16 Gradelink Corporation
- 6.4.17 Classe365 Pty Ltd
- 6.4.18 OpenEduCat Inc.
- 6.4.19 Foradian Technologies
- 6.4.20 Octoze Technologies (MyClassCampus)
- 6.4.21 Serosoft Solutions (PARENTSALERT)
- 6.4.22 Populi Inc.
- 6.4.23 Anthology Inc. (CampusNexus Student)
- 6.4.24 Alma SIS
- 6.4.25 Illuminate Education Inc.
- 6.4.26 Hero K12
7 MARKET OPPORTUNITIES AND FUTURE TRENDS
- 7.1 White-Space and Unmet-Need Assessment


