|
시장보고서
상품코드
2124403
서비스 통합 및 관리 시장 : 점유율 분석, 업계 동향과 통계, 성장 예측(2026-2031년)Service Integration And Management - Market Share Analysis, Industry Trends & Statistics, Growth Forecasts (2026 - 2031) |
||||||
 Mordor Intelligence
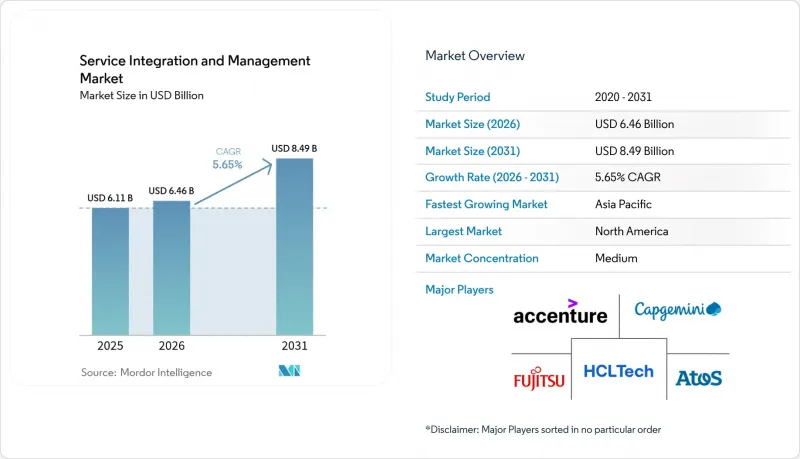
Mordor Intelligence에 의하면, 2026년 세계의 서비스 통합 및 관리 시장 규모는 64억 6,000만 달러로 추정되고 있어 2025년 61억 1,000만 달러에서 확대해, 2031년에는 84억 9,000만 달러에 이를 것으로 예측됩니다.
2026-2031년 기간 동안의 연평균 성장률(CAGR)은 5.65%가 될 것으로 전망됩니다.
본 보고서는 구성 요소별(솔루션 및 서비스), 서비스 모델별(단일 공급자 모델, 하이브리드 공급자 모델, 기타), 배포 모드별(On-Premise, 퍼블릭 클라우드, 기타),조직 규모별(중소기업 및 대기업), 최종 사용자 산업별(은행, 금융서비스 및 보험(BFSI), IT 및 통신, 기타), 지역별로 분류되어 있습니다. 시장 예측은 금액(달러) 기준으로 제시되어 있습니다.
세계 서비스 통합 및 관리 시장 동향과 인사이트
다중 벤더에 의한 IT 아웃소싱의 복잡화
기업은 일반적으로 5-7개의 주요 IT 공급업체에 더해 여러 틈새 벤더를 관리하고 있으며, 이로 인해 기존 방식의 벤더 관리로는 효과적으로 통제할 수 없는 기하급수적으로 증가하는 통합 접점이 발생하고 있습니다. IBM의 2024년 조사에 따르면, 주요 공급업체를 4곳 이상 보유한 조직에서는 운영 오버헤드가 40% 증가하고, 장애 복구 시간이 60-80% 길어지는 것으로 밝혀졌으며, 거버넌스의 파편화에 따른 재무적 위험이 부각되고 있습니다. SIAM 플랫폼은 통합된 가시성, 표준화된 KPI, 분쟁 방지 프로토콜을 확립함으로써 책임 전가를 해소하고, 근본 원인의 식별을 가속화하며, 벤더 생태계 전반에 걸친 규정 준수 감사 추적을 강화합니다.
클라우드 네이티브 마이크로서비스 아키텍처의 급증
2024년에는 쿠버네티스(Kubernetes) 보급률이 96%에 달했으나, 컨테이너화된 워크로드는 On-Premise 클러스터와 여러 퍼블릭 클라우드에 걸쳐 일시적인 서비스 종속성을 야기하고 있습니다. 이러한 유동적인 환경에서 기존 ITSM 카탈로그는 시대에 뒤처지게 되었습니다. 최신 SIAM 솔루션에는 실시간 서비스 검색, 자동화된 종속성 매핑, 조치 중심 오케스트레이션이 통합되어 있어, 마이크로서비스의 규모에 맞추어 성능 기준선을 동적으로 재조정함으로써 빈번한 인프라 변경에도 불구하고 일관된 사용자 경험을 보장합니다.
SIAM 전문 인력 부족
북미와 유럽에서는 SIAM 인력에 대한 수요가 공급을 약 40% 상회하고 있으며, 그 결과 많은 프로그램에서 도입 주기가 18-24개월로 길어지고 있습니다. 유능한 실무자는 ITSM에 대한 깊은 전문 지식, 클라우드 아키텍처에 대한 정통함, 벤더와의 협상력을 모두 갖추고 있지만, 이 모든 것을 겸비한 인재는 드뭅니다. 기업들은 이러한 격차를 해소하기 위해 사내 아카데미를 설립하거나 외부 인증 자격 취득을 지원하고 있지만, 단기적인 인력 부족으로 인해 비용 구조가 부풀어 오르고 가치 실현까지의 시간이 지연되고 있습니다.
부문 분석
컨설팅을 주축으로 하는 변경 관리 프로젝트 덕분에 서비스 부문은 2025년 매출의 58.92%를 차지했습니다. 그러나 플랫폼 중심의 솔루션은 연평균 성장률(CAGR) 6.42%라는 빠른 속도로 확대되고 있으며, 이는 멀티 벤더 생태계가 확장되는 가운데 기업들이 자동화로 무게중심을 옮기고 있음을 보여줍니다. 솔루션용 서비스 통합 및 관리 시장 규모는 2031년까지 36억 4,000만 달러에 달할 것으로 예측됩니다. 이는 희소한 인적 전문 지식에 대한 의존도를 낮추는 사전 구축된 거버넌스 엔진에 대한 강력한 수요를 반영한 것입니다. AI 기반 오케스트레이션 모듈, API 우선 아키텍처, 즉시 사용 가능한 규정 준수 팩은 설정 시간을 단축하고 셀프 서비스 도입을 지원하므로, 지속적인 컨설팅 비용보다 기술 투자가 더 매력적으로 다가오고 있습니다.
기업들은 경량화된 자문 서비스와 구독형 플랫폼을 결합하는 사례가 늘어나고 있으며, 이를 통해 지식 이전과 반복 가능한 자동화를 융합하고 있습니다. 이러한 하이브리드 지출 패턴은 순수한 컨설팅 시간이 아닌, 솔루션 액셀러레이터를 제공하는 시스템 통합사업자의 지속적인 성장을 뒷받침하고 있습니다.
성숙도가 높아짐에 따라 현재의 도입 곡선이 지속된다면, 장기적으로는 솔루션 서비스 통합 및 관리 시장에서의 점유율이 서비스 자체를 넘어설 것으로 전망됩니다.
하이브리드형 제공업체와의 계약은 2025년 매출의 39.20%를 차지하며, 사내 관리와 틈새 기술에 대한 선택적 아웃소싱 간의 균형을 유지하고 있습니다. 그러나 조직이 사내 SIAM 센터 오브 엑설런스를 공식적으로 설립함에 따라, 사내 서비스 통합업체 모델은 다른 모든 경쟁사를 능가하는 속도로 성장하고 있으며, 연평균 성장률(CAGR) 7.29%로 확대되고 있습니다. 그 요인으로는 인증 교육에 대한 접근성 확대, 도구의 복잡성 감소, 서비스 통합이 전략적 핵심 역량이라는 경영진의 인식 등을 들 수 있습니다.
예산 제약과 인력 부족이 두드러지는 부문, 특히 규제가 엄격한 분야의 중견 기업에서는 외부 서비스 통합 업체와의 계약이 여전히 활발합니다. 직원 역량 강화 및 자동화에 대한 지속적인 투자로 인해, 예측 기간 동안 내부 거버넌스의 비중이 높아질 가능성이 있습니다. 이는 제3자 리스크에 대한 보다 엄격한 감독을 요구하는 이사회 차원의 지침과도 부합하는 것입니다.
지역별 분석
북미는 선도 기업의 도입, 풍부한 SIAM 인력, SOX 및 HIPAA와 같은 엄격한 규제 요건의 뒷받침을 받아 2025년에 35.91%의 점유율을 유지하며 리더십 위치를 지켰습니다. 연평균 성장률(CAGR) 5.14%는 기업들이 레거시 시스템을 현대화하고 멀티클라우드 전략을 통합하는 과정에서 투자가 지속되고 있음을 보여줍니다. 성숙한 컨설팅 생태계와 넉넉한 조달 예산이 고도화되고 대규모의 확장을 뒷받침하며, 이 지역이 혁신의 거점으로서의 입지를 공고히 하고 있습니다.
아시아태평양은 가장 빠르게 성장하는 지역으로, 2031년의 연평균 성장률(CAGR)은 6.98%에 달할 전망입니다. 인도, 중국, 주요 아세안(ASEAN) 국가들의 국가 차원 디지털 경제 프로그램이, 기존의 ITSM 프로세스만으로는 대응하기 어려운 다중 벤더(multi-vendor) 변혁 프로젝트를 추진하고 있습니다. 외국인 직접 투자와 하이퍼스케일러에 의한 데이터센터 확장은 서비스 체인을 더욱 복잡하게 만들며, SIAM에 대한 수요를 가속화하고 있습니다. 이미 린(Lean) 운영이 정착된 일본과 한국의 기업들은 현재 DevOps 파이프라인 위에 SIAM을 통합하여, 여러 공급업체에 걸친 책임성을 강화하고 있습니다.
유럽에서는 GDPR(EU 개인정보보호규정), 새로운 AI 규제, 제3자 리스크 요건의 강화에 힘입어 연평균 5.71%라는 꾸준한 성장세를 보이고 있습니다. ISO 20000 인증은 공급업체 간의 기준 통일을 촉진하는 한편, 브렉시트로 인한 데이터 흐름의 불확실성으로 인해 투명한 거버넌스의 필요성이 높아지고 있습니다. 독일과 영국이 도입을 주도하는 한편, 동유럽 기업들은 EU의 조화 목표를 달성하기 위해 도입을 가속화하고 있습니다. 지속가능성 관련 지침에 따라 벤더 평가 기준에 환경 성과라는 측면이 추가되면서, SIAM의 KPI는 비용이나 가동 시간을 넘어 확대되고 있습니다.
기타 혜택
- 엑셀 형식 시장 전망(ME) 시트
- 3개월간의 애널리스트 지원
자주 묻는 질문
목차
제1장 서론
제2장 조사 방법
제3장 주요 요약
제4장 시장 구도
제5장 시장 규모와 성장 예측
제6장 경쟁 구도
제7장 시장 기회와 향후 전망
JHSAccording to Mordor Intelligence, the global service integration and management market size in 2026 is estimated at USD 6.46 billion, growing from 2025 value of USD 6.11 billion with 2031 projections showing USD 8.49 billion, growing at 5.65% CAGR over 2026-2031.
This report is Segmented by Component (Solutions and Services), Service Model (Single-Provider Model, Hybrid-Provider Model, and More), Deployment Mode (On-Premise, Public Cloud, and More), Organization Size (Small and Medium Enterprises and Large Enterprises), End-User Industry (BFSI, IT and Telecom, and More), and Geography. The Market Forecasts are Provided in Terms of Value (USD).
Global Service Integration And Management Market Trends and Insights
Rising Multi-Vendor IT Outsourcing Complexity
Enterprises typically manage 5-7 major IT providers plus multiple niche vendors, generating exponential integration touchpoints that legacy vendor management cannot control effectively. IBM's 2024 study reveals that organizations with four or more primary providers incur 40% higher operational overhead and 60-80% longer outage resolution times, underscoring the financial risks associated with fragmented governance. SIAM platforms establish single-pane visibility, standardized KPIs, and dispute-avoidance protocols that eliminate finger-pointing, accelerate root-cause isolation, and strengthen compliance audit trails across the vendor ecosystem.
Surge in Cloud-Native Microservices Architectures
Kubernetes penetration reached 96% in 2024, yet containerized workloads spawn transient service dependencies spanning on-premises clusters and multiple public clouds. Conventional ITSM catalogs become obsolete in this fluid landscape. Modern SIAM solutions embed real-time service discovery, automated dependency mapping, and policy-driven orchestration that dynamically recalibrates performance baselines as microservices scale, ensuring a consistent user experience despite frequent infrastructure changes.
Shortage of SIAM-Skilled Professionals
The demand for SIAM talent outstrips supply by roughly 40% in North America and Europe, resulting in extended implementation cycles of 18-24 months for many programs. Effective practitioners blend deep ITSM expertise, cloud architecture fluency, and vendor-negotiation acuity capabilities rarely found in a single resource. Enterprises are establishing internal academies and sponsoring external certifications to close the gap, yet near-term capacity constraints inflate cost structures and slow time-to-value.
Other drivers and restraints analyzed in the detailed report include:
- Growing Demand for Unified SLA Governance Platforms
- Acceleration of Digital Transformation in Regulated Industries
- Absence of Global Standardized SLA Frameworks
For complete list of drivers and restraints, kindly check the Table Of Contents.
Segment Analysis
The services tranche accounted for 58.92% of 2025 revenue, thanks to consulting-heavy change-management engagements. However, platform-centric solutions are scaling faster at a 6.42% CAGR, signaling an enterprise pivot toward automation as multi-vendor ecosystems expand. The service integration and management market size for solutions is forecast to hit USD 3.64 billion by 2031, reflecting a strong appetite for pre-built governance engines that lower dependency on scarce human expertise. AI-driven orchestration modules, API-first architectures, and out-of-the-box compliance packs cut configuration time and support self-service onboarding, making technology investments more attractive than ongoing consultancy fees.
Enterprises are increasingly combining lightweight advisory engagements with subscription platforms, thereby blending knowledge transfer and repeatable automation. This hybrid spend pattern underpins sustained growth for system integrators offering solution accelerators rather than pure consulting hours.
As maturity rises, the service integration and management market share of solutions is poised to overtake services in the longer term if current adoption curves persist.
Hybrid-provider arrangements accounted for 39.20% of 2025 revenue, striking a balance between internal stewardship and selective outsourcing for niche skills. Yet the internal service integrator model is outpacing all peers, advancing at a 7.29% CAGR as organizations formalize in-house SIAM centers of excellence. Catalysts include increased access to certified training, declining tooling complexity, and executive recognition that service integration constitutes a strategic core competence.
External service integrator contracts still flourish where budget constraints or talent shortages prevail, particularly among mid-market firms in highly regulated sectors. Nevertheless, continuous investment in workforce upskilling and automation may tilt the mix toward internal governance over the forecast period, aligning with board-level mandates for tighter oversight of third-party risk.
Complete Report Scope:
- By Component
- Solutions
- Business Solutions
- Technology Solutions
- Services
- Solutions
- By Service Model
- Single-Provider Model
- Hybrid-Provider Model
- Internal Service Integrator Model
- External Service Integrator Model
- By Deployment Mode
- On-Premise
- Public Cloud
- Private Cloud
- Hybrid Cloud
- By Organization Size
- Small and Medium Enterprises
- Large Enterprises
- By End-User Industry
- Banking, Financial Services and Insurance (BFSI)
- Information Technology and Telecom
- Healthcare
- Retail
- Manufacturing
- Government and Public Sector
- Other End-User Industries
- By Geography
- North America
- United States
- Canada
- Mexico
- South America
- Brazil
- Argentina
- Rest of South America
- Europe
- Germany
- United Kingdom
- France
- Italy
- Spain
- Rest of Europe
- Asia Pacific
- China
- Japan
- India
- South Korea
- South-East Asia
- Rest of Asia Pacific
- Middle East
- Saudi Arabia
- United Arab Emirates
- Turkey
- Rest of Middle East
- Africa
- South Africa
- Nigeria
- Rest of Africa
- North America
Geography Analysis
North America maintained its leadership position with a 35.91% share in 2025, driven by early-mover enterprise adoption, an abundance of SIAM talent, and stringent regulatory requirements such as SOX and HIPAA. Growth at a 5.14% CAGR indicates sustained investment as companies modernize legacy estates and integrate multi-cloud strategies. Mature consultancy ecosystems and favorable procurement budgets support sophisticated, large-scale rollouts, reinforcing the region's status as an innovation hub.
The Asia Pacific is the fastest-growing region, with a 6.98% CAGR through 2031. National digital economy programs in India, China, and key ASEAN nations are driving multi-vendor transformation projects that overwhelm traditional ITSM processes. Foreign direct investment and hyperscaler data-center expansions further complicate service chains, catalyzing demand for SIAM. Enterprises in Japan and South Korea, already steeped in lean operations, are now layering SIAM on top of DevOps pipelines to enhance cross-provider accountability.
Europe demonstrates consistent annual growth of 5.71%, propelled by the GDPR, emerging AI regulations, and tightening third-party risk requirements. ISO 20000 certification drives baseline alignment across providers, while Brexit-driven data-flow uncertainties heighten the need for transparent governance. Germany and the United Kingdom spearhead adoption, whereas Eastern European enterprises accelerate uptake to meet EU harmonization goals. Sustainability directives are adding an environmental-performance dimension to vendor scorecards, extending SIAM KPIs beyond cost and uptime.
- Accenture plc
- AtoS SE
- Capgemini SE
- Fujitsu Limited
- HCL Technologies Limited
- Hewlett Packard Enterprise Company
- International Business Machines Corporation
- Infosys Limited
- Mindtree Limited
- Tata Consultancy Services Limited
- Wipro Limited
- CGI Inc.
- DXC Technology Company
- NTT Data Corporation
- ServiceNow Inc.
- Sopra Steria Group SA
- Tech Mahindra Limited
- Unisys Corporation
- Rackspace Technology Inc.
- Orange Business Services SA
- Cognizant Technology Solutions Corporation
Additional Benefits:
- The market estimate (ME) sheet in Excel format
- 3 months of analyst support
TABLE OF CONTENTS
1 INTRODUCTION
- 1.1 Study Assumptions and Market Definition
- 1.2 Scope of the Study
2 RESEARCH METHODOLOGY
3 EXECUTIVE SUMMARY
4 MARKET LANDSCAPE
- 4.1 Market Overview
- 4.2 Market Drivers
- 4.2.1 Rising multi-vendor IT outsourcing complexity
- 4.2.2 Surge in cloud-native microservices architectures
- 4.2.3 Growing demand for unified SLA governance platforms
- 4.2.4 Acceleration of digital transformation in regulated industries
- 4.2.5 Hybrid-work operating model adoption
- 4.2.6 Adoption of AIOps for proactive service orchestration
- 4.3 Market Restraints
- 4.3.1 Shortage of SIAM-skilled professionals
- 4.3.2 Absence of global standardised SLA frameworks
- 4.3.3 Legacy toolchain interoperability challenges
- 4.3.4 Perceived loss of direct vendor control by enterprises
- 4.4 Industry Value Chain Analysis
- 4.5 Regulatory Landscape
- 4.6 Technological Outlook
- 4.7 Porter's Five Forces Analysis
- 4.7.1 Bargaining Power of Suppliers
- 4.7.2 Bargaining Power of Consumers
- 4.7.3 Threat of New Entrants
- 4.7.4 Intensity of Competitive Rivalry
- 4.7.5 Threat of Substitutes
- 4.8 Impact of Macroeconomic Factors
5 MARKET SIZE AND GROWTH FORECASTS (VALUE)
- 5.1 By Component
- 5.1.1 Solutions
- 5.1.1.1 Business Solutions
- 5.1.1.2 Technology Solutions
- 5.1.2 Services
- 5.1.1 Solutions
- 5.2 By Service Model
- 5.2.1 Single-Provider Model
- 5.2.2 Hybrid-Provider Model
- 5.2.3 Internal Service Integrator Model
- 5.2.4 External Service Integrator Model
- 5.3 By Deployment Mode
- 5.3.1 On-Premise
- 5.3.2 Public Cloud
- 5.3.3 Private Cloud
- 5.3.4 Hybrid Cloud
- 5.4 By Organization Size
- 5.4.1 Small and Medium Enterprises
- 5.4.2 Large Enterprises
- 5.5 By End-User Industry
- 5.5.1 Banking, Financial Services and Insurance (BFSI)
- 5.5.2 Information Technology and Telecom
- 5.5.3 Healthcare
- 5.5.4 Retail
- 5.5.5 Manufacturing
- 5.5.6 Government and Public Sector
- 5.5.7 Other End-User Industries
- 5.6 By Geography
- 5.6.1 North America
- 5.6.1.1 United States
- 5.6.1.2 Canada
- 5.6.1.3 Mexico
- 5.6.2 South America
- 5.6.2.1 Brazil
- 5.6.2.2 Argentina
- 5.6.2.3 Rest of South America
- 5.6.3 Europe
- 5.6.3.1 Germany
- 5.6.3.2 United Kingdom
- 5.6.3.3 France
- 5.6.3.4 Italy
- 5.6.3.5 Spain
- 5.6.3.6 Rest of Europe
- 5.6.4 Asia Pacific
- 5.6.4.1 China
- 5.6.4.2 Japan
- 5.6.4.3 India
- 5.6.4.4 South Korea
- 5.6.4.5 South-East Asia
- 5.6.4.6 Rest of Asia Pacific
- 5.6.5 Middle East
- 5.6.5.1 Saudi Arabia
- 5.6.5.2 United Arab Emirates
- 5.6.5.3 Turkey
- 5.6.5.4 Rest of Middle East
- 5.6.6 Africa
- 5.6.6.1 South Africa
- 5.6.6.2 Nigeria
- 5.6.6.3 Rest of Africa
- 5.6.1 North America
6 COMPETITIVE LANDSCAPE
- 6.1 Market Concentration
- 6.2 Strategic Moves
- 6.3 Market Share Analysis
- 6.4 Company Profiles (includes Global level Overview, Market level overview, Core Segments, Financials as available, Strategic Information, Market Rank/Share for key companies, Products and Services, and Recent Developments)
- 6.4.1 Accenture plc
- 6.4.2 AtoS SE
- 6.4.3 Capgemini SE
- 6.4.4 Fujitsu Limited
- 6.4.5 HCL Technologies Limited
- 6.4.6 Hewlett Packard Enterprise Company
- 6.4.7 International Business Machines Corporation
- 6.4.8 Infosys Limited
- 6.4.9 Mindtree Limited
- 6.4.10 Tata Consultancy Services Limited
- 6.4.11 Wipro Limited
- 6.4.12 CGI Inc.
- 6.4.13 DXC Technology Company
- 6.4.14 NTT Data Corporation
- 6.4.15 ServiceNow Inc.
- 6.4.16 Sopra Steria Group SA
- 6.4.17 Tech Mahindra Limited
- 6.4.18 Unisys Corporation
- 6.4.19 Rackspace Technology Inc.
- 6.4.20 Orange Business Services SA
- 6.4.21 Cognizant Technology Solutions Corporation
7 MARKET OPPORTUNITIES AND FUTURE OUTLOOK
- 7.1 White-space and Unmet-Need Assessment