
|
시장보고서
상품코드
2124515
데이터 수익화 : 시장 점유율 분석, 업계 동향 및 통계, 성장 예측(2026-2031년)Data Monetization - Market Share Analysis, Industry Trends & Statistics, Growth Forecasts (2026 - 2031) |
||||||
 Mordor Intelligence
데이터 수익화 시장 규모는 2026년에 56억 7,000만 달러에 달하고, 2031년에는 126억 6,000만 달러에 이를 것으로 예측되며, CAGR은 17.41%를 나타낼 전망입니다.
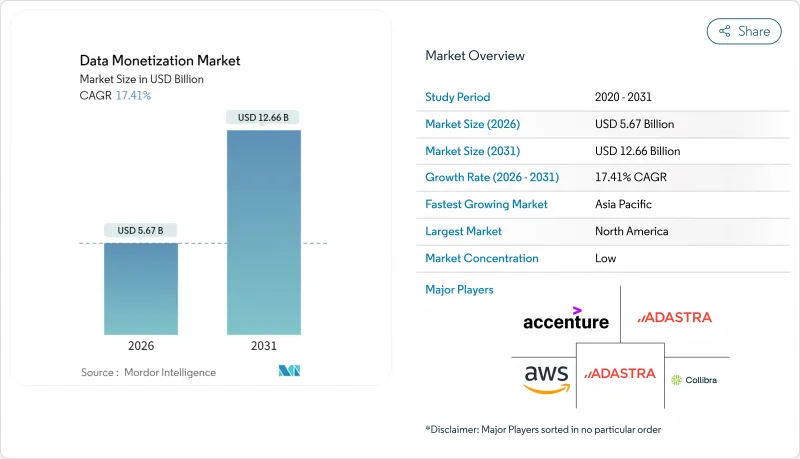
본 보고서는 구성 요소(도구/플랫폼, 서비스), 도입 형태(On-Premise, 클라우드), 조직 규모(대기업, 중소기업), 최종 사용자 산업(은행 및 금융 서비스·보험(BFSI),통신 및 IT, 제조, 헬스케어 및 생명과학, 소매 및 전자상거래 등) 및 지역별로 분류되어 있습니다. 시장 예측은 금액(달러) 기준으로 제시되어 있습니다.
세계의 데이터 수익화 시장 동향 및 인사이트
고급 분석 및 시각화 기술의 급속한 보급
셀프 서비스형 비즈니스 인텔리전스 플랫폼을 통해 원시 데이터 수집부터 수익화 가능한 인사이트를 도출하는 데 걸리는 시간이 대폭 단축되었으며, 제품 관리자나 영업 팀은 중앙 집중식 IT 부서에 의존하지 않고도 분석 기능을 독립적인 서비스로 패키지화할 수 있게 되었습니다. SAP Analytics Cloud 및 Microsoft Power BI는 현재 임베디드 애널리틱스를 지원하고 있으며, 소프트웨어 벤더는 자사 용도 내에 대시보드를 화이트 라벨로 제공하여 텔레메트리 데이터를 지속적인 수익원으로 전환하고 있습니다. MicroStrategy의 HyperIntelligence는 엔터프라이즈 워크플로우 위에 상황에 맞는 지표를 중첩함으로써, 운영 시스템과 분석 콘솔 간 전환에 따른 마찰을 줄여줍니다.
기업 데이터의 양과 다양성 증가
IoT 센서 도입, 엣지 컴퓨팅 어레이 및 API 생태계는 사내 분석 팀의 처리 능력을 초과하는 페타바이트 규모의 데이터 세트를 생성하고 있으며, 기업은 잉여 데이터를 마켓플레이스나 직접 라이선싱을 통해 외부에 제공해야만 하는 상황에 처해 있습니다. 현재 제조 공장에서는 조립 라인에 비전 시스템과 진동 센서를 도입하여 실시간 품질 지표를 생성하고 있습니다. 장비 공급업체는 동종 업계 타사의 공장에 예측 유지보수 구독 서비스를 제공함으로써 이를 수익화하고 있습니다. 통신 사업자는 기지국 간 핸드오버에서 익명화된 이동 패턴을 수집하여, 집계된 데이터 흐름을 도시 계획자나 소매점 입지 선정 담당자에게 판매하고 있습니다.
레거시 아키텍처의 상호 운용성 장벽
기업은 관계형 데이터베이스, 데이터 레이크, SaaS 용도의 사일로, On-Premise 데이터 웨어하우스 등 평균 14개의 서로 다른 데이터 저장소를 운영하고 있으며, 각각 고유한 스키마와 액세스 프로토콜을 가지고 있어 통합을 방해하고 있습니다. 이러한 데이터 소스를 통합된 수익화 계층으로 통합하려면 ETL(추출·변환·로드) 파이프라인, API 게이트웨이 및 의미적 조화가 필요합니다. 이러한 투자는 포춘 500대 기업의 경우 500만 달러를 초과할 수도 있으며, 운영을 시작하기까지 18개월이 소요될 수 있습니다. 전략적 위험 요소로는 통합이 완료될 무렵 데이터 세트 시장 관련성이 떨어지거나 규제 승인이 만료될 가능성이 있다는 점입니다.
부문별 분석
2025년 매출의 64.58%를 도구가 차지했으나, 2026년부터 2031년에 걸쳐서는 서비스가 도구를 추월하여 19.02%의 성장률을 보일 것으로 예측됩니다. 이러한 변화는 기업이 원시 데이터 세트를 판매 가능한 제품으로 변환하기 위한 전문 지식을 구매하고 있음을 나타냅니다. 전문 통합 업체가 거버넌스 프레임워크를 설계하고 마켓플레이스 진출 협상을 진행함으로써 출시까지의 기간이 단축됩니다. 도구군 중에서는 이종 스키마를 통합할 수 있는 데이터 통합 플랫폼이 주류를 이루고 있지만, 노코드 인터페이스를 통해 도입 장벽이 낮아짐에 따라 분석용 프론트엔드의 보급도 가속화되고 있습니다.
매니지드 서비스는 사내에 데이터 엔지니어를 보유하지 않은 중견 기업에게 매력적이며, 설비 투자를 하지 않고도 구독형 데이터 제품을 제공할 수 있게 해줍니다. 기밀 컴퓨팅을 통해 데이터 보관에 대한 우려가 완화됨에 따라, 서비스를 통한 데이터 수익화 시장 규모에 대한 기여도는 확대될 전망입니다. 클라우드 제공업체와 세계 시스템 통합사업자간의 제휴를 통해 서비스 카탈로그는 더욱 확충되고 있습니다. 마이크로소프트의 보고서에 따르면, 2025년에는 Azure Synapse 매출의 40%가 관리형 서비스 채널을 통해 창출된 것으로 나타났습니다.
2025년에도 On-Premise는 59.76%의 점유율을 차지했으며, 그 대부분은 금융 및 의료 분야에 집중되었습니다. 기밀 컴퓨팅 엔클레이브는 현재 사용 중인 데이터를 암호화하여 감사인의 요구 사항을 충족시키고, 클라우드로의 전환을 가능하게 합니다. 클라우드 도입은 연평균 성장률(CAGR) 19.66%로 확대될 것으로 예측되며, 기존 격차는 점차 줄어들 것으로 보입니다. 하이브리드 패브릭은 On-Premise 데이터 웨어하우스와 클라우드 레이크를 통합하여 단일 논리 계층을 형성함으로써, 벤더가 데이터를 이동시키지 않고도 테이블을 공개할 수 있게 해줍니다.
EU 데이터법은 제공업체에 데이터 이식성 지원을 의무화하고 있으며, 이를 통해 락인(lock-in)에 대한 우려가 완화되고 국경을 초월한 거래가 촉진됩니다. BigQuery Omni 및 Snowflake의 크로스 클라우드 복제 기능 덕분에 동일 리전 내 데이터 전송 요금은 더 이상 발생하지 않지만, 복제 비용은 여전히 고려해야 할 사항입니다. 데이터 메쉬 플랫폼과 같이 거버넌스를 유지하면서 위치를 추상화하는 벤더에 대한 수요가 증가하고 있습니다. 전반적으로 도입 구성은 대규모 수익화를 지원하는 유연한 패브릭으로 전환되고 있습니다.
지역별 분석
북미는 2025년 매출의 45.26%를 차지했으며, 이는 성숙한 분석 스택, 긴밀한 구매자 생태계, 그리고 엔터프라이즈 데이터 마켓플레이스의 조기 배포를 반영합니다. 캘리포니아 소비자 개인정보 보호법(CCPA)과 같은 주 차원의 개인정보 보호법은 규정 준수의 복잡성을 초래하는 한편, 데이터 공유를 효율화하는 거버넌스 도구에 대한 투자를 촉진하여 궁극적으로 수익화를 뒷받침하고 있습니다. 이 지역의 하이퍼스케일러들은 마켓플레이스 인프라를 번들로 제공하며, 이미 동일한 플랫폼에 데이터를 보관하고 있는 판매자들에게 유리한 네트워크 효과를 창출하고 있습니다. 도시 계획가, 헤지펀드, 광고 대행사가 합쳐져 견조한 수요를 뒷받침하고 있어, 다른 지역에 비해 유동성이 높습니다.
아시아태평양은 2031년까지 연평균 성장률(CAGR)이 18.24%로 가장 빠르게 성장하는 지역이며, 인도의 ‘디지털 개인 데이터 보호법’과 중국의 ‘개인정보 보호법’에 힘입고 있습니다. 이 두 법안 모두 상실적 데이터 이용에 관한 동의 절차를 명확히 규정하고 있습니다. 규제의 확실성으로 인해 법적 위험이 감소함에 따라, 다국적 기업들이 싱가포르나 도쿄에 데이터 교환 허브를 구축하도록 장려되고 있습니다. 일본과 한국의 스마트 팩토리에서 얻어지는 제조 텔레메트리 데이터는 새로운 공급원이 되고 있는 반면, 동남아시아의 전자상거래 및 핀테크 기업들은 수요를 끌어올리고 있습니다. 지역 내 각국 정부는 데이터센터용량 확장에 자금을 지원하고 있으며, 이를 통해 지연 시간이 단축되고 데이터의 국내 보관이 유지되고 있습니다.
유럽에서는 GDPR(EU 개인정보보호규정)이 여전히 엄격하게 적용되고 있어 보다 안정적인 성장이 예상되지만, EU 데이터법에 따라 연결 기기 제조업체는 사용자 수준의 데이터 접근을 제공해야 할 의무가 있어 B2B 거래의 가능성이 확대되고 있습니다. 산업용 IoT 데이터 세트, 특히 자동차 및 기계의 텔레메트리 데이터는 의무화된 상호 운용성의 혜택을 받을 것으로 전망됩니다. 그러나 현지화 관련 규제로 인해 국경을 넘는 거래가 지연될 가능성이 있으므로, 벤더들은 데이터를 현지에 그대로 두고 처리할 수 있는 연방 학습(federated learning)의 도입을 서두르고 있습니다. 라틴아메리카, 중동 및 아프리카는 디지털 인프라가 점차 정비되고 있지만, 구매자 생태계가 아직 형성 중인 신흥 시장입니다. 스마트 시티 프로젝트와 모바일 머니 시스템은 법적 체계가 안정화되면 미래의 비즈니스 기회가 될 것입니다. 전반적으로 지리적 분산화는 개별 경제의 경기 변동을 완화하는 데 도움이 됩니다.
기타 혜택 :
- 엑셀 형식 시장 예측(ME) 시트
- 3개월간의 애널리스트 지원
자주 묻는 질문
목차
제1장 서론
제2장 조사 방법
제3장 주요 요약
제4장 시장 구도
제5장 시장 규모 및 성장 예측
제6장 경쟁 구도
제7장 시장 기회 및 향후 전망
KTH 26.09.14According to Mordor Intelligence, the data monetization market size is USD 5.67 billion in 2026 and is projected to reach USD 12.66 billion in 2031, advancing at a 17.41% CAGR.
This report is Segmented by Component (Tools/Platforms, and Services), Deployment (On-Premises, and Cloud), Organization Size (Large Enterprises, and Small and Medium Enterprises), End User Industry (Banking, Financial Services, and Insurance (BFSI), Telecom and IT, Manufacturing, Healthcare and Life Sciences, Retail and E-Commerce, and More) and Geography. The Market Forecasts are Provided in Terms of Value (USD).
Global Data Monetization Market Trends and Insights
Rapid Adoption of Advanced Analytics and Visualization
Self-service business-intelligence platforms are collapsing the time from raw data ingestion to monetizable insight, enabling product managers and sales teams to package analytics as standalone offerings without relying on centralized IT. SAP Analytics Cloud and Microsoft Power BI now support embedded analytics that let software vendors white-label dashboards inside their applications, converting telemetry into recurring revenue streams. MicroStrategy's HyperIntelligence overlays contextual metrics on top of enterprise workflows, reducing the friction of switching between operational systems and analytics consoles.
Increasing Volume and Variety of Enterprise Data
IoT sensor deployments, edge-computing arrays, and application-programming-interface ecosystems are generating petabyte-scale datasets that exceed the absorptive capacity of internal analytics teams, pushing enterprises to externalize surplus data through marketplaces or direct licensing. Manufacturing plants now instrument assembly lines with vision systems and vibration sensors that produce real-time quality metrics, which equipment vendors monetize by offering predictive-maintenance subscriptions to peer factories. Telecom operators capture anonymized mobility patterns from cell-tower handoffs, selling aggregated flows to urban planners and retail-site selectors.
Interoperability Hurdles with Legacy Architectures
Enterprises operate a median of 14 distinct data repositories, including relational databases, data lakes, SaaS application silos, and on-premises warehouses, each with proprietary schemas and access protocols that resist federation. Integrating these sources into a unified monetization layer requires extract-transform-load pipelines, API gateways, and semantic harmonization, investments that can exceed USD 5 million for a Fortune 500 firm and take 18 months to operationalize. The strategic risk is that by the time integration completes, the datasets may have lost market relevance or regulatory permissions may have expired.
Other drivers and restraints analyzed in the detailed report include:
- Regulatory Mandates Driving Open-Data Ecosystems
- Enterprise Adoption of Data Marketplaces Enabling B2B Data Trading
- Data Quality Inconsistencies Hindering Monetization Potential
For complete list of drivers and restraints, kindly check the Table Of Contents.
Segment Analysis
Services are forecast to outpace tools, climbing at 19.02% from 2026 to 2031 even though tools commanded 64.58% of 2025 revenue. This variation shows that enterprises buy expertise to translate raw datasets into saleable products. Professional integrators design governance frameworks and negotiate marketplace onboarding, which compresses launch timelines. Within the tooling stack, data-integration platforms dominate because they harmonize disparate schemas, yet analytics front-ends are accelerating as no-code interfaces lower adoption barriers.
Managed services appeal to mid-sized firms that lack in-house data engineers, allowing them to offer subscription-based data products without capital expenditure. The data monetization market size contribution from services is set to rise as confidential computing reduces residency concerns. Partnerships between cloud providers and global systems integrators further expand service catalogs. Microsoft reported that 40% of Azure Synapse revenue flowed through managed-service channels in 2025.
On-premises still held 59.76% share in 2025, largely within finance and healthcare. Confidential-computing enclaves now encrypt data in use, which satisfies auditors and unlocks cloud migration. Cloud installations are projected to advance at 19.66% CAGR, narrowing the historical gap. Hybrid fabrics combine on-premises warehouses with cloud lakes, creating a single logical layer from which sellers expose tables without relocation.
The EU Data Act obliges providers to support data portability, which eases fears of lock-in and boosts cross-border trading. BigQuery Omni and Snowflake cross-cloud replication neutralize egress fees inside the same region, yet replication costs remain a consideration. Vendors that abstract location while preserving governance, such as data-mesh platforms, enjoy rising demand. Overall, the deployment mix is shifting toward flexible fabrics that support monetization at scale.
Complete Report Scope:
- By Component
- Tools / Platforms
- Data Integration and Management Tools
- Analytics and Visualization Tools
- Services
- Professional Services
- Managed Services
- Tools / Platforms
- By Deployment Mode
- On-Premises
- Cloud
- Hybrid
- By Organization Size
- Small and Medium-Sized Enterprises
- Large Enterprises
- By End-User Industry
- Banking, Financial Services, and Insurance (BFSI)
- Telecom and IT
- Manufacturing
- Healthcare and Life Sciences
- Retail and E-Commerce
- Transportation and Logistics
- Energy and Utilities
- Government and Public Sector
- Other End-User Industries
- By Geography
- North America
- United States
- Canada
- Mexico
- South America
- Brazil
- Argentina
- Rest of South America
- Europe
- Germany
- United Kingdom
- France
- Italy
- Spain
- Russia
- Rest of Europe
- Asia Pacific
- China
- Japan
- India
- South Korea
- Australia and New Zealand
- Southeast Asia
- Rest of Asia Pacific
- Middle East
- Saudi Arabia
- United Arab Emirates
- Turkey
- Rest of Middle East
- Africa
- South Africa
- Nigeria
- Rest of Africa
- North America
Geography Analysis
North America delivered 45.26% of 2025 revenue, reflecting mature analytics stacks, dense buyer ecosystems, and the early rollout of enterprise data marketplaces. State-level privacy statutes such as the California Consumer Privacy Act introduce compliance complexity, yet they also encourage investment in governance tools that streamline sharing and thus stimulate monetization. The region's hyperscalers provide bundled marketplace rails, driving favorable network effects for sellers that already store data on the same platforms. Urban planners, hedge funds, and advertising agencies collectively underpin robust demand, making liquidity high relative to other regions.
Asia Pacific is the fastest-growing territory with an 18.24% CAGR through 2031, supported by India's Digital Personal Data Protection Act and China's Personal Information Protection Law, both of which clarify consent protocols for commercial data use. Regulatory certainty has lowered legal risk and encouraged multinationals to base data-exchange hubs in Singapore and Tokyo. Manufacturing telemetry from smart factories in Japan and South Korea comprises a fresh supply pool, while Southeast Asian e-commerce and fintech players create rising demand. Governments across the region are funding data-center capacity, which reduces latency and keeps residency in-country.
Europe exhibits steadier growth because GDPR remains stringent, yet the EU Data Act now obliges connected-device manufacturers to provide user-level data access, expanding B2B trading potential. Industrial IoT datasets, especially automotive and machinery telemetry, stand to benefit from mandated interoperability. However, localization rules can delay cross-border deals, urging vendors to adopt federated learning that leaves data in place. Latin America, the Middle East, and Africa represent nascent markets where digital infrastructure is improving but buyer ecosystems are still forming. Smart-city projects and mobile-money systems present future opportunities once legal frameworks stabilize. Collectively, geographic diversification helps to smooth cyclical variances in individual economies.
- Accenture plc
- Adastra Corporation
- Amazon Web Services Inc.
- Cisco Systems Inc.
- Collibra NV
- Dawex Systems SAS
- Emu Analytics Ltd.
- Equifax Inc.
- Experian plc
- Google LLC (Alphabet Inc.)
- IBM Corporation
- Infosys Limited
- Microsoft Corporation
- Oracle Corporation
- Reltio Inc.
- SAP SE
- SAS Institute Inc.
- Snowflake Inc.
Additional Benefits:
- The market estimate (ME) sheet in Excel format
- 3 months of analyst support
TABLE OF CONTENTS
1 INTRODUCTION
- 1.1 Study Assumptions and Market Definition
- 1.2 Scope of the Study
2 RESEARCH METHODOLOGY
- 2.1 Research Framework
- 2.2 Secondary Research
- 2.3 Primary Research
- 2.4 Data Triangulation and Insight Generation
3 EXECUTIVE SUMMARY
4 MARKET LANDSCAPE
- 4.1 Market Overview
- 4.2 Market Drivers
- 4.2.1 Rapid Adoption of Advanced Analytics and Visualization
- 4.2.2 Increasing Volume and Variety of Enterprise Data
- 4.2.3 Regulatory Mandates Driving Open-Data Ecosystems
- 4.2.4 Enterprise Adoption of Data Marketplaces Enabling B2B Data Trading
- 4.2.5 Generative AI-Enabled Creation of Privacy-Safe Synthetic Data
- 4.2.6 Tokenization of Data Assets Via Blockchain for New Revenue Streams
- 4.3 Market Restraints
- 4.3.1 Interoperability Hurdles with Legacy Architectures
- 4.3.2 Data Quality Inconsistencies Hindering Monetization Potential
- 4.3.3 Fragmented and Evolving Data-Privacy Regulations
- 4.3.4 Escalating Cloud-Egress Fees Undermining Data-Sharing ROI
- 4.4 Industry Value Chain Analysis
- 4.5 Regulatory Landscape
- 4.6 Technological Outlook
- 4.7 Porter's Five Forces Analysis
- 4.7.1 Bargaining Power of Suppliers
- 4.7.2 Bargaining Power of Buyers
- 4.7.3 Threat of New Entrants
- 4.7.4 Threat of Substitutes
- 4.7.5 Intensity of Competitive Rivalry
- 4.8 Impact of Macroeconomic Factors on the Market
5 MARKET SIZE AND GROWTH FORECASTS (VALUE)
- 5.1 By Component
- 5.1.1 Tools / Platforms
- 5.1.1.1 Data Integration and Management Tools
- 5.1.1.2 Analytics and Visualization Tools
- 5.1.2 Services
- 5.1.2.1 Professional Services
- 5.1.2.2 Managed Services
- 5.1.1 Tools / Platforms
- 5.2 By Deployment Mode
- 5.2.1 On-Premises
- 5.2.2 Cloud
- 5.2.3 Hybrid
- 5.3 By Organization Size
- 5.3.1 Small and Medium-Sized Enterprises
- 5.3.2 Large Enterprises
- 5.4 By End-User Industry
- 5.4.1 Banking, Financial Services, and Insurance (BFSI)
- 5.4.2 Telecom and IT
- 5.4.3 Manufacturing
- 5.4.4 Healthcare and Life Sciences
- 5.4.5 Retail and E-Commerce
- 5.4.6 Transportation and Logistics
- 5.4.7 Energy and Utilities
- 5.4.8 Government and Public Sector
- 5.4.9 Other End-User Industries
- 5.5 By Geography
- 5.5.1 North America
- 5.5.1.1 United States
- 5.5.1.2 Canada
- 5.5.1.3 Mexico
- 5.5.2 South America
- 5.5.2.1 Brazil
- 5.5.2.2 Argentina
- 5.5.2.3 Rest of South America
- 5.5.3 Europe
- 5.5.3.1 Germany
- 5.5.3.2 United Kingdom
- 5.5.3.3 France
- 5.5.3.4 Italy
- 5.5.3.5 Spain
- 5.5.3.6 Russia
- 5.5.3.7 Rest of Europe
- 5.5.4 Asia Pacific
- 5.5.4.1 China
- 5.5.4.2 Japan
- 5.5.4.3 India
- 5.5.4.4 South Korea
- 5.5.4.5 Australia and New Zealand
- 5.5.4.6 Southeast Asia
- 5.5.4.7 Rest of Asia Pacific
- 5.5.5 Middle East
- 5.5.5.1 Saudi Arabia
- 5.5.5.2 United Arab Emirates
- 5.5.5.3 Turkey
- 5.5.5.4 Rest of Middle East
- 5.5.6 Africa
- 5.5.6.1 South Africa
- 5.5.6.2 Nigeria
- 5.5.6.3 Rest of Africa
- 5.5.1 North America
6 COMPETITIVE LANDSCAPE
- 6.1 Market Concentration
- 6.2 Strategic Moves
- 6.3 Market Share Analysis
- 6.4 Company Profiles (includes Global Level Overview, Market Level Overview, Core Segments, Financials as Available, Strategic Information, Market Rank/Share for Key Companies, Products and Services, and Recent Developments)
- 6.4.1 Accenture plc
- 6.4.2 Adastra Corporation
- 6.4.3 Amazon Web Services Inc.
- 6.4.4 Cisco Systems Inc.
- 6.4.5 Collibra NV
- 6.4.6 Dawex Systems SAS
- 6.4.7 Emu Analytics Ltd.
- 6.4.8 Equifax Inc.
- 6.4.9 Experian plc
- 6.4.10 Google LLC (Alphabet Inc.)
- 6.4.11 IBM Corporation
- 6.4.12 Infosys Limited
- 6.4.13 Microsoft Corporation
- 6.4.14 Oracle Corporation
- 6.4.15 Reltio Inc.
- 6.4.16 SAP SE
- 6.4.17 SAS Institute Inc.
- 6.4.18 Snowflake Inc.
7 MARKET OPPORTUNITIES AND FUTURE OUTLOOK
- 7.1 White-Space and Unmet-Need Assessment