

|
시장보고서
상품코드
2124522
중국의 석탄 : 시장 점유율 분석, 업계 동향과 통계, 성장 예측(2026-2031년)China Coal - Market Share Analysis, Industry Trends & Statistics, Growth Forecasts (2026 - 2031) |
||||||
 Mordor Intelligence
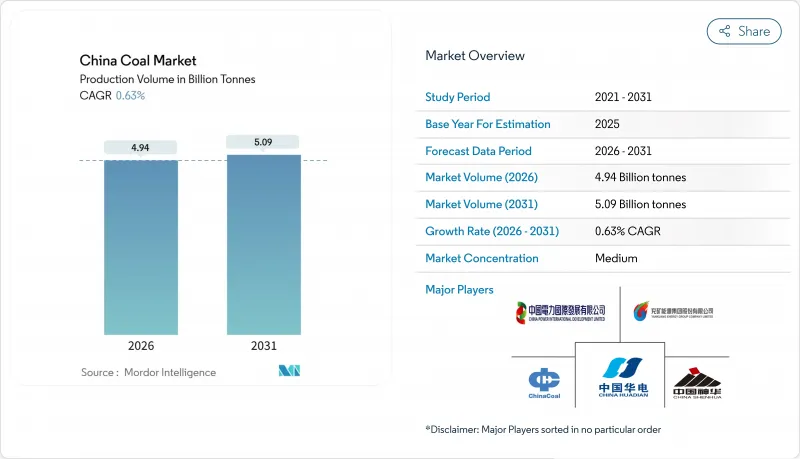
Mordor Intelligence에 의하면, 생산량 기준 중국의 석탄 시장 규모는 2026년 49억 4,000만 톤에서 2031년까지 50억 9,000만 톤으로 확대되고, 예측 기간(2026-2031년) CAGR은 0.63%를 기록할 전망입니다.
본 보고서는 석탄의 등급(갈탄/저품위탄, 아역청탄, 역청탄 및 코크스용탄) 및 용도(발전, 철강 및 야금, 시멘트 및 기타 용도)별로 분류되어 있습니다. 시장 규모 및 전망은 수량(톤) 기준으로 제시되어 있습니다.
중국의 석탄 시장 동향 및 인사이트
데이터센터 클러스터에 따른 전력 수요 급증
인공지능(AI) 워크로드와 클라우드 서비스는 재생에너지만으로는 아직 충족할 수 없는 유연성이 부족한 베이스로드 수요를 유발함으로써 중국의 석탄 시장을 재편하고 있습니다. 데이터센터는 2024년부터 2030년 사이에 석탄 화력 발전으로 생산된 전력을 추가로 90 TWh 소비할 것으로 예상되며, 각 성의 규제 당국은 이러한 클러스터를 지원하기 위해 2024년에 15GW 규모의 석탄 화력 발전 용량 승인을 신속하게 진행했습니다. 사업자들은 탄광 직결 발전소와 10년간의 전력 구매 계약을 체결하고, 고정된 에스컬레이터 조항에 따라 역청탄 공급을 확보하고 있습니다. 이러한 구조를 통해 하이퍼스케일 시설의 현물 시장 가격 변동이 억제되고, 광산 업체에게는 판매처가 보장됩니다. 이러한 추세는 중국의 재생에너지 급성장에도 불구하고, 중국 전력 구성에서 석탄의 역할을 일시적으로 연장시키는 것입니다. 또한, 수직 통합형 국영 기업들에게 해안가 데이터 클러스터로의 안정적인 수송량을 확보하기 위한 철도 및 항만 물류 투자를 촉진하고 있습니다.
석탄 화학 복합 시설의 자체 발전 수요 급증
2025년에는 석탄 화학 프로젝트가 석탄 소비량의 약 8%를 차지할 것이며, 산서성, 산시성, 닝샤 후이족 자치구에서 진행 중인 확장으로 인해 2030년까지 그 비율은 10%를 넘어설 가능성이 있습니다. 이러한 복합 시설에서는 단독 발전소보다 높은 열효율 50%에 가까운 자가용 열병합 발전 설비를 가동하고 있습니다. 2024년 말 가동을 시작한 산시 석탄의 연간 6 Mt 석탄 기반 올레핀 생산 플랜트는 연간 12 Mt의 갈탄을 소비하여 중국의 나프타 수입 의존도를 낮추고 있습니다. 물 사용량이 많은 것은 여전히 과제로 남아 있으며, 대수층에 대한 접근권을 가진 사업자에게 유리한 재활용 시스템에 대한 투자가 필요합니다. 이 분야는 저품위 석탄에 대해 장기적인 가격 변동의 영향을 덜 받는 판로를 제공하여, 전력 수요 감소로부터 석탄 채굴업자를 보호합니다. 또한, 국내 포장 업계 및 자동차 산업에 공급되는 폴리프로필렌과 폴리에틸렌 수요를 창출합니다.
2030년 탄소 배출 정점 달성 및 2060년 탄소 중립 공약에 따라 승인 기준이 강화됨
중국의 ‘두 가지 목표’ 기후 공약을 받아들여, 규제 당국은 2025년에 석탄 프로젝트 신청의 40%를 기각했습니다. 이는 2022년의 20%에서 증가한 수치입니다. 장쑤성, 저장성, 광둥성 등 연안 성에서는 가장 엄격한 심사 기준이 적용되고 있으며, 자금은 해상 풍력 발전 및 계통 규모 에너지 저장 설비로 전환되고 있습니다. 투자자들은 현재 신규 석탄 화력 발전 프로젝트를 평가할 때 ‘좌초 자산’ 리스크를 반영하고 있으며, 대신 청정 석탄으로의 개조에 자본을 돌리고 있습니다. 이러한 변화로 인해 산업용 전용 시장과 같은 틈새 분야를 제외하면, 중국의 석탄 시장의 상승 여력은 제한적입니다. 또한, 배출 가스를 궁극적으로 수익화할 가능성이 있는 이산화탄소 포집 및 활용(CCU)에 대한 연구도 가속화되고 있지만, 단기적인 자금 조달은 정책 변동을 흡수할 수 있는 국영 개발업체에 편중된 상태입니다.
부문별 분석
2025년 기준, 역청탄 및 코크스용 탄은 중국의 석탄 시장 점유율의 67.3%를 차지하고 있으며, 2031년까지 연평균 성장률(CAGR) 1.1%로 확대될 것으로 예측됩니다. 이는 2024년에 650 Mt의 코크스용 석탄을 소비한 고로 생산량이 안정적임을 반영합니다. 총량의 약 20%를 차지하는 아아스팔트탄은 배출 규제를 준수하기 쉬운 저유황 함량을 중시하는 발전소 및 시멘트 가마에 공급되고 있습니다. 갈탄 및 기타 저품위 석탄은 나머지 13%를 차지하며, 내몽골과 광둥성에 집중되어 있습니다. 이 지역에서는 광산 직결 발전소나 석탄 화학 단지가 가스화 공정을 활용하고 있습니다. 국내 철강 제조업체들은 2024년 코크스용 석탄 수입량의 45%를 공급한 호주의 수입 가격 변동 위험을 헤지하기 위해 산시성 및 구이저우성과의 장기 계약을 선호하고 있습니다. 900 GW 규모의 석탄 화력 발전 설비에 대한 초저배출 가스화 개조를 통해, 더 비싼 수입 석탄으로 전환하지 않고도 아역청탄을 원료로 하여 더욱 엄격해진 미세먼지, SO₂, NOx 배출 기준을 충족할 수 있게 되었습니다.
야금용과 화력발전용 수요의 양극화가 투자 흐름을 형성하고 있습니다. 국영 기업은 고품질 코크스용 석탄 생산 확대를 위해 설비 투자를 배정하고 있지만, 소규모 신규 진출기업들은 고품질 탄광에 대한 자금 조달에 어려움을 겪고 있습니다. 한편, 화력 발전용 석탄은 저렴한 재생에너지로 인한 이익률 압박에 직면해 있으며, 전력 회사는 변동 부하 가격 및 유연한 인수 조건에 대한 협상을 진행하고 있습니다. 선택적 촉매 환원(SCR)이나 배연 탈황(FGD)과 같은 기술 업그레이드로 인해 발전소의 수명이 연장되고 있어, 중국의 아역청탄 시장 규모는 완만한 감소에 그치고 있습니다. 장기적으로는 화력용 석탄 수요가 정점에 달하더라도, 야금용 석탄 수요가 계속해서 고품질 석탄 수요를 지탱하는 기반이 될 것입니다.
기타 혜택:
- 엑셀 형식 시장 예측(ME) 시트
- 3개월간의 애널리스트 지원
자주 묻는 질문
목차
제1장 서론
제2장 조사 방법
제3장 주요 요약
제4장 시장 구도
제5장 시장 규모와 성장 예측
제6장 경쟁 구도
제7장 시장 기회와 향후 전망
LSH 26.09.14According to Mordor Intelligence, the China coal market size in terms of production volume is expected to grow from 4.94 Billion tonnes in 2026 to 5.09 Billion tonnes by 2031, at a CAGR of 0.63% during the forecast period (2026-2031).
This report is Segmented by Coal Grade (Lignite/Low-Rank, Sub-Bituminous, and Bituminous and Coking) and Application (Power Generation, Iron/Steel/Metallurgy, and Cement and Other Applications). The Market Sizes and Forecasts are Provided in Terms of Volume (Tonnes).
China Coal Market Trends and Insights
Rapid Growth in Electricity Demand from Data-Center Clusters
Artificial-intelligence workloads and cloud services are reshaping the Chinese coal market by adding inflexible baseload demand that renewables alone cannot yet satisfy. Data centers are poised to consume an extra 90 TWh of coal-fired electricity between 2024 and 2030, and provincial regulators fast-tracked 15 GW of coal capacity in 2024 to backstop these clusters. Operators secure ten-year power-purchase agreements with mine-mouth generators, locking in bituminous supply at fixed escalators. This arrangement reduces spot-market volatility for hyperscale facilities and guarantees offtake for miners. The trend temporarily extends coal's role in China's power mix despite the country's renewable boom. It also encourages vertically integrated SOEs to invest in rail-port logistics that deliver stable throughput to coastal data clusters.
Surging Captive-Power Demand from Coal-Chemical Complexes
Coal-to-chemicals projects accounted for about 8% of coal consumption in 2025, and expansions underway in Shanxi, Shaanxi, and Ningxia could push the share above 10% by 2030. These complexes run captive cogeneration units that reach thermal efficiencies near 50%, higher than stand-alone generators. Shaanxi Coal's 6 Mt/yr coal-to-olefins plant, commissioned in late 2024, consumes 12 Mt of lignite annually and lowers China's reliance on imported naphtha. Water intensity remains a hurdle, requiring investments in recycling systems that favor players with aquifer access. The segment provides a long-term, price-insulated outlet for low-rank coal, shielding miners from shrinking utility demand. It also creates downstream polypropylene and polyethylene volumes that feed domestic packaging and auto industries.
2030 Carbon-Peaking / 2060 Neutrality Pledges Tighten Approvals
China's dual-target climate pledge prompted regulators to reject 40% of coal-project applications in 2025, up from 20% in 2022. Coastal provinces such as Jiangsu, Zhejiang, and Guangdong apply the strictest filters and pivot funding toward offshore wind and grid-scale storage. Investors now price in stranded-asset risk when assessing greenfield thermal projects, steering capital toward clean-coal retrofits instead. The shift limits upside for the Chinese coal market beyond captive industrial niches. It also accelerates research into carbon-capture utilization that could eventually monetize flue-gas streams, but near-term financing remains skewed toward state-backed developers capable of absorbing policy swings.
Other drivers and restraints analyzed in the detailed report include:
- Government-Backed Capacity Replacement Program
- Autonomous and Smart-Mine Deployment Cuts OPEX
- Accelerating Renewable and Storage Build-Out Curbs Coal Burn
For complete list of drivers and restraints, kindly check the Table Of Contents.
Segment Analysis
Bituminous and coking grades held 67.3% of China's coal market share in 2025 and are forecast to expand at a 1.1% CAGR through 2031, reflecting stable blast-furnace output that consumed 650 Mt of coking coal in 2024. Sub-bituminous coal, roughly 20% of volume, serves power plants and cement kilns that value its lower sulfur content for easier emissions compliance. Lignite and other low-rank grades make up the remaining 13%, concentrated in Inner Mongolia and Yunnan, where mine-mouth generators and coal-chemical complexes exploit gasification pathways. Domestic steelmakers favor long-term contracts from Shanxi and Guizhou to hedge against import volatility from Australia, which supplied 45% of coking-coal imports in 2024. Ultra-low-emission retrofits at 900 GW of coal-fired capacity let sub-bituminous feedstock satisfy stricter particulate, SO2, and NOx limits without switching to pricier imports.
The bifurcation between metallurgical and thermal demand shapes investment flows. SOEs are allocating capex to expand premium coking-coal output, while smaller entrants struggle to finance high-quality shafts. Meanwhile, thermal grades face margin pressure from cheaper renewables, prompting utilities to negotiate variable-load pricing and flexible offtake terms. Technology upgrades such as selective catalytic reduction and flue-gas desulfurization extend plant life, allowing the China coal market size for sub-bituminous grades to decline only slowly. Over time, metallurgical demand will remain the anchor for premium coal even as thermal volumes plateau.
Complete Report Scope:
- By Coal Grade
- Lignite/Low-Rank
- Sub-bituminous
- Bituminous and Coking
- By Application
- Power Generation
- Iron, Steel, and Metallurgy
- Cement and Other Applications
List of Companies Covered in this Report:
- China Energy Investment Corp. (China Shenhua)
- China Coal Energy Group
- Shaanxi Coal & Chemical Industry Group
- Shandong Energy Group
- Yankuang Energy Group
- Huadian Power Intl.
- Huaneng Power Intl.
- Datang Intl. Power Generation
- China Resources Power
- China Power Intl. Development
- Jinneng Holding Group
- Inner Mongolia Yitai Coal
- Kailuan Group
- Zhejiang Energy Group
- Guanghui Energy
- China Datang Group Coal Industry
- Huabei Coal & Electricity
- Beijing Jingmei Group
- Shanxi Lu'an Mining
- Guodian Power Development
Additional Benefits:
- The market estimate (ME) sheet in Excel format
- 3 months of analyst support
TABLE OF CONTENTS
1 Introduction
- 1.1 Study Assumptions & Market Definition
- 1.2 Scope of the Study
2 Research Methodology
3 Executive Summary
4 Market Landscape
- 4.1 Market Overview
- 4.2 Market Drivers
- 4.2.1 Rapid growth in electricity demand from data-center clusters
- 4.2.2 Surging captive-power demand from coal-chemical complexes
- 4.2.3 Government-backed capacity replacement program
- 4.2.4 Cost-competitive domestic reserves vs. seaborne imports
- 4.2.5 Autonomous & smart-mine deployment cuts OPEX
- 4.2.6 Ultra-low-emission retrofits extend plant lifetimes
- 4.3 Market Restraints
- 4.3.1 2030 carbon-peaking/2060 neutrality pledges tighten approvals
- 4.3.2 Accelerating renewable & storage build-out curbs coal burn
- 4.3.3 ESG-driven credit restrictions on coal projects
- 4.3.4 Water-stress in coal-rich provinces limits new mines
- 4.4 Supply-Chain Analysis
- 4.5 Regulatory Landscape
- 4.6 Technological Outlook
- 4.7 Porter's Five Forces
- 4.7.1 Threat of New Entrants
- 4.7.2 Bargaining Power of Suppliers
- 4.7.3 Bargaining Power of Buyers
- 4.7.4 Threat of Substitutes
- 4.7.5 Competitive Rivalry
- 4.8 PESTLE Analysis
5 Market Size & Growth Forecasts
- 5.1 By Coal Grade
- 5.1.1 Lignite/Low-Rank
- 5.1.2 Sub-bituminous
- 5.1.3 Bituminous and Coking
- 5.2 By Application
- 5.2.1 Power Generation
- 5.2.2 Iron, Steel, and Metallurgy
- 5.2.3 Cement and Other Applications
6 Competitive Landscape
- 6.1 Market Concentration
- 6.2 Strategic Moves (M&A, Partnerships, PPAs)
- 6.3 Market Share Analysis (Market Rank/Share for key companies)
- 6.4 Company Profiles (includes Global level Overview, Market level overview, Core Segments, Financials as available, Strategic Information, Products & Services, and Recent Developments)
- 6.4.1 China Energy Investment Corp. (China Shenhua)
- 6.4.2 China Coal Energy Group
- 6.4.3 Shaanxi Coal & Chemical Industry Group
- 6.4.4 Shandong Energy Group
- 6.4.5 Yankuang Energy Group
- 6.4.6 Huadian Power Intl.
- 6.4.7 Huaneng Power Intl.
- 6.4.8 Datang Intl. Power Generation
- 6.4.9 China Resources Power
- 6.4.10 China Power Intl. Development
- 6.4.11 Jinneng Holding Group
- 6.4.12 Inner Mongolia Yitai Coal
- 6.4.13 Kailuan Group
- 6.4.14 Zhejiang Energy Group
- 6.4.15 Guanghui Energy
- 6.4.16 China Datang Group Coal Industry
- 6.4.17 Huabei Coal & Electricity
- 6.4.18 Beijing Jingmei Group
- 6.4.19 Shanxi Lu'an Mining
- 6.4.20 Guodian Power Development
7 Market Opportunities & Future Outlook
- 7.1 White-space & Unmet-Need Assessment


