

|
시장보고서
상품코드
2124538
반도체 및 전자부품 제조 : 시장 점유율 분석, 업계 동향과 통계, 성장 예측(2026-2031년)Semiconductor And Electronic Parts Manufacturing - Market Share Analysis, Industry Trends & Statistics, Growth Forecasts (2026 - 2031) |
||||||
 Mordor Intelligence
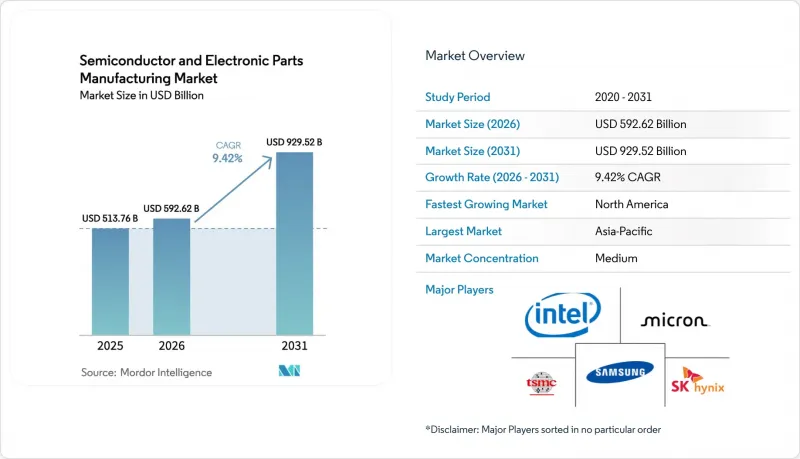
에 의하면, 반도체 및 전자부품 제조 시장 규모는 2025년 5,137억 6,000만 달러에서 2026년에는 5,926억 2,000만 달러로 확대되어 2031년까지 9,295억 2,000만 달러에 이를 것으로 예측되며, 2026-2031년 CAGR9.42%를 기록할 전망입니다.
본 보고서는 제품 유형(로직 IC, 메모리, 아날로그 및 혼합 신호 등), 구성 요소(장비, 소프트웨어, 서비스),용도(통신·네트워크, 운송·모빌리티 등), 기술 노드(7nm 미만, 8-16nm, 22-28nm, 28nm 이상), 지역별로 분류되어 있습니다. 시장 예측은 금액(달러) 기준으로 제시되어 있습니다.
세계 반도체 및 전자 부품 제조 시장 동향과 인사이트
AI 주도형 고대역폭 컴퓨팅 수요
2025년, 고대역폭 메모리(HBM) 출하량은 전년 대비 150% 증가했습니다. 이는 패키지당 1.2 TB/s의 대역폭을 필요로 하는 생성형 AI 워크로드를 반영한 것입니다. 각 하이퍼스케일러 기업들은 파운드리 기업과 공동으로 맞춤형 가속기 설계를 시작했으며, 이로 인해 범용 GPU의 잠재 시장이 축소되는 한편, 첨단 패키징 기술이 차기 경쟁의 최전선으로 자리 잡고 있습니다. 2026년에 양산 출하가 시작될 엔비디아(Nvidia)의 블랙웰(Blackwell) 아키텍처는 8개의 HBM3E 스택을 통합하고 있어, 2026년 하반기에 확장이 실현될 때까지 클린룸의 생산 능력에 부담을 주고 있습니다. 현재 데이터센터 개조에는 1.5 MW 랙이 지정되어 있으며, 이는 2024년 전력 밀도 기준의 3배에 달하고,, 그 결과 그리드 타이형 인버터용 SiC 모듈 수요를 견인하고 있습니다. 아랍에미리트, 사우디아라비아, 인도의 ‘소버린 AI’ 프로그램은 수출 규제 대상인 GPU를 우회하기 위해 현지화된 컴퓨팅 예산에 300억 달러를 추가로 투입하고 있습니다. 이러한 파급 효과는 네트워크 패브릭 및 열 관리 서브시스템으로도 확산되고 있으며, 이를 합치면 서버 랙 1대당 1만 2,000달러 상당의 반도체 부품이 추가됩니다.
운송 수단의 전동화가 SiC/GaN 채택을 촉진
2025년에는 전기차 1대당 반도체 탑재액이 1,200달러에 달하고,, 내연기관 차량 기준치의 2배가 될 전망입니다. 이 증가분의 35%는 SiC 인버터가 차지하고 있습니다. 테슬라의 분해 조사 데이터에 따르면, SiC 모듈의 비용이 kW당 150달러 미만인 것으로 확인되어, 3만 달러 미만의 가격대의 양산 모델에 대한 채택을 촉진하고 있습니다. 중국의 자동차 제조업체인 BYD와 지리(Geely)는 200mm SiC 웨이퍼 생산 라인의 수직 통합을 추진하고 있으며, 수율 차이가 여전히 25퍼센트 포인트 존재함에도 불구하고 비용 면에서 유럽 및 미국공급업체에 도전하고 있습니다. 차량용 충전기에 활용되는 GaN 디바이스는 부피를 30% 줄일 수 있지만, 자동차용 온도 사이클 시험에서의 신뢰성에 대한 우려가 있어 2025년 플랫폼 보급률은 15%에 그칠 것으로 전망됩니다. 2025년 7월부터 신형 승용차 전 차종에 48V 마일드 하이브리드 탑재를 의무화하는 ‘유로 7’ 규제에 따라, 파워 디스크리트용 웨이퍼 생산 시작량이 월간 30만 장 증가할 전망입니다.
격화되는 지정학적 수출 규제
미국 산업안보국(BIS)이 2024년 10월 규정을 확대하여 140개의 중국 기업을 ‘엔티티 리스트’에 추가함에 따라, 14nm 미만의 제조 장비에 대한 접근이 제한되었습니다. ASML의 중국 내 매출은 고NA EUV 장비 출하가 유럽 및 북미로 이동함에 따라 2025년에 35% 감소했습니다. 갈륨 및 게르마늄에 대한 중국의 대응 조치로 인해, 2025년 중반 캐나다와 호주가 생산 규모를 확대할 때까지 GaN 및 SiC 공급에 차질이 발생했습니다. 현재 중견 공급업체의 규정 준수 비용은 연간 800만 달러를 초과하여 이익률을 압박하는 동시에 설계 주기를 90일 이상으로 연장시키고 있습니다. ITAR 및 EAR에 기반한 이중 관할 감독으로 인해 이중 용도 기술 시장 출시 기간이 더욱 지연되고 있습니다.
부문 분석
반도체 및 전자 부품 제조 시장에서 로직 IC가 차지하는 시장 규모는 2025년 매출의 36.54%에 달하며, 애플리케이션 프로세서 및 AI 가속기에 대한 지속적인 수요를 반영하고 있습니다. 메모리 수요는 새로운 HBM 생산 능력으로 인해 공급 제약이 완화됨에 따라 2026년 이후에는 안정될 것으로 예측됩니다. 아날로그 및 혼합 신호 부품은 산업용 및 자동차용 용도의 수명 주기 연장에 힘입어 계속해서 큰 수익을 창출하고 있습니다. 디스크리트 및 파워 디바이스는 전기차 분야의 SiC 및 GaN 보급에 힘입어 연평균 성장률(CAGR) 10.42%로 성장하며, 다른 분야를 웃도는 속도로 확대될 것으로 예측됩니다.
칩렛 기반 아키텍처에서는 최첨단 연산 칩렛에 더해 성숙한 노드의 메모리 및 I/O 다이가 통합됨에 따라 이러한 카테고리의 경계가 모호해지고, 이익 분배처가 패키징 전문 기업으로 이동하고 있습니다. 메모리의 적층 구조로의 전환은 제조 원가를 상승시키지만, 가격 결정력을 높이는 한편, 아날로그 부품 공급업체들은 독자적인 고전압 흐름을 통해 이익률을 유지하고 있습니다. 중국의 신생 기업들이 저가형 개별 소자 시장에 압박을 가하고 있어, 유럽과 미국의 기존 기업들은 수율과 신뢰성이 진입 장벽으로 작용하는 1,200V SiC 시장 등 더 상위 시장으로 진출할 수밖에 없는 상황입니다.
2025년 부품 매출의 51.26%를 장비가 차지하고 있으며, 그 배경에는 수십억 달러 규모의 리소그래피 투자가 있습니다. 대당 3억 8,000만 달러에 달하는 고 NA EUV 시스템은 전례 없는 수주 잔고를 기록했습니다. 소프트웨어는 여전히 3nm 미만 공정에서 전략적인 관문 역할을 하고 있으며, 시노프시스(Synopsys)와 케이던스(Cadence)가 첨단 노드 툴체인에서 지배적인 역할을 하고 있습니다. 서비스 부문은 설계 아웃소싱의 심화를 반영하여, 예측 기간 동안 연평균 성장률(CAGR) 10.15%라는 가장 빠른 성장 궤도를 그릴 전망입니다.
팹리스 기업들이 턴키 제휴를 심화함에 따라, 반도체 및 전자 부품 제조 분야의 서비스 시장 규모는 2031년까지 4,000억 달러를 넘어설 것으로 예측됩니다. 장비 공급업체들은 매출 총이익률이 60% 이상의 예비 부품 및 예측 유지보수 분석을 통해, 이미 도입된 장비로부터의 수익화를 점점 더 확대되고 있습니다. 소프트웨어 분야에서는 시노프시스(Synopsys)의 2024년 앤시스(Ansys) 인수가 보여주듯이 수직 통합이 진행되고 있습니다. 지역 간 임금 격차로 인해 정형화된 검증 업무는 인도나 베트남으로 이동하고 있지만, ISO 26262와 같은 규정 준수 프레임워크에 따라 성숙한 시장에서는 고부가가치 감사가 정착되고 있습니다.
지역별 분석
2025년, 아시아태평양은 전 세계 매출의 49.66%를 차지하며, 대만과 한국이 최첨단 로직 및 메모리 분야를 주도하고 있습니다. 지정학적 분산화로 인해 생산 능력이 인도, 베트남, 말레이시아로 확대되고 있는 만큼, 해당 지역의 성장은 완만할 것으로 예측됩니다. 중국은 여전히 단일 국가로는 최대 구매국이지만, 수출 규제로 인해 첨단 장비에 대한 접근이 제한되고 있습니다. 일본은 두 자릿수 보조금의 뒷받침을 받아 TSMC와의 구마모토 합작 사업을 통해 22-28nm 공정 라인에서 부활을 이루고 있습니다. 인도는 마이크론과 AMD가 테스트 및 조립 단지를 건설함에 따라 백엔드 분야에서 다시 존재감을 높이고 있습니다.
북미는 CHIPS법에 따른 보조금이 12개의 신규 프런트엔드 팹을 뒷받침함에 따라, 2031년까지 11.26%라는 가장 높은 연평균 성장률(CAGR)을 나타낼 전망입니다. 미국의 반도체 및 전자 부품 제조 시장 규모는 30년에 걸친 해외 이전 추세를 역전시켜 2031년까지 급속히 확대될 것으로 추정됩니다. 캐나다는 SiC 소재의 허브로 부상하고 있는 반면, 멕시코는 니어쇼어형 자동차 공급망을 위해 OSAT(수탁 조립·테스트) 생산 능력을 확대되고 있습니다.
유럽은 430억 유로의 보조금 예산을 통해 2030년까지 세계적 입지를 강화하는 것을 목표로 하고 있습니다. 독일에는 인텔의 주력 공장인 마그데부르크 공장이 있으며, 프랑스는 ST마이크로일렉트로닉스를 통해 SiC를 전문으로 하고 있습니다. 중동에서는 국내 생태계가 여전히 시범 규모에 머물러 있지만, AI에 특화된 팹에 정부계 펀드의 자금이 투입되고 있습니다. 아프리카 시장 규모는 아직 초기 단계이지만, 남아프리카공화국과 나이지리아에서의 가전제품 조립을 통해 성장하고 있습니다.
기타 혜택:
- 엑셀 형식 시장 예측(ME) 시트
- 3개월간의 애널리스트 지원
자주 묻는 질문
목차
제1장 서론
제2장 조사 방법
제3장 주요 요약
제4장 시장 구도
제5장 시장 규모와 성장 예측
제6장 경쟁 구도
제7장 시장 기회와 향후 전망
LSH 26.09.14According to Mordor Intelligence, the semiconductor and Electronic Parts Manufacturing market size is expected to grow from USD 513.76 billion in 2025 to USD 592.62 billion in 2026 and is projected to reach USD 929.52 billion by 2031, expanding at a 9.42% CAGR over 2026-2031.
This report is Segmented by Product Type (Logic IC, Memory, Analog and Mixed-Signal, and More), Component (Equipment, Software, and Services), Application (Communication and Networking, Transportation and Mobility, and More), Technology Node (Less Than 7nm, 8-16nm, 22-28nm, and Above 28 Nm), and Geography. The Market Forecasts are in Provided in Terms of Value (USD).
Global Semiconductor And Electronic Parts Manufacturing Market Trends and Insights
AI-Led Demand for High-bandwidth Compute
High-bandwidth memory (HBM) shipments expanded 150% year-over-year in 2025, reflecting generative-AI workloads that require 1.2 TB/s bandwidth per package. Hyperscalers have begun co-designing custom accelerators with foundries, compressing merchant GPU addressable markets and positioning advanced package technology as the next competitive frontier. Nvidia's Blackwell architecture, entering volume shipments in 2026, integrates eight HBM3E stacks, straining clean-room capacity until late-2026 expansions materialize. Data-center retrofits now specify 1.5 MW racks, tripling 2024 power-density baselines and consequently driving demand for SiC modules in grid-tie inverters. Sovereign-AI programs in the United Arab Emirates, Saudi Arabia and India add a further USD 30 billion in localized compute budgets aimed at bypassing export-controlled GPUs. The multiplier extends into network fabrics and thermal-management subsystems, which together add USD 12,000 of semiconductor content per server rack.
Electrification of Transport Boosting SiC / GaN Content
Electric-vehicle semiconductor content reached USD 1,200 per unit in 2025, double the internal-combustion baseline, with SiC inverters contributing 35% of that uplift. Tesla teardown data confirmed SiC module costs below USD 150 per kilowatt, catalyzing uptake in mass-market models priced under USD 30,000. Chinese automakers BYD and Geely are vertically integrating 200 mm SiC wafer lines, challenging Western vendors on cost while yield gaps persist at 25 percentage points. GaN devices, leveraged for on-board chargers, enable 30% volume reductions yet face reliability skepticism under automotive temperature cycling, limiting 2025 platform penetration to 15%. Euro 7 regulations mandating 48 V mild-hybrids across new passenger cars from July 2025 add incremental demand for 300,000 wafer starts per month of power discretes.
Intensifying Geo-Economic Export Controls
The U.S. Bureau of Industry and Security's October 2024 rule expansion added 140 Chinese entities to the Entity List, curtailing access to sub-14 nm tools. ASML's China revenue declined 35% in 2025 as High-NA EUV shipments pivoted to Europe and North America. China's counter-measures on gallium and germanium disrupted GaN and SiC supply until Canada and Australia scaled output by mid-2025. Compliance costs now exceed USD 8 million annually for mid-tier suppliers, eroding margins and elongating design cycles to over 90 days. Dual-jurisdiction oversight under ITAR and EAR further slows time-to-market for dual-use innovations.
Other drivers and restraints analyzed in the detailed report include:
- Government Fab-Subsidy Race
- 5G and Edge-IoT Device Proliferation
- Acute Talent Shortages in Sub-7 nm Process Engineering
For complete list of drivers and restraints, kindly check the Table Of Contents.
Segment Analysis
The Semiconductor and Electronic Parts Manufacturing market size attributed to Logic ICs amounted to 36.54% of 2025 revenue, reflecting sustained demand for application processors and AI accelerators. Memory demand is expected to stabilize after 2026 as new HBM capacity alleviates supply constraints. Analog and mixed-signal components continue to generate significant revenue, driven by their extended life cycles in industrial and automotive applications. Discrete and power devices, are expected to outpace their peers by growing at a 10.42% CAGR, driven by the penetration of SiC and GaN in electric mobility.
Chiplet-based architectures blur these categories by embedding memory and I/O dies from mature nodes alongside cutting-edge compute chiplets, redistributing profit pools toward packaging specialists. Memory's move to stacked configurations raises the cost of goods but earns pricing power, while analog suppliers defend margins via proprietary high-voltage flows. Chinese entrants are pressuring low-end discrete devices, forcing Western incumbents up-market into 1,200 V SiC, where yields and reliability create entry barriers.
Equipment contributed 51.26% of 2025 component revenue, underpinned by multi-billion-dollar lithography outlays. High-NA EUV systems priced at USD 380 million each garnered unprecedented order backlogs. Software remains the strategic gatekeeper to sub-3 nm processes, with Synopsys and Cadence playing a dominant role in the advanced-node toolchain. Services will chart the fastest trajectory at a 10.15% CAGR in the forecast period, mirroring the growing intensity of design outsourcing.
The Semiconductor and Electronic Parts Manufacturing market size for Services is projected to eclipse USD 400 billion by 2031 as fabless firms deepen turnkey partnerships. Equipment vendors increasingly monetize installed bases through spares and predictive-maintenance analytics that carry gross margins exceeding 60%. Software is consolidating vertically, illustrated by Synopsys' 2024 acquisition of Ansys. Geographic wage differentials steer routine verification tasks to India and Vietnam, while compliance frameworks such as ISO 26262 anchor higher-value audits in mature markets.
Complete Report Scope:
- By Product Type
- Logic IC
- Memory (DRAM, NAND, Emerging)
- Analog and Mixed-Signal
- Discrete and Power (SI, SiC and GaN)
- Data- Center and Cloud
- By Component
- Equipment (Front-end, Back-end)
- Software (EDA, IP Cores)
- Services (Design, Assembly, Test)
- By Application
- Communications and Networking
- Transportation and Mobility
- Consumer Electronics
- Industrial and Energy
- Data- Center and Cloud
- By Technology Node
- Less than 7nm
- 8- 16 nm
- 22- 28 nm
- Greater than 28 nm
- By Geography
- North America
- United States
- Canada
- Mexico
- South America
- Brazil
- Argentina
- Rest of South America
- Europe
- Germany
- United Kingdom
- France
- Italy
- Spain
- Rest of Europe
- Asia-Pacific
- China
- Japan
- India
- South Korea
- ASEAN
- Rest of Asia-Pacific
- Middle East
- Saudi Arabia
- United Arab Emirates
- Rest of Middle East
- Africa
- South Africa
- Nigeria
- Rest of Africa
- North America
Geography Analysis
Asia-Pacific accounted for 49.66% of global revenue in 2025, with Taiwan and South Korea leading-edge logic and memory. The region's growth is expected to be moderate as geopolitical diversification spreads capacity across India, Vietnam, and Malaysia. China remains the largest single-country buyer, yet export controls limit its access to advanced tools. Japan, boosted by double-digit subsidies, is resurgent in 22-28 nm lines through TSMC's Kumamoto joint venture. India regains relevance in the back end as Micron and AMD build test and assembly campuses.
North America is set to record the swiftest CAGR of 11.26% through 2031, as CHIPS Act subsidies underwrite 12 new front-end fabs. The United States' Semiconductor and Electronic Parts Manufacturing market size is estimated to grow rapidly by 2031, reversing a three-decade offshoring trend. Canada advances as a SiC materials hub, while Mexico scales OSAT capacity for near-shore automotive supply chains.
Europe is aiming to increase its global presence by 2030 through a EUR 43 billion subsidy pool. Germany hosts the flagship Intel Magdeburg plant, while France specializes in SiC through STMicroelectronics. The Middle East channels sovereign wealth toward AI-focused fabs, though domestic ecosystems remain at pilot scale. Africa's footprint is nascent but growing via consumer-electronics assembly in South Africa and Nigeria.
- Taiwan Semiconductor Manufacturing Co. Ltd.
- Samsung Electronics Co. Ltd.
- Intel Corp.
- SK Hynix Inc.
- Micron Technology Inc.
- Qualcomm Technologies Inc.
- Broadcom Inc.
- Texas Instruments Inc.
- Analog Devices Inc.
- NXP Semiconductors N.V.
- STMicroelectronics N.V.
- Infineon Technologies AG
- ON Semiconductor Corp.
- Renesas Electronics Corp.
- Nvidia Corp.
- Advanced Micro Devices Inc.
- GlobalFoundries Inc.
- United Microelectronics Corp.
- Semiconductor Manufacturing International Corp.
- ASE Technology Holding Co. Ltd.
- Lam Research Corp.
- Applied Materials Inc.
- KLA Corp.
Additional Benefits:
- The market estimate (ME) sheet in Excel format
- 3 months of analyst support
TABLE OF CONTENTS
1 INTRODUCTION
- 1.1 Study Assumptions and Market Definition
- 1.2 Scope of the Study
2 RESEARCH METHODOLOGY
3 EXECUTIVE SUMMARY
4 MARKET LANDSCAPE
- 4.1 Market Overview
- 4.2 Market Drivers
- 4.2.1 AI-led Demand for High-bandwidth Compute
- 4.2.2 Electrification of Transport Boosting SiC/GaN Content
- 4.2.3 Government Fab-subsidy Race (CHIPS, EU Chips, K-Chips, etc.)
- 4.2.4 5G and Edge?IoT Device Proliferation
- 4.2.5 Chiplet and 3D Heterogenous Integration Accelerating Node-agnostic Growth
- 4.2.6 Friend-shoring Duplication of Critical Legacy-node Capacity
- 4.3 Market Restraints
- 4.3.1 Intensifying Geo-economic Export Controls
- 4.3.2 IP-rights Infringement and Cross-licensing Disputes
- 4.3.3 Acute Talent Shortages in Sub-7 nm Process Engineering
- 4.3.4 Neon and Advanced-gas Supply-chain Fragility
- 4.4 Industry Value Chain Analysis
- 4.5 Regulatory Landscape
- 4.6 Technological Outlook
- 4.7 Porter's Five Forces Analysis
- 4.7.1 Bargaining Power of Suppliers
- 4.7.2 Bargaining Power of Buyers
- 4.7.3 Threat of New Entrants
- 4.7.4 Threat of Substitutes
- 4.7.5 Intensity of Competitive Rivalry
5 MARKET SIZE AND GROWTH FORECASTS (VALUE)
- 5.1 By Product Type
- 5.1.1 Logic IC
- 5.1.2 Memory (DRAM, NAND, Emerging)
- 5.1.3 Analog and Mixed-Signal
- 5.1.4 Discrete and Power (SI, SiC and GaN)
- 5.1.5 Data- Center and Cloud
- 5.2 By Component
- 5.2.1 Equipment (Front-end, Back-end)
- 5.2.2 Software (EDA, IP Cores)
- 5.2.3 Services (Design, Assembly, Test)
- 5.3 By Application
- 5.3.1 Communications and Networking
- 5.3.2 Transportation and Mobility
- 5.3.3 Consumer Electronics
- 5.3.4 Industrial and Energy
- 5.3.5 Data- Center and Cloud
- 5.4 By Technology Node
- 5.4.1 Less than 7nm
- 5.4.2 8- 16 nm
- 5.4.3 22- 28 nm
- 5.4.4 Greater than 28 nm
- 5.5 By Geography
- 5.5.1 North America
- 5.5.1.1 United States
- 5.5.1.2 Canada
- 5.5.1.3 Mexico
- 5.5.2 South America
- 5.5.2.1 Brazil
- 5.5.2.2 Argentina
- 5.5.2.3 Rest of South America
- 5.5.3 Europe
- 5.5.3.1 Germany
- 5.5.3.2 United Kingdom
- 5.5.3.3 France
- 5.5.3.4 Italy
- 5.5.3.5 Spain
- 5.5.3.6 Rest of Europe
- 5.5.4 Asia-Pacific
- 5.5.4.1 China
- 5.5.4.2 Japan
- 5.5.4.3 India
- 5.5.4.4 South Korea
- 5.5.4.5 ASEAN
- 5.5.4.6 Rest of Asia-Pacific
- 5.5.5 Middle East
- 5.5.5.1 Saudi Arabia
- 5.5.5.2 United Arab Emirates
- 5.5.5.3 Rest of Middle East
- 5.5.6 Africa
- 5.5.6.1 South Africa
- 5.5.6.2 Nigeria
- 5.5.6.3 Rest of Africa
- 5.5.1 North America
6 COMPETITIVE LANDSCAPE
- 6.1 Market Concentration
- 6.2 Strategic Moves
- 6.3 Market Share Analysis
- 6.4 Company Profiles (includes Global level Overview, Market Level Overview, Core Segments, Financials as Available, Strategic Information, Market Rank/Share for Key Companies, Products and Services, and Recent Developments)
- 6.4.1 Taiwan Semiconductor Manufacturing Co. Ltd.
- 6.4.2 Samsung Electronics Co. Ltd.
- 6.4.3 Intel Corp.
- 6.4.4 SK Hynix Inc.
- 6.4.5 Micron Technology Inc.
- 6.4.6 Qualcomm Technologies Inc.
- 6.4.7 Broadcom Inc.
- 6.4.8 Texas Instruments Inc.
- 6.4.9 Analog Devices Inc.
- 6.4.10 NXP Semiconductors N.V.
- 6.4.11 STMicroelectronics N.V.
- 6.4.12 Infineon Technologies AG
- 6.4.13 ON Semiconductor Corp.
- 6.4.14 Renesas Electronics Corp.
- 6.4.15 Nvidia Corp.
- 6.4.16 Advanced Micro Devices Inc.
- 6.4.17 GlobalFoundries Inc.
- 6.4.18 United Microelectronics Corp.
- 6.4.19 Semiconductor Manufacturing International Corp.
- 6.4.20 ASE Technology Holding Co. Ltd.
- 6.4.21 Lam Research Corp.
- 6.4.22 Applied Materials Inc.
- 6.4.23 KLA Corp.
7 MARKET OPPORTUNITIES AND FUTURE OUTLOOK
- 7.1 White-space and Unmet-Need Assessment


