

|
시장보고서
상품코드
2124636
TV 및 셋톱박스 : 시장 점유율 분석, 업계 동향 및 통계, 성장 예측(2026-2031년)Television And Set Top Box - Market Share Analysis, Industry Trends & Statistics, Growth Forecasts (2026 - 2031) |
||||||
 Mordor Intelligence
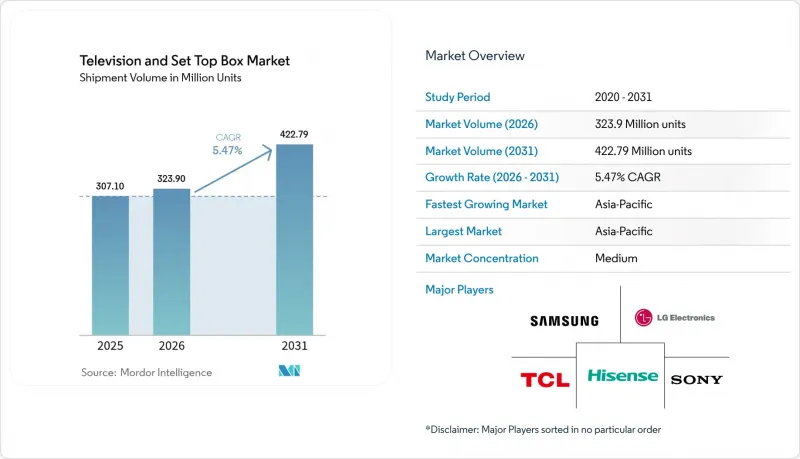
Mordor Intelligence에 의하면, TV 및 셋톱박스 시장 규모는 2025년 3억 710만 대로 평가되었습니다. 2026년에는 3억 2,390만 대로 확대되어 2026년부터 2031년에 걸쳐 CAGR 5.47%로 성장을 지속하여, 2031년에는 4억 2,279만 대에 이를 것으로 예측됩니다.
본 보고서는 제품 유형(TV, 셋톱박스, 스트리밍 동글/스틱), 해상도(SD, HD/FHD, 4K, 8K 이상),화면 크기(32인치 이하, 기타), 기술(LCD/LED, QLED/Mini-LED, 기타), 최종 사용자(가정용, 업무용, 공공기관용), 지역(북미, 남미, 유럽, 기타)별로 분류되어 있습니다. 시장 예측은 금액(달러) 기준으로 제시되어 있습니다.
세계의 TV 및 셋톱박스 시장 동향 및 인사이트
4K 및 8K UHD 컨텐츠로의 소비자 급속한 전환
고해상도 스크린에 대한 수요가 급증함에 따라 교체 주기가 단축되고 평균 판매 가격이 상승하고 있습니다. 8K 지원 하드웨어는 존재하지만, 네이티브 컨텐츠가 제한적이어서 보급 속도가 더딘 편이며, 업그레이드 결정에 있어서는 여전히 4K가 주류를 이루고 있습니다. BenQ사의 예측에 따르면, 8K의 광범위한 보급에는 적어도 앞으로 6년은 더 걸릴 전망이며, 이로 인해 중기적으로는 4K 패널이 상업적으로 우위를 유지할 것으로 보입니다. 또한, Samsung Electronics가 보유한 광범위한 8K 특허 포트폴리오 역시 비용 구조와 경쟁적인 라이선싱에 영향을 미칠 가능성이 높습니다. 따라서 TV 및 셋톱박스 시장에서는 4K를 주요 가치 동력으로 삼는 한편, 8K는 보다 장기적인 프리미엄 전략으로 간주하고 있습니다.
스마트 TV의 OS 생태계가 교체 주기를 가속화
소프트웨어 생태계는 이제 제품 차별화의 핵심이 되었습니다. 삼성의 2025년형 모델에는 ‘Vision AI’가 통합되어, 추천 컨텐츠와 음성 명령을 사용자에 맞추어 최적화합니다. LG는 Microsoft Copilot을 결합해 생산성 기능을 추가하고 있으며, 이로 인해 제품의 수명 주기가 짧게 느껴지게 되어 4-5년마다의 교체 주기가 촉진되고 있습니다. Android TV, Roku, webOS 등에 의한 플랫폼의 세분화는 사용자를 각 브랜드의 인터페이스에 묶어두는 ‘접착력이 높은’ 생태계를 만들어내고 있습니다. 그 결과, 서비스 수익과 타겟팅 광고 수익이 하드웨어 매출과 병행하여 증가하고 있으며, TV 및 셋톱박스 시장을 견인하고 있습니다.
패널 및 반도체 조달 비용의 급등
디스플레이 유리, 드라이버 IC, 메모리 비용은 2024년 중반 이후 반등 추세를 보이고 있습니다. 동아시아로의 패널 제조 집중으로 인해 각 브랜드는 지정학적 위험 및 물류 위험에 노출되어 있습니다. 소규모 공급업체는 헤지할 여지가 없어 비용을 흡수하거나 소매 가격을 인상하는 것 중 하나를 선택할 수밖에 없어, 이익률에 압박을 가하고 있습니다. 대기업들은 수직 통합 및 장기 웨이퍼 공급 계약을 추진하고 있지만, 이러한 헤지 전략은 TV 및 셋톱박스 시장의 연평균 성장률(CAGR)에 미치는 -1.1%의 하방 압력을 부분적으로만 상쇄하고 있습니다.
부문별 분석
TV 및 셋톱박스 시장에서 TV 시장 규모는 2025년 매출의 65.40%를 차지한 반면, 스트리밍용 동글 및 스틱은 해당 부문에서 가장 높은 연평균 성장률(CAGR) 7.74%를 기록했습니다. 동글은 휴대성, 빠른 설정, 저렴한 가격이라는 장점으로 보급이 확대되면서 기존 케이블 TV 및 위성 방송용 셋톱박스의 입지를 약화시키고 있습니다. 기존 유료 TV가 여전히 영향력을 행사하는 지역에서는 위성 방송과 IP 방송을 모두 지원하는 하이브리드형 셋톱박스가 생방송과 OTT 시청의 두 가지 수요를 모두 충족시키고 있습니다. 한편, 선진국에서는 스마트 TV로의 통합이 진행되고 있어 향후 독립형 동글에 대한 수요는 감소할 전망이지만, 신흥 시장에서는 커넥티드 컨텐츠로의 첫걸음으로서 여전히 저비용의 애드온이 채택되고 있습니다. 각 브랜드는 인터페이스에 광고가 포함된 무료 스트리밍 TV(FAST) 채널을 번들로 제공하는 사례가 늘어나고 있으며, 이를 통해 사용자 참여도와 데이터 수집이 촉진되고 있습니다.
스틱형 기기 간의 가격 경쟁(Roku 대 Amazon Fire TV 및 Xiaomi)은 이익률을 압박하는 한편, 보급 대수를 확대하고 있으며, 이는 결과적으로 광고 인벤토리 증가로 이어지고 있습니다. TV 제조업체들은 패널 내에 동등한 OS 기능을 내장함으로써 대응하며, 밸류체인의 주도권을 유지하고 있습니다. 이러한 줄다리기는 제품의 다양성을 확보하는 한편, 카테고리 경계를 모호하게 만들고 있으며, 많은 가정에서 스마트 TV와 병행하여 여러 스트리밍 기기가 가동되고 있음을 의미합니다. 그 결과, TV 및 셋톱박스 시장의 총 대상 기기 수가 증가하고 있습니다.
TV 및 셋톱박스 시장에서 4K의 점유율은 2025년에 43.85%에 달했으며, 성숙한 생산 수율과 OTT 플랫폼을 통한 풍부한 네이티브 컨텐츠에 힘입어 주기 중반의 교체 수요를 지속적으로 견인하고 있습니다. 교체를 고려하는 사용자들은 주류 패널 크기에서 HD에 비해 눈에 띄는 화질 향상을 실감하고 있으며, 이것이 4K TV의 매력적인 가치를 유지하는 요인 중 하나입니다. 한편, 8K 등급은 연평균 성장률(CAGR) 6.95%로 성장을 지속하고, 있으나, 2024년 출하 대수는 고작 14만 3,000대에 그쳤으며, 이는 컨텐츠 부족과 고가 대에 위치해 있다는 점을 반영하고 있습니다. 그럼에도 불구하고 하드웨어 제조업체들은 평균 판매 가격(ASP)과 브랜드 리더십을 지키기 위해 8K 추진에 주력하고 있습니다.
각 제조업체는 네이티브 컨텐츠 부족을 보완하기 위해 AI 업스케일링을 채택하고 있으며, 본격적인 8K 방송에 앞서 도입 기반을 마련하는 것을 목표로 하고 있습니다. BenQ는 8K의 보급이 빠르면 2031년 이후가 될 것으로 예측하며, 예측 기간 동안 4K가 계속해서 주류를 이룰 것임을 시사하고 있습니다. HD 및 풀 HD는 비용을 중시하는 신흥국, 대역폭 및 컨텐츠 제약으로 인해 4K가 과잉 공급되는 상업시설에서 계속해서 사용되고 있습니다.
지역별 분석
아시아태평양은 2025년 전 세계 매출의 42.20%를 차지했으며, 중국의 대량 생산과 인도의 스마트 TV 가구 보급률 두 자릿수 성장에 힘입어 연평균 성장률(CAGR) 6.53%로 성장할 전망입니다. 국내 유력 기업인 TCL과 하이센스는 낮은 인건비와 정부의 지원책을 활용하여 프리미엄 제품 출하를 가속화하고 있으며, 한국의 기존 기업들과의 격차를 좁혀가고 있습니다. 인도네시아, 베트남, 필리핀 정부의 디지털화 추진 정책으로 판매 대수는 확대되는 한편, 일본과 한국은 8K 시범 도입 및 몰입형 오디오비주얼 규격을 통해 기술적 리더십을 유지하고 있습니다.
북미는 성숙하지만 수익성이 높은 시장이며, 대형 4K 및 8K 패널이 거실의 중심을 차지하고 있습니다. 한국 브랜드는 미국 성인층에서 52%의 판매 대수 점유율을 차지하고 있으며, 이는 확고한 브랜드 가치를 반영합니다. 이 지역에서는 판매 대수 확대보다는 프리미엄 제품으로의 업셀링에 힘입어 매출액 연평균 성장률(CAGR)이 7.92%로 견조한 추세를 보이고 있으며, 소비자들은 음성 비서, 콘솔 게임, 첨단 HDR 규격을 적극적으로 수용하고 있습니다. USMCA 협정에 따른 무역은 멕시코 조립 거점에서의 적시(JIT) 물류를 뒷받침하며, 소매업체의 재고 위험을 완화하고 있습니다.
유럽의 성장은 보다 안정적이지만, 에너지 효율 관련 규제와 아날로그 방송의 조기 종료로 인해 제약을 받고 있습니다. 에코디자인 규제에 따라 전력 절약형 펌웨어와 재활용 가능한 포장이 의무화되어 있으며, 이에 따른 규정 준수 비용 증가는 아시아의 신흥 제조업체들에게는 대응하기 어려울 수 있습니다. 그럼에도 불구하고 독일, 영국, 프랑스에서는 65인치 이상의 4K TV가 선호되고 있으며, OLED 보급률은 서유럽 주요 도시에서 여전히 가장 높습니다. 신흥 시장인 중동유럽에서는 일부 아프리카 국가들과 마찬가지로 디지털 방송 전환에 따른 호재가 나타나고 있으며, 경제 지표가 안정되면 각 브랜드에 있어 장기적인 교체 수요 증가가 예상됩니다.
기타 혜택 :
- 엑셀 형식 시장 예측(ME) 시트
- 3개월간의 애널리스트 지원
자주 묻는 질문
목차
제1장 서론
제2장 조사 방법
제3장 주요 요약
제4장 시장 구도
제5장 시장 규모 및 성장 예측
제6장 경쟁 구도
제7장 시장 기회 및 향후 전망
KTH 26.09.14According to Mordor Intelligence, the television and Set Top Box market size is expected to grow from 307.10 million units in 2025 to 323.9 million units in 2026 and is forecast to reach 422.79 million units by 2031 at 5.47% CAGR over 2026-2031.
This report is Segmented by Product Type (Television, Set-Top Box, Streaming Dongles/Sticks), Resolution (SD, HD/FHD, 4K, 8K and Above), Screen Size (32" and Below, and More), Technology (LCD/LED, QLED/Mini-LED, and More), End-User (Residential, Commercial and Institutional), and Geography (North America, South America, Europe, and More). The Market Forecasts are Provided in Terms of Value (USD).
Global Television And Set Top Box Market Trends and Insights
Rapid Consumer Migration to 4K and 8K UHD Content
Surging demand for higher-resolution screens is compressing replacement cycles and lifting average selling prices. Although 8K hardware exists, limited native content keeps adoption muted, so 4K continues to dominate upgrade decisions. BenQ forecasts that widescale 8K take-up remains at least six years away, reinforcing the mid-term commercial primacy of 4K panels. Samsung's extensive 8K patent portfolio is also likely to influence cost structures and competitive licensing. The Television and Set Top Box market, therefore, leans on 4K as the principal value driver while treating 8K as a longer-run premium pathway.
Smart-TV OS Ecosystems Accelerating Replacement Cycles
Software ecosystems are now the heart of product differentiation. Samsung's 2025 sets integrate Vision AI to tailor recommendations and voice commands. LG is pairing Microsoft Copilot to add productivity features, shortening perceived product life and encouraging 4- to 5-year upgrade intervals. Platform fragmentation, Android TV, Roku, webOS and others, creates sticky ecosystems that lock users into branded interfaces. As a result, service revenue and targeted advertising are growing alongside hardware revenue, boosting the Television And Set Top Box market.
Escalating Panel and Semiconductor Input Costs
Display glass, driver ICs, and memory have seen cost rebound since mid-2024. Concentrated panel fabrication in East Asia exposes brands to geopolitical and logistics risks. Smaller suppliers lack hedge leverage and must either absorb costs or raise retail prices, pressuring margins. Larger firms pursue vertical integration and long-term wafer agreements, but these hedges only partially offset the negative 1.1-percentage-point drag on the Television and Set Top Box market CAGR.
Other drivers and restraints analyzed in the detailed report include:
- Government-Mandated Digital-Switchover Programs
- AI-Enabled Personalized User Interfaces Enhancing ARPU
- Saturation in Developed Markets
For complete list of drivers and restraints, kindly check the Table Of Contents.
Segment Analysis
The Television and Set Top Box market size for televisions retained a 65.40% slice of 2025 revenue, yet streaming dongles and sticks posted the segment's top 7.74% CAGR. Dongles thrive on portability, quick setup, and low entry prices, eroding traditional cable and satellite box relevance. In regions where legacy pay-TV retains sway, hybrid satellite-IP-IP boxes address both linear and OTT viewing. Meanwhile, smart-TV integration lowers future standalone dongle demand in developed economies, but emerging markets still adopt low-cost add-ons as the first step into connected content. Brands increasingly bundle free ad-supported streaming television (FAST) channels in the interface, increasing engagement and data collection.
Price wars in sticks, Roku versus Amazon Fire TV and Xiaomi, compress margins yet expand installed base, which in turn fuels ad inventory. Television manufacturers counter by embedding comparable OS functionality in-panel, retaining value chain control. This tug-of-war ensures product diversity but also blurs category lines, meaning that many households now run multiple streaming devices alongside smart panels, inflating total addressable units within the Television And Set Top Box market.
The Television And Set Top Box market share for 4K rose to 43.85% in 2025 and continues to command mid-cycle upgrades, propelled by mature production yields and abundant native content via OTT platforms. Upgraders see tangible visual benefits over HD at mainstream panel sizes, helping 4K sets maintain compelling value. Conversely, the 8K class, while logging a 6.95% CAGR, shipped only 143,000 units in 2024, reflective of its content deficit and premium price positioning. Hardware makers nevertheless push 8K to defend ASPs and brand leadership.
Manufacturers apply AI upscaling to mitigate native content scarcity, hoping to seed an install base ahead of true 8K broadcast. BenQ anticipates mass adoption no sooner than 2031, suggesting continued dominance of 4K through the forecast period. HD and Full HD persist in cost-focused emerging nations and commercial installations where bandwidth and content constraints make 4K overkill.
Complete Report Scope:
- By Product Type
- Television
- Set-Top Box
- Streaming Dongles/Sticks
- By Resolution
- SD
- HD/FHD
- 4K
- 8K and Above
- By Screen Size
- 32" and Below
- 33-43"
- 44-55"
- 56-64"
- 65-74"
- 75" and Above
- By Technology
- LCD/LED
- QLED / Mini-LED
- OLED
- Laser / Projection TV
- By End-User
- Residential
- Commercial and Institutional
- By Geography
- North America
- United States
- Canada
- Mexico
- South America
- Brazil
- Argentina
- Rest of South America
- Europe
- Germany
- United Kingdom
- France
- Italy
- Rest of Europe
- Asia-Pacific
- China
- Japan
- South Korea
- India
- Rest of Asia-Pacific
- Middle East
- Saudi Arabia
- United Arab Emirates
- Rest of Middle East
- Africa
- South Africa
- Rest of Africa
- North America
Geography Analysis
Asia-Pacific generated 42.20% of global 2025 revenue and will advance at a 6.53% CAGR, fueled by China's scale production and India's double-digit smart-TV household expansion. Domestic champions TCL and Hisense leverage lower labor costs and state incentives to accelerate premium shipments, narrowing the gap with Korean incumbents. Government digital initiatives in Indonesia, Vietnam, and the Philippines enlarge unit volumes, while Japan and South Korea maintain technology leadership through 8K trials and immersive audio-visual standards.
North America presents a mature yet lucrative arena where large-format 4K and 8K panels dominate living-room real estate. Korean brands captured 52% unit share among U.S. adults, reflecting durable brand equity. The region shows solid 7.92% revenue CAGR driven by premium upselling rather than unit expansion, with consumers embracing voice assistants, console gaming, and advanced HDR variants. Trade under the USMCA agreement supports just-in-time logistics from Mexican assembly hubs, moderating inventory risk for retailers.
Europe's growth is steadier, constrained by energy-efficiency mandates and early analog switch-off completion. Eco-design rules force power-saving firmware and recyclable packaging, adding compliance costs that smaller Asian entrants may struggle to meet. Nevertheless, Germany, the UK, and France prioritize 65-inch-plus 4K sets, and OLED adoption remains strongest in Western capitals. Emerging Central and Eastern Europe sees digital switchover tailwinds similar to select African states, affording brands a long-term replacement runway once economic indicators stabilize.
- Samsung Electronics Co., Ltd.
- LG Electronics Inc.
- TCL Technology Group Corp.
- Hisense Co., Ltd.
- Sony Group Corporation
- Panasonic Holdings Corporation
- Sharp Corporation
- Vizio Holding Corp.
- Skyworth Group Co., Ltd.
- Xiaomi Corporation
- Haier Smart Home Co., Ltd.
- Koninklijke Philips N.V.
- TP Vision
- Toshiba Corporation
- Arris International Ltd. (CommScope)
- Technicolor S.A.
- Humax Co., Ltd.
- Sagemcom SAS
- ZTE Corporation
- Kaon Media Co., Ltd.
- Evolution Digital LLC
- Coship Electronics Co., Ltd.
- Intek Digital Inc.
- Gospell Digital Technology Co., Ltd.
- Roku, Inc.
- Amazon.com, Inc. (Fire TV)
Additional Benefits:
- The market estimate (ME) sheet in Excel format
- 3 months of analyst support
TABLE OF CONTENTS
1 INTRODUCTION
- 1.1 Study Assumptions and Market Definition
- 1.2 Scope of the Study
2 RESEARCH METHODOLOGY
3 EXECUTIVE SUMMARY
4 MARKET LANDSCAPE
- 4.1 Market Overview
- 4.2 Market Drivers
- 4.2.1 Rapid consumer migration to 4K and 8K UHD content
- 4.2.2 Smart-TV OS ecosystems accelerating replacement cycles
- 4.2.3 Government-mandated digital-switchover programs
- 4.2.4 AI-enabled personalised user interfaces enhancing ARPU
- 4.2.5 Edge-based interactive-advertising subsidisation models
- 4.2.6 LEO-satellite hybrid DTH-IP roll-outs expanding rural reach
- 4.3 Market Restraints
- 4.3.1 Escalating panel and semiconductor input costs
- 4.3.2 Saturation in developed markets
- 4.3.3 Cord-shifting to mobile/PC reduces TV viewing hours
- 4.3.4 Imminent carbon and e-waste regulation on large displays
- 4.4 Industry Value Chain Analysis
- 4.5 Regulatory Landscape
- 4.6 Technological Outlook
- 4.7 Porter's Five Forces Analysis
- 4.7.1 Bargaining Power of Suppliers
- 4.7.2 Bargaining Power of Consumers
- 4.7.3 Threat of New Entrants
- 4.7.4 Intensity of Competitive Rivalry
- 4.7.5 Threat of Substitutes
- 4.8 Pricing Analysis
- 4.9 Impact of Macroeconomic Factors on the Market
- 4.10 Investment Analysis
5 MARKET SIZE AND GROWTH FORECASTS (VALUE)
- 5.1 By Product Type
- 5.1.1 Television
- 5.1.2 Set-Top Box
- 5.1.3 Streaming Dongles/Sticks
- 5.2 By Resolution
- 5.2.1 SD
- 5.2.2 HD/FHD
- 5.2.3 4K
- 5.2.4 8K and Above
- 5.3 By Screen Size
- 5.3.1 32" and Below
- 5.3.2 33-43"
- 5.3.3 44-55"
- 5.3.4 56-64"
- 5.3.5 65-74"
- 5.3.6 75" and Above
- 5.4 By Technology
- 5.4.1 LCD/LED
- 5.4.2 QLED / Mini-LED
- 5.4.3 OLED
- 5.4.4 Laser / Projection TV
- 5.5 By End-User
- 5.5.1 Residential
- 5.5.2 Commercial and Institutional
- 5.6 By Geography
- 5.6.1 North America
- 5.6.1.1 United States
- 5.6.1.2 Canada
- 5.6.1.3 Mexico
- 5.6.2 South America
- 5.6.2.1 Brazil
- 5.6.2.2 Argentina
- 5.6.2.3 Rest of South America
- 5.6.3 Europe
- 5.6.3.1 Germany
- 5.6.3.2 United Kingdom
- 5.6.3.3 France
- 5.6.3.4 Italy
- 5.6.3.5 Rest of Europe
- 5.6.4 Asia-Pacific
- 5.6.4.1 China
- 5.6.4.2 Japan
- 5.6.4.3 South Korea
- 5.6.4.4 India
- 5.6.4.5 Rest of Asia-Pacific
- 5.6.5 Middle East
- 5.6.5.1 Saudi Arabia
- 5.6.5.2 United Arab Emirates
- 5.6.5.3 Rest of Middle East
- 5.6.6 Africa
- 5.6.6.1 South Africa
- 5.6.6.2 Rest of Africa
- 5.6.1 North America
6 COMPETITIVE LANDSCAPE
- 6.1 Market Concentration
- 6.2 Strategic Moves
- 6.3 Market Share Analysis
- 6.4 Company Profiles (includes Global level Overview, Market level overview, Core Segments, Financials as available, Strategic Information, Market Rank/Share for key companies, Products and Services, and Recent Developments)
- 6.4.1 Samsung Electronics Co., Ltd.
- 6.4.2 LG Electronics Inc.
- 6.4.3 TCL Technology Group Corp.
- 6.4.4 Hisense Co., Ltd.
- 6.4.5 Sony Group Corporation
- 6.4.6 Panasonic Holdings Corporation
- 6.4.7 Sharp Corporation
- 6.4.8 Vizio Holding Corp.
- 6.4.9 Skyworth Group Co., Ltd.
- 6.4.10 Xiaomi Corporation
- 6.4.11 Haier Smart Home Co., Ltd.
- 6.4.12 Koninklijke Philips N.V.
- 6.4.13 TP Vision
- 6.4.14 Toshiba Corporation
- 6.4.15 Arris International Ltd. (CommScope)
- 6.4.16 Technicolor S.A.
- 6.4.17 Humax Co., Ltd.
- 6.4.18 Sagemcom SAS
- 6.4.19 ZTE Corporation
- 6.4.20 Kaon Media Co., Ltd.
- 6.4.21 Evolution Digital LLC
- 6.4.22 Coship Electronics Co., Ltd.
- 6.4.23 Intek Digital Inc.
- 6.4.24 Gospell Digital Technology Co., Ltd.
- 6.4.25 Roku, Inc.
- 6.4.26 Amazon.com, Inc. (Fire TV)
7 MARKET OPPORTUNITIES AND FUTURE OUTLOOK
- 7.1 White-space and Unmet-need Assessment


