

|
시장보고서
상품코드
2124731
스마트 TV 및 셋톱박스 시장 : 시장 점유율 분석, 업계 동향 및 통계, 성장 예측(2026-2031년)Smart Television And Set-Top Box - Market Share Analysis, Industry Trends & Statistics, Growth Forecasts (2026 - 2031) |
||||||
 Mordor Intelligence
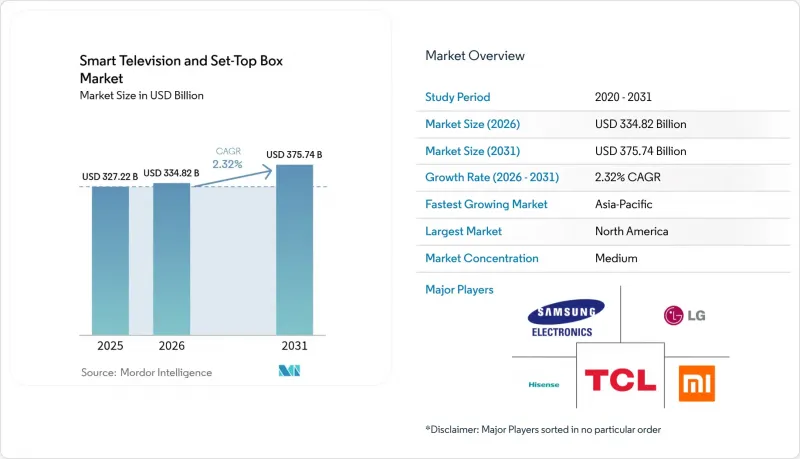
Mordor Intelligence에 의하면, 스마트 TV 및 셋톱박스 시장 규모는 2025년 3,272억 2,000만 달러로 평가되었고, 2026년에는 3,348억 2,000만 달러로 추정되고, 2026-2031년 CAGR 2.32%로 성장을 지속할 전망이며, 2031년까지 3,757억 4,000만 달러에 이를 것으로 예측됩니다.
본 보고서는 기술별(위성방송/DTH, IPTV 등), 해상도별(SD 등), 화면 크기별(32인치 이하 등), 디스플레이 기술별(LCD/LED 등), OS/플랫폼별(Android/Google TV 등), 판매 채널별(오프라인 소매, 온라인/전자상거래), 최종 사용자별(가정 등) 및 지역별로 분류되어 있습니다. 시장 예측은 금액(달러) 기준으로 제시되어 있습니다.
세계의 스마트 TV 및 셋톱박스 시장 동향 및 인사이트
스트리밍 플랫폼 가입자 수의 급증으로 기기 교체 촉진
2024년 6월에는 총 시청 시간의 대부분을 스트리밍이 차지하게 되었으며, 이 전환점을 계기로 대역폭을 대량으로 소비하는 앱에 대응하는 연결형 4K TV로, 기존의 평면 패널 TV에서 가정 내 업그레이드가 가속화되고 있습니다. 유럽과 아시아의 통신 사업자들은 고객 이탈을 방지하기 위해 스마트 TV를 광섬유 패키지와 함께 판매하고 있으며, 이러한 추세는 북미 이외의 지역으로도 확산되고 있습니다. 각 제조업체는 더 빠른 프로세서와 추가 메모리로 이에 대응하고 있지만, 기존 STB 공급업체들은 구형 칩셋으로는 AV1 등 최신 코덱을 디코딩할 수 없어 어려움을 겪고 있습니다. 이러한 교체 열풍은 100 Mbps 서비스가 보편적인 도시 지역의 광대역 회선 지역을 따라 확산되고 있으며, 교체 주기를 5년 이하로 단축시키고 있습니다. 광범위한 앱 생태계와 음성 비서를 갖춘 브랜드는 하드웨어 이익률이 하락하고 있음에도 불구하고, 대당 가치 상승분을 확보하고 있습니다.
고해상도, 4K, 8K 방송 표준으로의 전환
일본의 NHK는 2024년 스포츠 행사를 앞두고 8K 위성 방송 규모를 확대하고 있으며, 한국의 방송사들은 2026년까지 ATSC 3.0을 통한 4K 지상파 방송을 전개하겠다고 약속했습니다. 이러한 움직임은 2030년까지 SD 신호를 단계적으로 폐지하겠다는 유럽의 지침과 일치하며, 차세대 패널에 내장된 튜너에 대한 필수적인 수요를 창출하고 있습니다. 4K 패널 생산 라인은 이미 전 세계 LCD 생산 능력의 상당 부분을 차지하고 있어 단가가 하락하고 있으며, 중견 브랜드들은 네이티브 4K TV를 기존의 풀HD 가격대로 판매할 수 있게 되었습니다. 그 결과, 소비자들은 4K를 새로운 표준으로 인식하게 되었으며, 한편 얼리 어답터층은 대형 스크린 홈 시어터 및 상업용 사이니지용으로 8K에 주목하고 있습니다.
치열한 경쟁이 업체들의 이익률을 압박
TCL과 Hisense는 물류비 및 부품 비용을 절감하는 중국의 통합 공급망을 활용하여, Mini-LED TV 가격을 삼성이나 LG의 동급 제품보다 30% 낮게 책정함으로써 2024년에도 시장 점유율을 계속 확대했습니다. IPTV 모델용 셋톱박스의 계약 가격은 현재 15달러 미만으로 떨어져 통신 사업자의 보조금이 압박을 받으면서 공급업체의 수익성이 저하되고 있습니다. 규제 당국의 감시도 압박을 가중시키고 있습니다. 2024년, 미국 연방거래위원회(FTC)는 데이터 수집 관련 위반 행위를 이유로 Vizio에 벌금을 부과하고, 시청자 분석을 기반으로 한 상쇄적 수익원을 제한했습니다. 그 결과, 유서 깊은 브랜드들은 규모의 경제와 소프트웨어 기반의 수익 다각화가 보상을 받는 상황에서 이익률 압박을 극복하기 위해 노력하고 있습니다.
부문 분석
2025년, 하이브리드 및 OTT 기기는 스마트 TV 및 셋톱박스 시장 점유율의 38.00%를 차지하며 가장 큰 비중을 차지했습니다. 또한 2031년까지 연평균 성장률(CAGR) 3.96%라는 가장 높은 성장률을 나타낼 것으로 예측됩니다. 북미 및 유럽의 사업자들은 리니어 채널과 스트리밍 라이브러리를 통합한 Android TV Operator Tier 하드웨어를 도입하고 있으며, 이는 가입자 수 감소를 막는 데 도움이 되고 있습니다. DirecTV 및 동종 업계 경쟁사들이 순수 스트리밍 서비스로 자본을 재분배함에 따라, 위성 셋톱박스로 인한 스마트 TV 및 셋톱박스 시장 규모는 계속 축소되고 있는 반면, IPTV 셋톱박스는 아시아태평양 및 중동의 광섬유 구축에서 여전히 중요한 역할을 하고 있습니다. 케이블 STB는 코드 커팅 및 개방형 표준을 권장하는 규제 의무화의 영향을 받고 있습니다. 예측 기간 동안 차별화의 초점은 독자적인 사양의 하드웨어에서 음성 내비게이션, 클라우드 DVR, 타겟 광고를 가능하게 하는 소프트웨어 업데이트로 이동할 것입니다.
또한 하이브리드 솔루션은 유료 TV 사업자에게 비디오 헤드엔드 전체를 교체하지 않고도 대역폭, 로컬 캐시, 서비스 개인화의 균형을 맞출 수 있는 수단을 제공합니다. 이는 공통 SoC 제품군을 활용함으로써 개발 주기를 단축하고 무선 기능 업데이트를 가능하게 합니다. 베트남과 멕시코의 수탁 제조업체에게 있어 이러한 전환은 기존 리모컨에 비해 부품 원가(BOM)의 가치를 높여, 평균 판매 가격 하락에 대한 이익률의 완충 역할을 합니다. 그러나 설계 채택의 성패는 현재 데이터 수집에 대한 명확한 옵트아웃 수단을 의무화하는 개인정보 보호 프레임워크의 준수에 달려 있어, 펌웨어 및 인증의 복잡성이 증가하고 있습니다.
4K UHD 제품군은 2025년 출하 대수의 45.02%를 차지했으며, 패널 수율 향상과 컨텐츠 라이브러리 확충에 따라 2031년까지 40%를 상회하는 수준을 유지할 것으로 예측됩니다. 8K TV는 현재 시장 점유율이 한 자릿수 중반에 머물러 있지만, NHK의 8K 방송과 삼성의 마이크로 RGB 디스플레이에 대한 집중에 힘입어 연평균 성장률(CAGR) 3.05%로 성장을 지속하고, 있습니다. 8K 관련 스마트 TV 및 셋톱박스 시장 규모는 높은 화소 밀도에 대해 비싼 가격을 기꺼이 지불하는 홈 시어터 애호가와 디지털 사이니지 구매자에 크게 의존하고 있습니다. 표준 해상도 제품은 아프리카와 동남아시아의 보조금 주도 전환 프로그램을 통해 여전히 존재하고 있지만, 각국 정부가 아날로그 방송을 단계적으로 폐지함에 따라 그 추세는 감소하고 있습니다.
소비자들은 55인치 이상의 거실용 디스플레이에서 4K가 새로운 표준이라고 인식하고 있으며, 65인치 4K TV의 평균 판매 가격은 2024년에 전년 대비 8% 더 하락했습니다. 공급망의 효율화로 인해 각 브랜드는 큰 가격 인상 없이 120Hz 패널과 HDMI 2.1 포트를 기본 사양으로 탑재할 수 있게 되어, 게이머들에게 더 큰 매력을 어필하고 있습니다. 대조적으로, 8K 제조업체들은 풀 해상도 컨텐츠가 주류가 될 2028년 이후까지 AI 기반 업스케일링과 마이크로 LED 기술의 발전을 무기로 가격 차이를 정당화하려 하고 있습니다.
55-65인치 TV는 2025년 판매 대수의 41.05%를 차지했으며, 거실에서의 사용 편의성과 패널 비용 하락 사이의 균형을 잘 맞추고 있습니다. 한편, 66인치 이상의 화면 크기는 3.55%라는 가장 높은 연평균 성장률(CAGR)을 기록하고 있으며, 이는 고급 홈 시어터 구축과 호텔·관광 업계 및 소매 업계에서의 디지털 사이니지 도입을 반영한 것입니다. 66인치 이상 디스플레이를 대상으로 하는 스마트 TV 및 셋톱박스 시장 규모는 높은 가처분 소득으로 인해 대형 디스플레이 수요를 뒷받침하는 미국, 걸프협력회의(GCC) 국가들, 그리고 일본에 집중되어 있습니다. 반면, 32인치 및 33-43인치 모델은 여전히 아시아와 라틴아메리카의 공간이 제한적인 도시 지역 아파트용으로 제공되고 있으며, 안정적인 교체 주기를 유지하고 있습니다.
호텔 체인 등 법인 고객은 가구 배치상의 제약이나 시청 거리상의 이유로 43-55인치 크기를 선호하는 경향이 있지만, 외부 미디어 플레이어 없이 시설 관리 시스템과 통합할 수 있는 LG Pro Centric과 같은 소프트웨어에는 기꺼이 비용을 지불할 의향이 있습니다. 중국 제조 공장에서 대형 유리 기판으로의 전환에 따라, 75인치 패널이 이전에는 55인치 제품이 차지하던 가격대에 위치하게 되었으며, 이는 주거용 시장의 교체 수요를 더 큰 화면 크기로 이끌고 있습니다.
지역별 분석
아시아태평양은 중국, 한국, 일본에 제조 거점이 집중되어 있을 뿐만 아니라, 인도와 동남아시아의 가처분 소득 증가로 인해 지역별 점유율에서 가장 큰 비중을 차지하고 있습니다. 중국에서는 2024년에 4,000만 대 이상의 스마트 TV가 판매될 전망이며, TCL, Hisense, Xiaomi가 가격과 기능의 동등성을 놓고 경쟁을 펼치고 있습니다. 인도의 생산 연계 인센티브(PLI) 프로그램은 Dixon Technologies와 Amber Enterprises의 투자를 유치하여 국내 패널 조립 체계를 구축했습니다. 이를 통해 수입 의존도가 낮아지고 관세 변동에 대한 내성이 향상되었습니다. 일본과 한국은 프리미엄 틈새 시장을 독점하고 있으며, 소니와 삼성은 초기 단계에 있는 8K 방송 생태계와 강력한 브랜드 파워를 활용하여 평균 판매 가격(ASP)을 끌어올리고 있습니다. 인도네시아, 베트남, 태국은 광대역의 급속한 보급과 3년 이내에 아날로그 방송 이용 가구를 디지털화하기 위한 정부의 셋톱박스 보조금 혜택을 받고 있습니다.
북미와 유럽은 성숙한 시장으로, 교체 수요, 프리미엄 부문의 성장 여지, 유료 TV 번들 계약에서 알라카르트형 스트리밍으로의 지속적인 전환이 특징입니다. 2024년 12월 월마트가 비지오(Vizio)를 23억 달러에 인수한 것은 소매업체들이 광고 수익 확보를 목표로 하고 있음을 여실히 보여줍니다. 미국은 65인치 이상의 대형 TV와 음성 비서를 적극 활용한 인터페이스의 조기 도입에서 두드러지고 있습니다. 캐나다에서는 미국과 마찬가지로우코드 커팅이 진행되고 있지만, 멕시코에서는 2026년에 지상파 디지털 전환이 완료될 예정이므로 여전히 STB(셋톱박스)에 대한 보조금 지원이 지속되고 있습니다. 유럽의 GDPR(EU 개인정보보호규정)(일반 데이터 보호 규정)은 컨텐츠의 자동 인식을 제한하여 각 OEM 업체의 데이터 수익화 기회를 좁히고 있지만, ATSC와 유사한 DVB-T2로의 업그레이드가 4K 보급을 뒷받침하고 있습니다. 독일, 프랑스, 영국은 유럽 매출의 60% 이상을 차지하고 있으며, 신흥 브랜드보다 삼성, LG, 소니의 품질과 사후 서비스가 더 중요시되고 있습니다.
남미, 중동 및 아프리카에서는 급속한 디지털 전환 노력과 확대되는 중산층의 소비가 맞물리고 있으며, 브라질에서는 Mercado Livre의 전자상거래 할부 결제 플랜에 힘입어 2024년 스마트 TV 판매가 두 자릿수 성장을 기록했습니다. 한편, 아르헨티나에서는 거시경제적 역풍으로 인해 판매 대수가 정체되었으나, 미뤄졌던 교체 수요가 2026년까지 누적되고 있습니다. 걸프협력회의(GCC) 국가들에서는 75인치 이상의 패널에 대한 수요가 높아지고 있어, 삼성과 LG에게 강력한 수요 견인 요인으로 작용하고 있습니다. 튀르키예는 북아프리카 인근 국가들에 제품을 공급하는 제조 거점으로서의 역할을 수행하고 있습니다. 남아프리카공화국에서는 2024년 3월 아날로그 방송 종료가 완료되면서 저가형 지상파 디지털 수신기(DTT 박스) 수요가 일시적으로 급증했습니다. 한편, 케냐와 나이지리아는 중국의 ODM 공급을 우대하는 보조금 프로그램을 도입하여 2027년 마감 시한을 향해 진전을 보이고 있습니다.
기타 혜택 :
- 엑셀 형식 시장 예측(ME) 시트
- 3개월간의 애널리스트 지원
자주 묻는 질문
목차
제1장 서론
제2장 조사 방법
제3장 주요 요약
제4장 시장 구도
제5장 시장 규모 및 성장 예측
제6장 경쟁 구도
제7장 시장 기회 및 향후 전망
AJY 26.09.15According to Mordor Intelligence, the smart television and set-top box market size is expected to grow from USD 327.22 billion in 2025 to USD 334.82 billion in 2026 and is forecast to reach USD 375.74 billion by 2031 at 2.32% CAGR over 2026-2031.
This report is Segmented by Technology (Satellite/DTH, IPTV, and More), Resolution (SD, and More), Display Size (32 and Below, and More), Display Technology (LCD/LED, and More), Operating System (Android/Google TV, and More), Distribution Channel (Offline Retail, and Online/E-Commerce), End User (Residential, and More), and Geography. The Market Forecasts are Provided in Terms of Value (USD).
Global Smart Television And Set-Top Box Market Trends and Insights
Surging Streaming Platform Subscriptions Driving Device Refresh
Streaming took a majority share of total viewing in June 2024, and the milestone has accelerated household upgrades from legacy flat panels to connected 4K units that support bandwidth-intensive apps. Operators in Europe and Asia bundle smart televisions with fiber packages to curb churn, extending the trend beyond North America. Manufacturers answer with faster processors and extra memory, but legacy STB vendors struggle because older chipsets cannot decode modern codecs such as AV1. The refresh wave propagates along urban broadband corridors where 100 Mbps service is common, shortening replacement cycles to five years or less. Brands positioned with wide app ecosystems and voice assistants capture the uplift in unit value even as hardware margins thin.
Transition to High-Definition, 4K and 8K Broadcasting Standards
Japan's NHK scaled its 8K satellite feeds for the 2024 sporting calendar, and South Korean broadcasters committed to 4K over-air rollouts via ATSC 3.0 by 2026. These moves align with European directives that phase out SD signals by 2030, creating mandatory demand for tuners embedded in next-generation panels. As 4K panel lines already account for most global LCD capacity, per-unit costs fall, letting mid-tier brands ship native-4K sets at historical full-HD prices. Consumers consequently perceive 4K as the new baseline, while early adopters gravitate to 8K for large-screen home theaters and commercial signage.
Intense Price Competition Compressing Vendor Margins
TCL and Hisense continued to grow share in 2024 by pricing Mini-LED televisions 30% below Samsung and LG equivalents, leveraging integrated Chinese supply chains that shave logistics and component costs. Set-top box contract prices now dip under USD 15 for IPTV models, squeezing operator subsidies and eroding vendor profitability. Regulatory scrutiny adds pressure: the U.S. Federal Trade Commission fined Vizio for data-collection infractions in 2024, restricting an offsetting revenue stream based on viewer analytics. Established brands therefore navigate a margin squeeze that rewards economies of scale and software-based revenue diversification.
Other drivers and restraints analyzed in the detailed report include:
- Government Digital Switchover Mandates in Emerging Nations
- AI-Based Upscaling Enhancing Value of Legacy Content
- Proliferation of Low-Cost Streaming Sticks Cannibalizing STBs
For complete list of drivers and restraints, kindly check the Table Of Contents.
Segment Analysis
Hybrid and OTT devices accounted for the largest slice of the smart television and set-top box market share at 38.00% in 2025 and are projected to notch the fastest 3.96% CAGR to 2031. Operators in North America and Europe deploy Android TV Operator Tier hardware that merges linear channels with streaming libraries, helping them stem subscriber losses. The smart television and set-top box market size attributable to satellite STBs continues to shrink as DirecTV and peers reallocate capital toward pure streaming services, whereas IPTV boxes remain critical in fiber rollouts across Asia Pacific and the Middle East. Cable STBs suffer from cord-cutting and regulatory mandates favouring open standards. Over the forecast period, differentiation tilts from proprietary hardware to software updates that enable voice navigation, cloud DVR, and targeted advertising.
Hybrid solutions also give pay-TV providers tools to balance bandwidth, local caching, and service personalization without replacing entire video head-ends. They leverage common SoC families, cutting development cycles and enabling feature updates over-the-air. For contract manufacturers in Vietnam and Mexico, the pivot unlocks higher bill-of-materials value compared to legacy zappers, cushioning margins against falling average selling prices. That said, design wins now hinge on compliance with privacy frameworks that compel clear opt-out pathways for data collection, adding firmware and certification complexities.
The 4K UHD cohort held 45.02% of 2025 shipments, a level expected to stay north of 40% through 2031 as panel yields rise and content libraries broaden. 8K sets, while only a mid-single digit share today, show a 3.05% CAGR driven by NHK's 8K broadcasts and Samsung's push into Micro RGB displays. The smart television and set-top box market size tied to 8K leans heavily on home-theater enthusiasts and digital signage buyers willing to pay premiums for high pixel density. Standard-definition units linger in subsidy-driven switch-over programs across Africa and Southeast Asia but trend downward as governments phase out analog feeds.
Consumers perceive 4K as the new normal for living-room screens 55 inches and larger, and average selling prices for 65-inch 4K sets fell another 8% year on year in 2024. Supply-chain efficiencies permit brands to bundle 120 Hz panels and HDMI 2.1 ports without hefty price premiums, boosting appeal to gamers. In contrast, 8K makers bank on AI-based upscaling and Micro-LED advances to justify valuation gaps until full-resolution content becomes mainstream, likely post-2028.
Sets measuring 55-65 inches controlled 41.05% of 2025 units, balancing living-room ergonomics with falling panel costs. Screens 66 inches and above, however, record the highest 3.55% CAGR, reflecting premium home-cinema builds and digital signage rollouts in hospitality and retail. The smart television and set-top box market size for 66-inch plus displays skews toward the United States, the Gulf Cooperation Council, and Japan, where disposable incomes support bigger footprints. Conversely, 32-inch and 33-43-inch models still cater to space-limited urban apartments in Asia and Latin America, sustaining steady replacement cycles.
Commercial buyers such as hotel chains prefer 43-55-inch sizes owing to furniture constraints and viewing distances yet are willing to pay for software like LG Pro:Centric that integrates property-management systems without external media players. The migration to larger glass substrates at Chinese fabs now positions 75-inch panels at price points previously occupied by 55-inch sets, nudging residential up-graders toward bigger diagonals.
Complete Report Scope:
- By Technology (Set-Top Box)
- Satellite / DTH
- IPTV
- Cable
- Hybrid / OTT
- By Resolution
- SD
- HD / FHD
- 4K UHD
- 8K and Higher
- By Display Size (in Inches)
- 32 and Below
- 33-43
- 44-55
- 56-65
- 66 and Above
- By Display Technology
- LCD / LED
- OLED
- QLED / Mini-LED
- Micro-LED
- By Operating System / Platform
- Android / Google TV
- Tizen
- webOS
- Roku TV OS
- Fire TV OS
- By Distribution Channel
- Offline Retail
- Online / E-Commerce
- By End User
- Residential
- Commercial / Hospitality
- Institutional
- By Geography
- North America
- United States
- Canada
- Mexico
- South America
- Brazil
- Argentina
- Europe
- Germany
- United Kingdom
- France
- Italy
- Spain
- Russia
- Asia Pacific
- China
- Japan
- India
- South Korea
- Southeast Asia
- Middle East
- Gulf Cooperation Council
- Turkey
- Africa
- South Africa
- North America
Geography Analysis
Asia Pacific holds the largest regional share owing to concentrated manufacturing in China, South Korea, and Japan, and to rising disposable incomes in India and Southeast Asia. China sold more than 40 million smart TVs in 2024, with TCL, Hisense, and Xiaomi fighting on price and feature parity. India's Production-Linked Incentive program lured investments from Dixon Technologies and Amber Enterprises to build domestic panel assembly, cutting import dependence and adding resilience against tariff shifts. Japan and South Korea dominate premium niches; Sony and Samsung leverage early 8K broadcast ecosystems and strong brand pull to push ASPs higher. Indonesia, Vietnam, and Thailand benefit from rapid broadband rollouts and government set-top subsidies that convert analog households to digital within three years.
North America and Europe represent mature territories shaped by replacement demand, premium segment upside, and an ongoing pivot from pay-TV bundles to a la carte streaming. Walmart's USD 2.3 billion acquisition of Vizio in December 2024 underscores retailers' bid to harness advertising revenue. The United States stands out for early adoption of 65-inch-plus screens and voice-assistant-heavy interfaces. Canada mirrors U.S. cord-cutting, while Mexico still enjoys STB subsidy support as its digital-terrestrial transition finalizes in 2026. Europe's GDPR regime restricts automatic content recognition, curtailing data-monetization opportunities for OEMs, while ATSC-like DVB-T2 upgrades push 4K adoption. Germany, France, and the United Kingdom make up over 60% of European sales, favouring quality and after-sales support from Samsung, LG, and Sony over emerging brands.
South America, the Middle East, and Africa combine rapid digital-switch initiatives with growing middle-class consumption. Brazil booked double-digit smart TV growth in 2024, supported by e-commerce instalment plans from Mercado Livre, while Argentina's macro headwinds stalled volume though deferred replacement demand builds into 2026. Gulf Cooperation Council countries gravitate toward 75-inch plus panels, delivering strong value pull for Samsung and LG. Turkey functions as a manufacturing hub feeding neighbouring states in North Africa. South Africa's analog switch-off completed in March 2024, creating a one-time surge for low-cost DTT boxes, while Kenya and Nigeria progress toward 2027 deadlines with subsidy programs that favour Chinese ODM supply.
- Samsung Electronics Co., Ltd.
- LG Electronics Inc.
- TCL Technology Group Corp.
- Hisense Group Co., Ltd.
- Sony Group Corporation
- Panasonic Holdings Corporation
- Vizio Holding Corp.
- Skyworth Group Ltd.
- Sharp Corporation
- Xiaomi Corporation
- Roku, Inc.
- Amazon.com, Inc. (Fire TV Devices)
- Apple Inc.
- CommScope Holding Company, Inc.
- VANTIVA SA (formerly Technicolor SA)
- Sagemcom SAS
- HUMAX Holdings Co., Ltd.
- Kaonmedia Co., Ltd.
- ZTE Corporation
- Shenzhen Skyworth Digital Technology Co., Ltd.
- Evolution Digital, LLC
- Shenzhen SDMC Technology Co., Ltd.
- Echostar Corporation
- Advance Digital Broadcast SA
Additional Benefits:
- The market estimate (ME) sheet in Excel format
- 3 months of analyst support
TABLE OF CONTENTS
1 INTRODUCTION
- 1.1 Study Assumptions and Market Definition
- 1.2 Scope of the Study
2 RESEARCH METHODOLOGY
3 EXECUTIVE SUMMARY
4 MARKET LANDSCAPE
- 4.1 Market Overview
- 4.2 Market Drivers
- 4.2.1 Surging Streaming Platform Subscriptions Driving Device Refresh
- 4.2.2 Transition to High-Definition, 4K and 8K Broadcasting Standards
- 4.2.3 Government Digital Switchover Mandates in Emerging Nations
- 4.2.4 AI-Based Upscaling Enhancing Value of Legacy Content
- 4.2.5 Retailer-Owned Smart-TV Ad Platforms Expanding OEM Revenue Streams
- 4.2.6 Domestic Manufacturing Incentives Reducing STB Production Costs
- 4.3 Market Restraints
- 4.3.1 Intense Price Competition Compressing Vendor Margins
- 4.3.2 Proliferation of Low-Cost Streaming Sticks Cannibalizing STBs
- 4.3.3 Panel Tariff Realignments Disrupting Display Supply Chains
- 4.3.4 Data-Privacy Regulations Curbing Smart-TV Data Monetisation
- 4.4 Industry Value-Chain Analysis
- 4.5 Regulatory Landscape
- 4.6 Technological Outlook
- 4.7 Impact of Macroeconomic Factors on the Market
- 4.8 Porter's Five Forces Analysis
- 4.8.1 Threat of New Entrants
- 4.8.2 Bargaining Power of Buyers
- 4.8.3 Bargaining Power of Suppliers
- 4.8.4 Threat of Substitutes
- 4.8.5 Intensity of Competitive Rivalry
5 MARKET SIZE AND GROWTH FORECASTS (VALUE)
- 5.1 By Technology (Set-Top Box)
- 5.1.1 Satellite / DTH
- 5.1.2 IPTV
- 5.1.3 Cable
- 5.1.4 Hybrid / OTT
- 5.2 By Resolution
- 5.2.1 SD
- 5.2.2 HD / FHD
- 5.2.3 4K UHD
- 5.2.4 8K and Higher
- 5.3 By Display Size (in Inches)
- 5.3.1 32 and Below
- 5.3.2 33-43
- 5.3.3 44-55
- 5.3.4 56-65
- 5.3.5 66 and Above
- 5.4 By Display Technology
- 5.4.1 LCD / LED
- 5.4.2 OLED
- 5.4.3 QLED / Mini-LED
- 5.4.4 Micro-LED
- 5.5 By Operating System / Platform
- 5.5.1 Android / Google TV
- 5.5.2 Tizen
- 5.5.3 webOS
- 5.5.4 Roku TV OS
- 5.5.5 Fire TV OS
- 5.6 By Distribution Channel
- 5.6.1 Offline Retail
- 5.6.2 Online / E-Commerce
- 5.7 By End User
- 5.7.1 Residential
- 5.7.2 Commercial / Hospitality
- 5.7.3 Institutional
- 5.8 By Geography
- 5.8.1 North America
- 5.8.1.1 United States
- 5.8.1.2 Canada
- 5.8.1.3 Mexico
- 5.8.2 South America
- 5.8.2.1 Brazil
- 5.8.2.2 Argentina
- 5.8.3 Europe
- 5.8.3.1 Germany
- 5.8.3.2 United Kingdom
- 5.8.3.3 France
- 5.8.3.4 Italy
- 5.8.3.5 Spain
- 5.8.3.6 Russia
- 5.8.4 Asia Pacific
- 5.8.4.1 China
- 5.8.4.2 Japan
- 5.8.4.3 India
- 5.8.4.4 South Korea
- 5.8.4.5 Southeast Asia
- 5.8.5 Middle East
- 5.8.5.1 Gulf Cooperation Council
- 5.8.5.2 Turkey
- 5.8.6 Africa
- 5.8.6.1 South Africa
- 5.8.1 North America
6 COMPETITIVE LANDSCAPE
- 6.1 Market Concentration
- 6.2 Strategic Moves
- 6.3 Market Share Analysis
- 6.4 Company Profiles (includes Global Level Overview, Market Level Overview, Core Segments, Financials as available, Strategic Information, Market Rank/Share for key companies, Products and Services, and Recent Developments)
- 6.4.1 Samsung Electronics Co., Ltd.
- 6.4.2 LG Electronics Inc.
- 6.4.3 TCL Technology Group Corp.
- 6.4.4 Hisense Group Co., Ltd.
- 6.4.5 Sony Group Corporation
- 6.4.6 Panasonic Holdings Corporation
- 6.4.7 Vizio Holding Corp.
- 6.4.8 Skyworth Group Ltd.
- 6.4.9 Sharp Corporation
- 6.4.10 Xiaomi Corporation
- 6.4.11 Roku, Inc.
- 6.4.12 Amazon.com, Inc. (Fire TV Devices)
- 6.4.13 Apple Inc.
- 6.4.14 CommScope Holding Company, Inc.
- 6.4.15 VANTIVA SA (formerly Technicolor SA)
- 6.4.16 Sagemcom SAS
- 6.4.17 HUMAX Holdings Co., Ltd.
- 6.4.18 Kaonmedia Co., Ltd.
- 6.4.19 ZTE Corporation
- 6.4.20 Shenzhen Skyworth Digital Technology Co., Ltd.
- 6.4.21 Evolution Digital, LLC
- 6.4.22 Shenzhen SDMC Technology Co., Ltd.
- 6.4.23 Echostar Corporation
- 6.4.24 Advance Digital Broadcast SA
7 MARKET OPPORTUNITIES AND FUTURE OUTLOOK
- 7.1 White-Space and Unmet-Need Assessment


