

|
시장보고서
상품코드
2124684
창고 자동화 시장 : 시장 점유율 분석, 업계 동향 및 통계, 성장 예측(2026-2031년)Warehouse Automation - Market Share Analysis, Industry Trends & Statistics, Growth Forecasts (2026 - 2031) |
||||||
 Mordor Intelligence
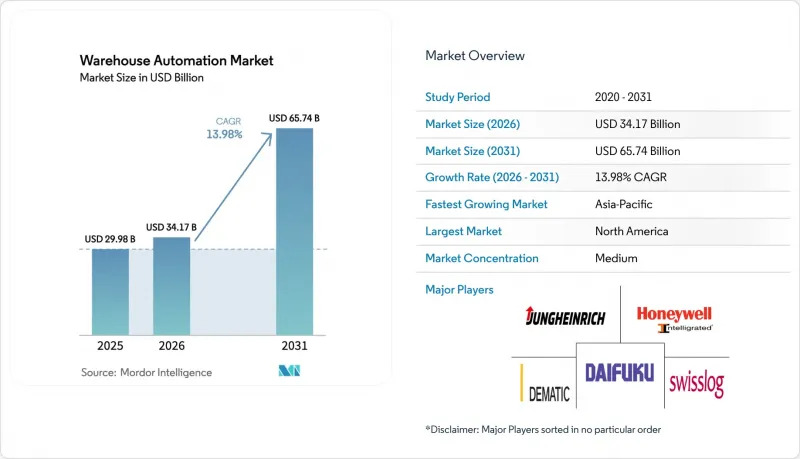
Mordor Intelligence에 의하면, 창고 자동화 시장 규모는 2025년 299억 8,000만 달러로 평가되었고, 2026년에는 341억 7,000만 달러로 추정되고, 2031년까지 657억 4,000만 달러에 이를 것으로 예상되며, 2026-2031년 CAGR 13.98%로 성장할 전망입니다.
본 보고서는 구성 요소별(하드웨어, 소프트웨어, 서비스), 기술별(이동 로봇, AS/RS 등), 최종 사용자 산업별(식품 및 음료, 우편·소포 등), 창고 규모별(소규모, 중규모 등), 용도별(입고 처리 등), 소유 형태별(전자상거래 전문 기업 등) 및 지역별로 분류되어 있습니다. 시장 전망은 금액(달러) 기준으로 제시되어 있습니다.
세계의 창고 자동화 시장 동향 및 인사이트
전자상거래의 급성장과 라스트 마일에 대한 기대
2025년 3분기 미국의 분기 전자상거래 매출액은 3,103억 달러에 달했으나, 전략적 핵심은 주문에서 배송까지의 시간을 2시간 이내로 단축하는 데 있습니다. 소매업체들은 현재 수요가 집중되는 지역으로부터 10마일 반경 내에 재고를 배치하고 있으며, 기존의 컨베이어 그리드를 설치할 수 없는 마이크로 풀필먼트 거점으로 네트워크를 세분화하고 있습니다. 수직 셔틀 어레이와 토트 회수 로봇이 바닥 면적을 효율적으로 활용하여, 20,000제곱피트 미만의 부지에서 시간당 500-1,000건의 주문을 처리하고 있습니다. 따라서 라스트 마일의 경제성 측면에서는 노동력의 유연성보다 자본 집약성이 더 중요시되면서, 그동안 저자동화 모델이 주류를 이루던 상황이 역전되고 있습니다. 식료품점 및 퀵 커머스 사업자들은 소매점의 지하실이나 주차장을 자동화 허브로 재활용함으로써, 신규 산업용 건물의 용도지역 규제를 회피하며 도입을 주도하고 있습니다.
인력 부족과 임금 인플레이션 가속화
북미 물류 업계의 임금은 2025년 9월까지 12개월 동안 3.8% 상승했으며, 전체 민간 근로자의 평균인 3.6%를 상회했습니다. 한편, 자발적 이직률은 2% 미만을 기록했습니다. 대당 월 2,000-4,000달러의 자율 주행 로봇 군은 최단 12개월 만에 투자 회수가 가능하며, 로봇 1대당 실질적으로 2.5-3명의 정규직에 상응하는 인력을 대체하고 있습니다. 스칸디나비아, 스위스,일본의 도시 지역에서는 현재 크로스도킹 및 키팅의 자동화가 진행되고 있습니다. 이는 인력 부족으로 인한 기회 비용이 자본 위험을 상회하기 때문입니다. 임금에 기인한 자동화는 과거 미국 중규모 도시들이 누리던 인건비 우위성마저 상쇄하며, 지역 간 물류 처리의 경제성을 균일화시키고 있습니다.
고정식 시스템의 고액 초기 설비 투자와 긴 회수 기간
크레인식 자동 창고의 단일 통로 비용은 200만 달러를 초과하기도 하며, 처리량이 설계 목표를 15%-20% 밑돌 경우 투자 회수 기간은 5년 이상으로 늘어날 가능성이 있습니다. 이러한 자본 집약성으로 인해 시장은 그린필드 메가 허브에 자금을 투자할 수 있는 기존 기업과 이동형 로봇에 국한된 신생 기업으로 양극화되고 있습니다. 의류 및 가전제품 분야에서는 SKU 변동이 심하기 때문에 크레인의 높이를 재설정하려면 수 주간에 걸친 가동 중단이 필요할 수 있으며, 고정식 시스템은 유연성이 부족하여 위험이 높아집니다. 그 결과, 중규모 사업자들은 장기적인 효율성이 전용 설계 컨베이어 그리드보다 낮더라도 선택의 여지를 남겨둘 수 있는 모듈형 솔루션을 선호하는 경향이 있습니다.
부문 분석
2025년에는 하드웨어가 지출의 55.12%를 차지했지만, 소프트웨어 매출은 2026-2031년 연평균 성장률(CAGR) 14.87%를 나타낼 것으로 예측됩니다. 각 운영사는 기존 컨베이어에 비해 처리량을 15%에서 25% 향상시키는 클라우드 네이티브 실행 레이어를 도입하고 있으며, 도크를 며칠 동안 가동 중단시킬 가능성이 있는 물리적 개조보다 매주 제공되는 코드 업데이트를 선호하고 있습니다. 구독형 가격 책정 방식에서는 유지보수 및 분석 기능이 라이선스에 포함되어 있어, 예기치 않은 가동 중단 시간을 30% 줄이고 서비스 차량의 출동 횟수를 줄일 수 있습니다. 벤처 캐피탈은 이러한 수익성 추이에 주목하고 있으며, 소프트웨어 기업들에게 틈새 워크플로우 용도를 인수하여 통합 오케스트레이션 제품군에 임베디드할 것을 촉구하고 있습니다.
50만 제곱피트가 넘는 신축 메가 허브에서는 하드웨어가 여전히 필수적입니다. 이러한 시설에서는 맞춤형 컨베이어와 고층 창고용 크레인이 20년의 임대 기간에 걸쳐 효율적으로 상각됩니다. 서비스 수익은 설치 작업자가 야간 근무를 수행하며 주문 마감으로 인한 혼란을 피해야 하는 기존 시설의 개조 프로젝트에 집중되어 있습니다. 이동형 로봇 공급업체들은 현재 도착 시 자동 보정을 수행하는 차량용 소프트웨어를 사전 설치하고 있으며, 이를 통해 통합업체의 작업 시간을 단축하고 수익원을 기계 조정 작업에서 데이터 서비스로 전환하고 있습니다. 그 결과, 지출은 점차 소프트웨어 쪽으로 이동하고 있는 반면, 높은 처리량을 자랑하는 시설에서는 하드웨어가 여전히 핵심을 담당하고 있어 창고 자동화 시장 전체의 균형이 유지되고 있습니다.
피스 피킹용 로봇은 새로운 그리퍼와 비전 기술로 인해 오피킹률이 0.5% 미만으로 감소함에 따라 연평균 성장률(CAGR) 15.27%를 나타낼 것으로 예측됩니다. 이로 인해 기존 로봇을 베스트셀러 상위 20% 상품으로만 제한할 필요가 없어져, 의류,화장품, 그리고 혼합 식료품 주문의 자동화가 가능해집니다. 2025년 지출의 41.36%를 차지했던 자율 이동 로봇은 현재 피킹 암과 통합되어, 엔드투엔드 ‘상품에서 로봇으로’의 루프를 구축함으로써 이동 거리를 70% 단축하고 있습니다.
자동 창고 시스템은 ±2°C의 정밀도가 필수적인 콜드체인 시설에서 여전히 확고한 입지를 유지하고 있는 반면, 컨베이어와 분류 설비는 시간당 1만 개를 처리하는 소포 허브에서 주류를 이루고 있습니다. 자동 식별 및 데이터 수집(AIDC) 기술을 통해 모든 기술 계층에 실시간으로 정확한 재고 정보가 제공되며, 이 데이터는 각 작업에 최적의 로봇을 선택하는 오케스트레이션 엔진에 공급됩니다. 이러한 발전이 결합되어, 멀티 테크놀로지 시스템 매출에서 첨단 로봇 공학이 차지하는 창고 자동화 시장 점유율이 확대되고 있습니다.
지역별 분석
2025년, 북미는 매출의 35.51%를 차지했으며, 그 원동력은 미국과 멕시코의 니어쇼어링 붐이었습니다. 이 지역에서는 2020-2024년 5억제곱피트의 창고가 새로 건설되었으나, 대규모 시설에 대한 도입이 정점에 달하면서 성장이 둔화되고 있습니다. 멕시코는 2024-2025년 니어쇼어링 투자로 200억 달러를 유치하고, 몬테레이와 바히오 지역에 자동화 허브를 구축하여 제조와 미국 수요를 연계하고 있습니다. 캐나다는 의약품 및 식료품 주문 처리(fulfillment)를 지원하기 위해 토론토와 밴쿠버 주변의 콜드체인 자동화에 주력하고 있습니다.
아시아태평양은 연평균 성장률(CAGR) 15.91%로 확대되며, 세계에서 가장 빠른 성장률을 기록할 전망입니다. 중국은 스마트 물류 지침에 따라 2030년까지 1선 도시의 물류 단지에서 자동화 보급률 70%를 달성하는 것을 목표로 하고 있습니다. 일본은 내진 기준 준수로 인해 비용이 15%-20% 증가함에도 불구하고, 로봇 기술에 대한 보조금을 통해 노동력 부족 문제를 해결하고 있습니다. 인도의 GST(상품 및 서비스세) 개혁은 메가 허브 형성을 촉진하고 있는 반면, 호주는 수출용 콜드체인을 자동화하고 있습니다.
유럽은 여전히 성숙한 거점이지만, ‘건물의 에너지 성능에 관한 지침’에 따라 설비 확충 전에 개보수가 의무화되어 있어, 규제로 인한 설비 투자 전용이라는 과제에 직면해 있습니다. 중동 및 아프리카의 도입은 UAE와 사우디아라비아의 자유무역지대를 중심으로 진행되고 있으나, 남미에서는 환율 변동으로 어려움을 겪고 있어 이로 인해 수입 장비 비용이 최대 50%까지 치솟고 있습니다.
기타 혜택 :
- 엑셀 형식 시장 예측(ME) 시트
- 3개월간의 애널리스트 지원
자주 묻는 질문
목차
제1장 서론
제2장 조사 방법
제3장 주요 요약
제4장 시장 구도
제5장 시장 규모 및 성장 예측
제6장 경쟁 구도
제7장 시장 기회 및 향후 전망
AJY 26.09.15According to Mordor Intelligence, the warehouse automation market size is expected to increase from USD 29.98 billion in 2025 to USD 34.17 billion in 2026 and reach USD 65.74 billion by 2031, growing at a CAGR of 13.98% over 2026-2031.
This report is Segmented by Component (Hardware, Software, and Services), Technology (Mobile Robots, AS/RS, and More), End-User Industry (Food and Beverage, Post and Parcel, and More), Warehouse Size (Small, Medium, and More), Application Function (Inbound Handling, and More), Ownership Model (E-Commerce Pure-Plays, and More), and Geography. The Market Forecasts are Provided in Terms of Value (USD).
Global Warehouse Automation Market Trends and Insights
E-commerce Boom And Last-Mile Expectations
Quarterly U.S. e-commerce sales reached USD 310.3 billion in Q3 2025, but the strategic hinge lies in compressing order-to-door intervals to two hours or less. Retailers now locate inventory within 10 miles of demand clusters, fragmenting networks into micro-fulfillment nodes that cannot house traditional conveyor grids. Vertical shuttle arrays and tote-retrieval robots reclaim floor area, processing 500-1,000 orders per hour from footprints under 20,000 square feet. Last-mile economics therefore reward capital intensity over labor flexibility, reversing the historic low-automation model. Grocery and quick-commerce operators lead adoption by repurposing retail basements and parking decks into automated hubs that bypass zoning constraints on new industrial builds.
Labour Shortages And Rising Wage Inflation
Logistics wages in North America advanced 3.8% over the twelve months ending September 2025, eclipsing the 3.6% average for all civilian workers, while voluntary turnover slid below 2%. Autonomous mobile robot fleets priced at USD 2,000-4,000 per unit per month reach payback in as little as 12 months, effectively replacing 2.5-3 full-time equivalents per robot. Operators in Scandinavia, Switzerland, and urban Japan now automate cross-docking and kitting because the opportunity cost of unfilled jobs outweighs capital risk. Wage-driven automation also neutralizes the labor cost edge once enjoyed by mid-tier U.S. cities, homogenizing fulfillment economics regionally.
High Upfront Capex And Long Pay-Back For Fixed Systems
A single aisle of crane-based automated storage can exceed USD 2 million, with payback stretching beyond five years if throughput misses design targets by 15%-20%. Such capital intensity bifurcates the market into incumbents able to finance greenfield mega-hubs and challengers confined to mobile robots. The risk rises in apparel and consumer electronics, where SKU volatility renders fixed systems inflexible because re-configuring crane heights may require multi-week shutdowns. Consequently, mid-tier operators favor modular solutions that preserve optionality, even when long-run efficiency is lower than purpose-built conveyor grids.
Other drivers and restraints analyzed in the detailed report include:
- Rapid ROI From Plug-And-Play AMR And AGV Fleets
- Robotics-As-A-Service Lowering Cap-Ex Hurdles
- Legacy IT And WMS Integration Complexity
For complete list of drivers and restraints, kindly check the Table Of Contents.
Segment Analysis
Software revenue is projected to post a 14.87% CAGR between 2026 and 2031, even though hardware controlled 55.12% of spending in 2025. Operators deploy cloud-native execution layers that lift throughput by 15% to 25% from existing conveyors, favoring code updates that arrive weekly over physical retrofits that can idle docks for days. Subscription pricing folds maintenance and analytics into the license, cutting unscheduled downtime 30% and trimming service truck rolls. Venture capital follows the margin profile, pushing software firms to acquire niche workflow applications and bundle them into unified orchestration suites.
Hardware remains vital for greenfield mega-hubs exceeding 500,000 square feet, where custom conveyors and high-bay cranes amortize efficiently across 20-year leases. Services revenue concentrates in brownfield projects that need installers to work overnight shifts and avoid order-cutoff disruption. Mobile robot suppliers now preload fleet software that self-calibrates on arrival, limiting integrator hours and shifting profit pools from wrench work to data services. The net result is a gradual migration of spending toward software while hardware remains the anchor in high-throughput facilities, preserving balance within the overall warehouse automation market.
Piece-picking robots are forecast to grow at 15.27% CAGR because new grippers and vision reduce mis-pick rates below 0.5%. This removes the historical need to restrict robots to the top 20% of fast movers, unlocking automation for apparel, cosmetics, and mixed grocery orders. Autonomous mobile robots, which captured 41.36% of 2025 spend, now integrate with pick arms to create end-to-end goods-to-robot loops that shrink travel by 70%.
Automated storage and retrieval systems retain a stronghold in cold chain sites where +-2°C accuracy is mandatory, while conveyor and sortation equipment dominates parcel hubs running 10,000 units per hour. Automatic identification and data capture equips every technology layer with real-time inventory truth, feeding orchestration engines that choose the optimal robot for each task. Together these advances expand the warehouse automation market share held by advanced robotics within multi-technology system sales.
Complete Report Scope:
- By Component
- Hardware
- Software
- Services
- By Technology
- Mobile Robots (AGV, AMR)
- Automated Storage and Retrieval Systems (AS/RS)
- Conveyor and Sortation Systems
- Palletizing / Depalletizing Robotics
- Piece-Picking Robots
- Automatic Identification and Data Collection (AIDC)
- By End-User Industry
- Food and Beverage
- Post and Parcel
- Retail and E-commerce
- Apparel and Footwear
- Manufacturing (Durable and Non-Durable)
- Pharmaceuticals and Healthcare
- 3PL / Contract Logistics
- Other End-User Industries
- By Warehouse Size
- Small (Less than 50 k sq ft)
- Medium (50-200 k sq ft)
- Large (200-500 k sq ft)
- Mega (More than 500 k sq ft)
- By Application Function
- Inbound Handling
- Storage and Buffering
- Picking and Packing
- Sorting and Consolidation
- Outbound Loading
- Returns Processing
- By Ownership Model
- Company-Owned Warehouses
- 3PL / Contract Warehouses
- E-commerce Pure-Plays
- Government / Defence
- By Geography
- North America
- United States
- Canada
- Mexico
- South America
- Brazil
- Argentina
- Chile
- Rest of South America
- Europe
- Germany
- United Kingdom
- France
- Italy
- Spain
- Netherlands
- Russia
- Rest of Europe
- Asia Pacific
- China
- Japan
- South Korea
- India
- ASEAN
- Australia
- New Zealand
- Rest of Asia Pacific
- Middle East
- GCC
- Turkey
- Israel
- Rest of Middle East
- Africa
- South Africa
- Nigeria
- Kenya
- Rest of Africa
- North America
Geography Analysis
North America held 35.51% of revenue in 2025, anchored by the United States and Mexico's nearshoring boom. The region added 500 million square feet of warehouses from 2020-2024, but growth cools as large-site penetration peaks. Mexico attracted USD 20 billion in nearshoring investment during 2024-2025, spawning automated hubs in Monterrey and the Bajio region to synchronize manufacturing with U.S. demand. Canada focuses on cold-chain automation around Toronto and Vancouver to support pharmaceutical and grocery fulfillment.
Asia-Pacific will expand at a 15.91% CAGR, the fastest globally. China targets 70% automation penetration in tier-one city logistics parks by 2030 under its smart-logistics guidelines. Japan counters a shrinking labor pool by subsidizing robotics, despite 15%-20% higher costs for seismic compliance. India's GST reforms foster mega-hubs, while Australia automates export-oriented cold chains.
Europe remains a mature stronghold yet faces regulatory capex diversion as the Energy Performance of Buildings Directive mandates retrofits before capacity additions. Middle East and Africa adoption centers on UAE and Saudi Arabia free zones, whereas South America battles currency volatility that inflates imported equipment costs by up to 50%.
- Dematic Group (Kion Group AG)
- Daifuku Co. Ltd
- Swisslog Holding AG (KUKA AG)
- Jungheinrich AG
- Honeywell Intelligrated
- Murata Machinery
- KNAPP AG
- TGW Logistics Group GmbH
- Kardex Group
- Mecalux SA
- BEUMER Group
- SSI Schaefer AG
- Vanderlande BV
- WITRON Logistik + Informatik GmbH & Co. KG
- Boston Dynamics
- Zebra Technologies
- Exotec
- Geek+
- Symbotic
- AutoStore
- Locus Robotics
- GreyOrange
- Berkshire Grey
- Element Logic
- Ocado Group
- Fetch Robotics (Zebra)
- Magazino
Additional Benefits:
- The market estimate (ME) sheet in Excel format
- 3 months of analyst support
TABLE OF CONTENTS
1 INTRODUCTION
- 1.1 Study Assumptions and Market Definition
- 1.2 Scope of the Study
2 RESEARCH METHODOLOGY
3 EXECUTIVE SUMMARY
4 MARKET LANDSCAPE
- 4.1 Market Overview
- 4.2 Market Drivers
- 4.2.1 E-commerce Boom and Last-Mile Expectations
- 4.2.2 Labour Shortages and Rising Wage Inflation
- 4.2.3 Rapid ROI from Plug-and-Play AMR and AGV Fleets
- 4.2.4 Robotics-as-a-Service Lowering Cap-Ex Hurdles
- 4.2.5 ESG-Linked Energy-Efficiency Mandates
- 4.2.6 Reshoring-Driven Mega-Hubs Needing High-Density Automation
- 4.3 Market Restraints
- 4.3.1 High Upfront Capex and Long Pay-Back for Fixed Systems
- 4.3.2 Legacy IT and WMS Integration Complexity
- 4.3.3 Cyber-Security Vulnerabilities of Connected Devices
- 4.3.4 Stricter Li-ion Battery Fire-Safety Regulations for AMRs
- 4.4 Industry Value Chain Analysis
- 4.5 Regulatory Landscape
- 4.6 Technological Outlook
- 4.7 Impact of Macroeconomic Factors on the Market
- 4.8 Porter's Five Forces Analysis
- 4.8.1 Bargaining Power of Buyers
- 4.8.2 Bargaining Power of Suppliers
- 4.8.3 Threat of New Entrants
- 4.8.4 Threat of Substitutes
- 4.8.5 Intensity of Competitive Rivalry
- 4.9 Warehouse Investment Scenario
5 MARKET SIZE AND GROWTH FORECASTS (VALUE)
- 5.1 By Component
- 5.1.1 Hardware
- 5.1.2 Software
- 5.1.3 Services
- 5.2 By Technology
- 5.2.1 Mobile Robots (AGV, AMR)
- 5.2.2 Automated Storage and Retrieval Systems (AS/RS)
- 5.2.3 Conveyor and Sortation Systems
- 5.2.4 Palletizing / Depalletizing Robotics
- 5.2.5 Piece-Picking Robots
- 5.2.6 Automatic Identification and Data Collection (AIDC)
- 5.3 By End-User Industry
- 5.3.1 Food and Beverage
- 5.3.2 Post and Parcel
- 5.3.3 Retail and E-commerce
- 5.3.4 Apparel and Footwear
- 5.3.5 Manufacturing (Durable and Non-Durable)
- 5.3.6 Pharmaceuticals and Healthcare
- 5.3.7 3PL / Contract Logistics
- 5.3.8 Other End-User Industries
- 5.4 By Warehouse Size
- 5.4.1 Small (Less than 50 k sq ft)
- 5.4.2 Medium (50-200 k sq ft)
- 5.4.3 Large (200-500 k sq ft)
- 5.4.4 Mega (More than 500 k sq ft)
- 5.5 By Application Function
- 5.5.1 Inbound Handling
- 5.5.2 Storage and Buffering
- 5.5.3 Picking and Packing
- 5.5.4 Sorting and Consolidation
- 5.5.5 Outbound Loading
- 5.5.6 Returns Processing
- 5.6 By Ownership Model
- 5.6.1 Company-Owned Warehouses
- 5.6.2 3PL / Contract Warehouses
- 5.6.3 E-commerce Pure-Plays
- 5.6.4 Government / Defence
- 5.7 By Geography
- 5.7.1 North America
- 5.7.1.1 United States
- 5.7.1.2 Canada
- 5.7.1.3 Mexico
- 5.7.2 South America
- 5.7.2.1 Brazil
- 5.7.2.2 Argentina
- 5.7.2.3 Chile
- 5.7.2.4 Rest of South America
- 5.7.3 Europe
- 5.7.3.1 Germany
- 5.7.3.2 United Kingdom
- 5.7.3.3 France
- 5.7.3.4 Italy
- 5.7.3.5 Spain
- 5.7.3.6 Netherlands
- 5.7.3.7 Russia
- 5.7.3.8 Rest of Europe
- 5.7.4 Asia Pacific
- 5.7.4.1 China
- 5.7.4.2 Japan
- 5.7.4.3 South Korea
- 5.7.4.4 India
- 5.7.4.5 ASEAN
- 5.7.4.6 Australia
- 5.7.4.7 New Zealand
- 5.7.4.8 Rest of Asia Pacific
- 5.7.5 Middle East
- 5.7.5.1 GCC
- 5.7.5.2 Turkey
- 5.7.5.3 Israel
- 5.7.5.4 Rest of Middle East
- 5.7.6 Africa
- 5.7.6.1 South Africa
- 5.7.6.2 Nigeria
- 5.7.6.3 Kenya
- 5.7.6.4 Rest of Africa
- 5.7.1 North America
6 COMPETITIVE LANDSCAPE
- 6.1 Market Concentration
- 6.2 Strategic Moves
- 6.3 Market Share Analysis
- 6.4 Company Profiles (includes Global Level Overview, Market Level Overview, Core Segments, Financials as Available, Strategic Information, Market Rank/Share for Key Companies, Products and Services, Recent Developments)
- 6.4.1 Dematic Group (Kion Group AG)
- 6.4.2 Daifuku Co. Ltd
- 6.4.3 Swisslog Holding AG (KUKA AG)
- 6.4.4 Jungheinrich AG
- 6.4.5 Honeywell Intelligrated
- 6.4.6 Murata Machinery
- 6.4.7 KNAPP AG
- 6.4.8 TGW Logistics Group GmbH
- 6.4.9 Kardex Group
- 6.4.10 Mecalux SA
- 6.4.11 BEUMER Group
- 6.4.12 SSI Schaefer AG
- 6.4.13 Vanderlande BV
- 6.4.14 WITRON Logistik + Informatik GmbH & Co. KG
- 6.4.15 Boston Dynamics
- 6.4.16 Zebra Technologies
- 6.4.17 Exotec
- 6.4.18 Geek+
- 6.4.19 Symbotic
- 6.4.20 AutoStore
- 6.4.21 Locus Robotics
- 6.4.22 GreyOrange
- 6.4.23 Berkshire Grey
- 6.4.24 Element Logic
- 6.4.25 Ocado Group
- 6.4.26 Fetch Robotics (Zebra)
- 6.4.27 Magazino
7 MARKET OPPORTUNITIES AND FUTURE OUTLOOK
- 7.1 White-Space and Unmet-Need Assessment


