|
시장보고서
상품코드
2124938
시스템 통합 : 시장 점유율 분석, 업계 동향 및 통계, 성장 예측(2026-2031년)System Integration - Market Share Analysis, Industry Trends & Statistics, Growth Forecasts (2026 - 2031) |
||||||
 Mordor Intelligence
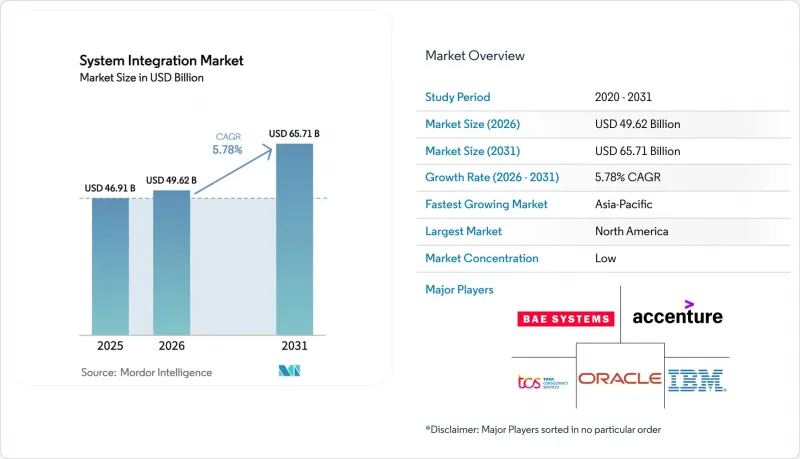
Mordor Intelligence에 의하면, 시스템 통합 시장 규모는 2025년에 469억 1,000만 달러로 평가되었습니다. 2026년 496억 2,000만 달러에서 2031년까지 657억 1,000만 달러에 이를 것으로 예상되며, 예측 기간(2026-2031년) CAGR은 5.78%를 나타낼 전망입니다.
본 보고서는 서비스 유형(인프라 통합, 컨설팅 및 자문, 기타), 배포 방식(On-Premise, 클라우드), 최종 사용자 산업(제조업, 자동차, 기타), 통합 유형(디바이스/IoT 통합, 기타), 조직 규모(대기업, 중소기업), 지역별로 분류되어 있습니다. 시장 예측은 금액(달러) 기준으로 제시되어 있습니다.
세계의 시스템 통합 시장 동향 및 인사이트
하이브리드 멀티클라우드 통합 아키텍처로의 전환
현재 기업들은 On-Premise 환경을 유지하면서 3개 이상의 하이퍼스케일러에 워크로드를 분산시키고 있습니다. 이러한 경향은 2025년 조사에서 대기업의 멀티클라우드 이용률이 72%에 달한 것으로 확인된 사실에서도 뒷받침됩니다. 따라서 서로 다른 API, ID 모델, 데이터 주권 제약을 연결하는 통합 플랫폼은 전략적 제어 계층이 되고 있습니다. 금융 기관은 고객 데이터를 주권형 클라우드로 분할하는 한편, 분석 업무를 세계 공급자에게 위탁하고 있으며, 이로 인해 통합 접점이 급격히 증가하고 있습니다. 유럽중앙은행(ECB)의 2024년 아웃소싱 지침에서는 엑시트 전략과 상호운용성이 요구되고 있으며, 이에 따라 오케스트레이션에 대한 투자가 더욱 가속화되고 있습니다. 아키텍트들은 인프라를 추상화하는 이벤트 주도형 설계와 서비스 메시로 전환하고 있으며, 이를 통해 하이브리드 환경 전체에서 거의 실시간에 가까운 데이터 패브릭을 구현하고 있습니다.
5G 및 엣지 컴퓨팅 도입에 따른 저지연 오케스트레이션 요구
스탠드얼론형 5G 네트워크는 컴퓨팅을 엣지로 밀어내고 있습니다. 엣지에서는 밀리초 단위의 지연 시간 제한으로 인해 중앙 데이터센터와의 왕복 통신이 허용되지 않습니다. 2025년 중반에는 전 세계 5G 가입자 수가 19억 명에 달했으며, 네트워크 슬라이싱을 통해 산업 전용 통신 레인이 구축되었습니다. 제조 공장에서는 센서 데이터를 전처리한 후 클라우드상의 ERP(기업 자원 계획) 시스템과 동기화하는 엣지 게이트웨이가 도입되고 있습니다. 통신 사업자들은 5G 코어 API를 공개하기 위해 운영 지원 시스템 플랫폼 개편을 추진하고 있으며, 이에 따라 캐리어급 미들웨어에 대한 수요가 증가하고 있습니다. 2024년에 최종 확정된 ITU의 IMT-2020 규격에서는 통합 벤더가 충족해야 할 초고신뢰성·저지연 통신 벤치마크가 규정되어 있습니다. 따라서 5G 투자를 단순한 선택적 업그레이드로 취급하지 않고 수익화를 도모하기 위해서는 엣지에서 클라우드로의 오케스트레이션이 필수적입니다.
통합 아키텍트 인력 부족의 심화
LinkedIn의 기록에 따르면, 2025년 통합 아키텍트 채용 공고 수는 전년 대비 34% 증가했지만, 채용까지 소요되는 기간의 중앙값은 여전히 60일을 초과했습니다. 계약금이나 주식 부여는 프로젝트 예산을 부풀리는 한편, 산업별 전문 지식이 요구되기 때문에 후보자 풀은 더욱 좁아지고 있습니다. 오프쇼어 인력의 활용은 많은 IT 분야에서 비용을 절감해 주지만, On-Premise 팀과의 시간대 조정이 필요한 하이브리드 통합 업무에서는 그 효과가 제한적입니다. 기업들은 제한된 인력을 최대한 활용하기 위해 로우코드 도구를 시험적으로 도입하고 있지만, 이러한 플랫폼은 고도로 맞춤화된 레거시 시스템 환경에서는 충분한 성과를 내지 못합니다. 이러한 인력 부족은 2028년까지 지속될 것으로 예상되며, 시장 확대 속도에는 상한선이 설정될 것입니다.
부문별 분석
2025년, 시스템 통합 시장 점유율의 45.61%를 인프라 통합이 차지했으며, 하이브리드 환경 전반에 걸친 서버, 스토리지, 네트워크 오케스트레이션의 필요성이 부각되었습니다. 금융 기관 및 정부 기관은 여전히 엄격하게 관리되는 On-Premise형 허브에 의존하고 있기 때문에 배선, 가상화, 내결함성 설계에서 발생하는 수익은 견조한 추세를 보이고 있습니다. 현재 공급업체들은 모니터링, 패치 적용, 용량 계획을 성과 기반 계약에 포함시키고 있으며, 이로 인해 계약 기간이 연장되고 수익 흐름이 안정화되고 있습니다.
한편, 용도 및 소프트웨어 통합 시장은 2031년까지 연평균 성장률(CAGR) 6.33%로 확대되고 있습니다. 이는 기업들이 모바일 앱이나 분석 기능을 백엔드 코어에서 분리하는 ‘API 우선’ 모델을 선호하기 때문입니다. 이러한 전환으로 인해 인프라 계층과 용도 계층의 경계가 모호해지고 있습니다. 이는 동일한 오케스트레이션 엔진이 쿠버네티스 클러스터와 게이트웨이 엔드포인트를 모두 관리하기 때문입니다. 2023년 IBM이 Apptio를 46억 달러에 인수한 것은 통합 예산을 합리화하는 비용 거버넌스 도구에 대한 수요를 여실히 보여주었습니다. 인프라 프로비저닝과 용도 연결성을 단일 관리형 서비스로 패키징할 수 있는 벤더들은 시스템 통합 시장에서 점유율을 확대되고 있습니다.
2025년 매출 중 On-Premise 도입이 59.16%를 차지했습니다. 이는 데이터 주권에 관한 규제와 규제 대상 워크로드를 지원하는 미들웨어의 방대한 도입 기반을 반영한 것입니다. 엣지 노드의 현대화를 추진하는 한편, 은행과 공공 기관은 미션 크리티컬한 통합 허브에 대한 물리적 통제를 우선시함으로써 자본 투자 주기를 연장하고 있습니다. 이러한 접근 방식은 중요 인프라에 대한 직접적인 감독과 보안을 유지하고 신뢰성을 확보하는 동시에, 외부 의존에 따른 잠재적 위험을 최소화하려는 의도를 반영하고 있습니다.
클라우드 기반 통합 플랫폼은 구독형 가격 정책, 자동 확장, 지속적인 업데이트가 중견 기업에게 매력적이기 때문에 2031년까지 연평균 성장률(CAGR) 6.16%로 성장하고 있습니다. MuleSoft의 보고서에 따르면, 2025년 신규 도입의 64%가 클라우드 네이티브이며, 이는 2년 전의 48%에서 증가한 수치입니다. 2025년 9월에 시행된 유럽연합(EU)의 데이터 법은 기업에 데이터 마이그레이션권을 부여하고, 전환 비용을 절감하며, 실험적인 노력을 촉진할 것입니다. 데이터는 On-Premise에 보관하면서 오케스트레이션 로직을 클라우드에서 실행하는 하이브리드 컨트롤 플레인 패턴은 현재 많은 개념 증명(PoC)의 기반이 되고 있으며, 시스템 통합 시장 전체를 확대시키고 있습니다.
지역별 분석
2025년, 북미는 시스템 통합 시장에서 38.91%라는 압도적인 점유율을 차지했습니다. 이는 연방 정부의 제로 트러스트 의무화 및 은행 업무 현대화 추진이 원동력이 되고 있습니다. 미국 행정관리예산국(OMB)은 하이브리드 환경 전반에 걸친 상세한 정책 시행에 기반하여 신원 중심의 제어를 중시하고 있습니다. 한편, 캐나다 기업들은 국경을 넘는 파트너 기업의 개인정보 보호 프레임워크와 자사의 프레임워크를 조화시키고 있습니다.
아시아태평양은 2031년까지 연평균 성장률(CAGR) 6.83%를 나타낼 것으로 예측되며, 지역별로는 가장 높은 성장률을 보이고 있습니다. 중국의 ‘신 인프라’ 프로그램은 5G, 산업용 인터넷, 데이터센터 건설에 자금을 지원하고 있으며, 이 모든 분야에 견고한 오케스트레이션이 요구되고 있습니다. 인도의 통합 결제 인터페이스(UPI)는 2025년 12월에 114억 건의 거래를 처리하며, 실시간 통합 워크로드의 규모를 여실히 보여주었습니다. 일본과 한국은 스마트 팩토리 및 자율주행차 생태계를 가속화하고 있으며, 각각 엣지에서 클라우드로 이어지는 복잡성이 증가하고 있습니다.
유럽에서는 ‘디지털 운영 복원력 법(Digital Operational Resilience Act)’과 ‘NIS2’가 원동력이 되어 꾸준한 성장이 예상됩니다. 이에 따라 문서화, 사고 보고, 제3자 위험 테스트가 의무화되었습니다. 독일은 자동차 및 기계 부문에서 IT와 OT의 융합을 주도하고 있으며, 프랑스는 오픈 뱅킹 API를 확대하고 있고, 영국은 브렉시트 이후의 규제 차이에 대응하는 한편, 국경을 넘는 오케스트레이션 비용 상승에 직면해 있습니다. 남미, 중동 및 아프리카는 여전히 시장 점유율이 작지만, 브라질, 아랍에미리트, 사우디아라비아의 스마트 시티 및 에너지 그리드 프로젝트가 전 세계 시스템 통합 시장을 꾸준히 확대되고 있습니다.
기타 혜택
- 엑셀 형식 시장 예측(ME) 시트
- 3개월간의 애널리스트 지원
자주 묻는 질문
목차
제1장 서론
제2장 조사 방법
제3장 주요 요약
제4장 시장 구도
제5장 시장 규모 및 성장 예측
제6장 경쟁 구도
제7장 시장 기회 및 향후 전망
KTH 26.09.14According to Mordor Intelligence, the system integration market size was valued at USD 46.91 billion in 2025 and estimated to grow from USD 49.62 billion in 2026 to reach USD 65.71 billion by 2031, at a CAGR of 5.78% during the forecast period (2026-2031).
This report is Segmented by Service Type (Infrastructure Integration, Consulting and Advisory, and More), Deployment Mode (On-Premise, and Cloud), End-User Industry (Manufacturing, Automotive, and More), Integration Type (Device/IoT Integration, and More), Organization Size (Large Enterprises, and Small and Medium Enterprises), and Geography. The Market Forecasts are Provided in Terms of Value (USD).
Global System Integration Market Trends and Insights
Shift to Hybrid-Multi-Cloud Integration Architectures
Enterprises now distribute workloads across three or more hyperscalers alongside retained on-premise estates, a pattern confirmed by a 2025 survey that found multi-cloud usage rising to 72% of large firms. Integration platforms that translate divergent APIs, identity models, and data-sovereignty constraints have therefore become strategic control planes. Financial institutions split customer data onto sovereign clouds while offloading analytics to global providers, multiplying integration touchpoints. The European Central Bank's 2024 outsourcing guidelines require exit strategies and interoperability, further accelerating orchestration spending. Architects are pivoting toward event-driven designs and service meshes that abstract infrastructure, enabling near-real-time data fabrics across hybrid landscapes.
5G and Edge-Computing Roll-Outs Demanding Low-Latency Orchestration
Standalone 5G networks push compute to the edge, where millisecond latency budgets prohibit round-trips to central data centers. Global 5G subscriptions hit 1.9 billion in mid-2025, with network slicing creating dedicated industrial lanes. Manufacturing plants deploy edge gateways that preprocess sensor data before syncing it with enterprise resource planning systems in the cloud. Telecom operators are re-platforming operations-support systems to expose 5G core APIs, driving demand for carrier-grade middleware. ITU's IMT-2020 standards, finalized in 2024, codify ultra-reliable low-latency communication benchmarks that integration vendors must now meet. Edge-to-cloud orchestration is therefore essential for monetizing 5G investments rather than treating it as a discretionary upgrade.
Escalating Talent Shortage of Integration Architects
LinkedIn recorded a 34% year-over-year increase in open integration-architect roles in 2025, yet the median time-to-fill still exceeded 60 days. Signing bonuses and equity grants inflate project budgets, while sector-specific knowledge demands narrow the candidate pool further. Offshore staffing mitigates costs in many IT domains but provides limited relief for hybrid-integration work that requires time-zone alignment with on-premises teams. Enterprises are experimenting with low-code tools to stretch scarce talent, though such platforms falter in deeply customized legacy estates. The shortage is expected to persist through 2028, capping the attainable speed of market expansion.
Other drivers and restraints analyzed in the detailed report include:
- Rapid IT-OT Convergence in Smart Manufacturing
- Cyber-Security Compliance Mandates
- Cost Overruns from Technical Debt in Legacy Estates
For complete list of drivers and restraints, kindly check the Table Of Contents.
Segment Analysis
Infrastructure integration accounted for 45.61% of the system integration market share in 2025, underscoring the need to orchestrate servers, storage, and networks across hybrid estates. Financial institutions and government agencies still depend on tightly controlled on-premise hubs, so revenue from cabling, virtualization, and resiliency engineering remains steady. Providers now bundle monitoring, patching, and capacity planning into outcome-based contracts, lengthening engagement tenures and smoothing revenue flow.
Application and software integration, meanwhile, is expanding at a 6.33% CAGR through 2031 as enterprises favor API-first models that decouple mobile apps and analytics from back-end cores. The pivot blurs the lines between the infrastructure and application layers because the same orchestration engines manage both Kubernetes clusters and gateway endpoints. IBM's USD 4.6 billion acquisition of Apptio in 2023 highlighted demand for cost-governance tools that rationalize integration budgets. Vendors that can package infrastructure provisioning with application connectivity into a single managed service are capturing a growing share of the system integration market.
On-premises installations accounted for 59.16% of 2025 revenue, reflecting data-sovereignty rules and the substantial installed base of middleware supporting regulated workloads. Even as they modernize edge nodes, banks and public agencies are extending capital investment cycles by favoring physical control over mission-critical integration hubs. This approach reflects their preference for maintaining direct oversight and security of critical infrastructure, ensuring reliability and minimizing potential risks associated with external dependencies.
Cloud-based integration platforms are growing at a 6.16% CAGR to 2031 as subscription pricing, auto-scaling, and continuous updates prove attractive to mid-market firms. MuleSoft reported that 64% of its new deployments were cloud-native in 2025, up from 48% two years earlier. The European Union Data Act, effective September 2025, grants enterprises data-portability rights, lowering switching costs and encouraging experimentation. Hybrid control-plane patterns, where data stays on-premises but orchestration logic runs in the cloud, now anchor many proofs of concept and expand the overall system integration market.
Complete Report Scope:
- By Service Type
- Infrastructure Integration
- Application and Software Integration
- Consulting and Advisory
- By Deployment Mode
- On-Premise
- Cloud
- By End-User Industry
- IT and Telecom
- BFSI
- Healthcare and Life Sciences
- Manufacturing
- Government and Utilities
- Energy and Oil and Gas
- Retail and E-Commerce
- Aerospace and Defense
- Automotive
- Other End-User Industries
- By Integration Type
- Data Integration
- Process / Workflow Integration
- Application / API Integration
- Device / IoT Integration
- By Organization Size
- Large Enterprises
- Small and Medium Enterprises
- By Geography
- North America
- United States
- Canada
- Mexico
- South America
- Brazil
- Argentina
- Rest of South America
- Europe
- United Kingdom
- Germany
- France
- Italy
- Rest of Europe
- Asia Pacific
- China
- Japan
- India
- South Korea
- Rest of Asia Pacific
- Middle East and Africa
- Middle East
- United Arab Emirates
- Saudi Arabia
- Rest of Middle East
- Africa
- South Africa
- Egypt
- Rest of Africa
- Middle East
- North America
Geography Analysis
In 2025, North America commanded a dominant 38.91% share of the system integration market, driven by federal zero-trust mandates and a push for banking modernization. The U.S. Office of Management and Budget emphasizes identity-centric controls, relying on detailed policy enforcement across hybrid environments. Meanwhile, Canadian companies are aligning their privacy frameworks with those of their cross-border counterparts.
Asia-Pacific is projected to grow at a 6.83% CAGR through 2031, the fastest among regions. China's New Infrastructure program funds 5G, the industrial internet, and data-center builds, all of which require robust orchestration. India's Unified Payments Interface processed 11.4 billion transactions in December 2025, showcasing the scale of real-time integration workloads. Japan and South Korea accelerate smart-factory and autonomous-vehicle ecosystems, each adding edge-to-cloud complexity.
Europe contributes steady growth driven by the Digital Operational Resilience Act and NIS2, which together enforce documentation, incident reporting, and third-party risk testing. Germany spearheads IT-OT convergence in automotive and machinery, France expands open-banking APIs, and the United Kingdom navigates post-Brexit divergence that elevates cross-border orchestration costs. South America, the Middle East, and Africa remain smaller slices, yet smart-city and energy-grid projects in Brazil, the United Arab Emirates, and Saudi Arabia steadily expand the global system integration market.
- Accenture plc
- IBM Corporation
- Tata Consultancy Services Limited
- Oracle Corporation
- BAE Systems plc
- Wipro Limited
- Cognizant Technology Solutions Corporation
- Deloitte Touche Tohmatsu Limited
- Infosys Limited
- MDS Systems Integration
- Capgemini SE
- Tech Mahindra Limited
- Siemens AG
- Fujitsu Limited
- CGI Inc.
- DXC Technology Company
- Cisco Systems, Inc.
- HCL Technologies Limited
- Hitachi Vantara LLC
- Atos SE
- SAP SE
- NEC Corporation
- NTT DATA Corporation
- EPAM Systems, Inc.
- MuleSoft LLC
- Red Hat, Inc.
Additional Benefits:
- The market estimate (ME) sheet in Excel format
- 3 months of analyst support
TABLE OF CONTENTS
1 INTRODUCTION
- 1.1 Study Assumptions and Market Definition
- 1.2 Scope of the Study
2 RESEARCH METHODOLOGY
3 EXECUTIVE SUMMARY
4 MARKET LANDSCAPE
- 4.1 Market Overview
- 4.2 Market Drivers
- 4.2.1 Shift to Hybrid-Multi-Cloud Integration Architectures
- 4.2.2 5G and Edge-Computing Roll-Outs Demanding Low-Latency Orchestration
- 4.2.3 Rapid IT-OT Convergence in Smart Manufacturing
- 4.2.4 Cyber-Security Compliance Mandates (e.g., NIS2, CISA SBOM)
- 4.2.5 Under-Sea Cable Upgrades Forcing Carrier-Grade Software Re-Platforming
- 4.2.6 AI-Driven "Integration-Platform-as-Code" Reducing Time-to-Value
- 4.3 Market Restraints
- 4.3.1 Escalating Talent Shortage of Integration Architects
- 4.3.2 Cost Overruns from Technical Debt in Legacy Estates
- 4.3.3 Vendor-Lock-In Risk with Hyperscaler Integration Services
- 4.3.4 Rising Scope-3 ESG Reporting Burden Delaying Capex
- 4.4 Industry Value Chain Analysis
- 4.5 Regulatory Landscape
- 4.6 Technological Outlook
- 4.7 Impact of Macroeconomic Factors on the Market
- 4.8 Porter's Five Forces Analysis
- 4.8.1 Bargaining Power of Suppliers
- 4.8.2 Bargaining Power of Buyers/Consumers
- 4.8.3 Threat of New Entrants
- 4.8.4 Threat of Substitutes
- 4.8.5 Intensity of Competitive Rivalry
5 MARKET SIZE AND GROWTH FORECASTS (VALUE)
- 5.1 By Service Type
- 5.1.1 Infrastructure Integration
- 5.1.2 Application and Software Integration
- 5.1.3 Consulting and Advisory
- 5.2 By Deployment Mode
- 5.2.1 On-Premise
- 5.2.2 Cloud
- 5.3 By End-User Industry
- 5.3.1 IT and Telecom
- 5.3.2 BFSI
- 5.3.3 Healthcare and Life Sciences
- 5.3.4 Manufacturing
- 5.3.5 Government and Utilities
- 5.3.6 Energy and Oil and Gas
- 5.3.7 Retail and E-Commerce
- 5.3.8 Aerospace and Defense
- 5.3.9 Automotive
- 5.3.10 Other End-User Industries
- 5.4 By Integration Type
- 5.4.1 Data Integration
- 5.4.2 Process / Workflow Integration
- 5.4.3 Application / API Integration
- 5.4.4 Device / IoT Integration
- 5.5 By Organization Size
- 5.5.1 Large Enterprises
- 5.5.2 Small and Medium Enterprises
- 5.6 By Geography
- 5.6.1 North America
- 5.6.1.1 United States
- 5.6.1.2 Canada
- 5.6.1.3 Mexico
- 5.6.2 South America
- 5.6.2.1 Brazil
- 5.6.2.2 Argentina
- 5.6.2.3 Rest of South America
- 5.6.3 Europe
- 5.6.3.1 United Kingdom
- 5.6.3.2 Germany
- 5.6.3.3 France
- 5.6.3.4 Italy
- 5.6.3.5 Rest of Europe
- 5.6.4 Asia Pacific
- 5.6.4.1 China
- 5.6.4.2 Japan
- 5.6.4.3 India
- 5.6.4.4 South Korea
- 5.6.4.5 Rest of Asia Pacific
- 5.6.5 Middle East and Africa
- 5.6.5.1 Middle East
- 5.6.5.1.1 United Arab Emirates
- 5.6.5.1.2 Saudi Arabia
- 5.6.5.1.3 Rest of Middle East
- 5.6.5.2 Africa
- 5.6.5.2.1 South Africa
- 5.6.5.2.2 Egypt
- 5.6.5.2.3 Rest of Africa
- 5.6.5.1 Middle East
- 5.6.1 North America
6 COMPETITIVE LANDSCAPE
- 6.1 Market Concentration
- 6.2 Strategic Moves
- 6.3 Market Share Analysis
- 6.4 Company Profiles (includes Global Level Overview, Market Level Overview, Core Segments, Financials as available, Strategic Information, Market Rank/Share, Products and Services, Recent Developments)
- 6.4.1 Accenture plc
- 6.4.2 IBM Corporation
- 6.4.3 Tata Consultancy Services Limited
- 6.4.4 Oracle Corporation
- 6.4.5 BAE Systems plc
- 6.4.6 Wipro Limited
- 6.4.7 Cognizant Technology Solutions Corporation
- 6.4.8 Deloitte Touche Tohmatsu Limited
- 6.4.9 Infosys Limited
- 6.4.10 MDS Systems Integration
- 6.4.11 Capgemini SE
- 6.4.12 Tech Mahindra Limited
- 6.4.13 Siemens AG
- 6.4.14 Fujitsu Limited
- 6.4.15 CGI Inc.
- 6.4.16 DXC Technology Company
- 6.4.17 Cisco Systems, Inc.
- 6.4.18 HCL Technologies Limited
- 6.4.19 Hitachi Vantara LLC
- 6.4.20 Atos SE
- 6.4.21 SAP SE
- 6.4.22 NEC Corporation
- 6.4.23 NTT DATA Corporation
- 6.4.24 EPAM Systems, Inc.
- 6.4.25 MuleSoft LLC
- 6.4.26 Red Hat, Inc.
7 MARKET OPPORTUNITIES AND FUTURE OUTLOOK
- 7.1 White-Space and Unmet-Need Assessment