|
시장보고서
상품코드
2124974
광 스위치 : 시장 점유율 분석, 업계 동향 및 통계, 성장 예측(2026-2031년)Optical Switches - Market Share Analysis, Industry Trends & Statistics, Growth Forecasts (2026 - 2031) |
||||||
 Mordor Intelligence
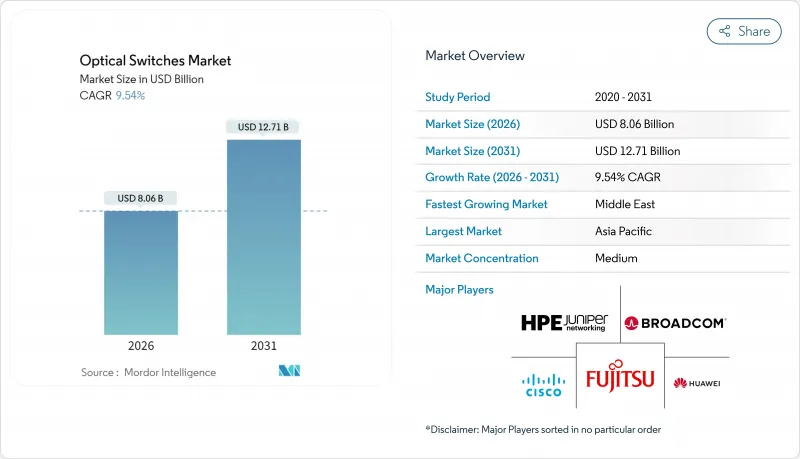
Mordor Intelligence에 의하면, 광 스위치 시장 규모는 2026년에 80억 6,000만 달러에 이르고, 2031년까지 127억 1,000만 달러로 확대되어 CAGR은 9.54%를 나타낼 전망입니다.
본 보고서는 스위칭 기술(전기광학, 열광학 스위칭, 기타), 포트 수(1×2, 1×4, 1×8, 1×16 이상), 데이터 전송 속도(최대 40Gbps, 40-100Gbps, 기타), 최종 사용자 산업(IT 및 통신, 제조, 기타),용도(회선 교환, 다중화, 크로스 커넥트, 기타), 지역별로 분류되어 있습니다. 시장 전망은 금액(달러) 기준으로 제시되어 있습니다.
세계의 광 스위치 시장 동향 및 인사이트
하이퍼스케일 데이터센터 건설 급증
각 하이퍼스케일러 기업들은 전력 소비를 줄이고 지연 시간의 급격한 상승을 억제하기 위해 광 패브릭으로의 전환을 추진하고 있습니다. 마이크로소프트는 2025년에 12개의 Azure 존에 광 회로 스위치를 도입하여 랙 수준의 전력 소비를 18% 절감했습니다. AWS는 차세대 Graviton 플랫폼을 위해 실리콘 포토닉스를 코패키징한 광 모듈을 채택하여 Top-of-Rack(ToR)에서의 홉을 제거하는 것을 목표로 하고 있습니다. 구글과 메타의 유사한 움직임은 결정론적인 이스트-웨스트 대역폭으로의 구조적 전환을 뒷받침하고 있습니다. 이러한 업그레이드는 전력 비용과 세제 혜택이 유리한 버지니아주, 오리건주, 싱가포르, 아랍에미리트에 집중되어 있습니다.
급속히 진행 중인 5G와 향후 예정된 6G의 백홀 고밀도화
이동통신 사업자들은 수천 개의 스몰 셀에서 발생하는 트래픽을 집계하기 위해 중앙국이나 엣지 사이트에 광 스위치를 도입하고 있습니다. 차이나모바일은 47개 성 허브에 MEMS 스위치를 도입하여 임대 회선 쌍 수를 29% 줄였습니다. 버티 에어텔(Bharti Airtel)도 인도의 18개 대도시권에서 이를 따르고 있으며, 한편 보다폰(Vodafone)의 오픈 RAN 계획에는 실시간 프론트홀 재할당을 실현하기 위해 광 크로스 커넥트가 통합되어 있습니다. GSM 협회는 이미 광 회선 교환을 6G 백홀의 기반으로 자리매김하고 있으며, 향후 트래픽 요구 사항을 강조하고 있습니다.
전자식 리프-스파인 패브릭에 대한 지속적인 가격 프리미엄
100Gbps 및 200Gbps 포트 계층에서 광 스위치는 전자식 스위치에 비해 여전히 35-50% 더 비쌉니다. Dell'Oro는 2025년 2분기 32포트 광 스위치 섀시의 가격을 4만 7,000달러로 추정한 반면, 동급의 전자식 스위치는 3만 1,000달러로 추정했습니다. 많은 중견 기업들은 Arista Networks가 제시한 3년의 투자 회수 기간을 감당하지 못해, 하이퍼스케일 환경 이외의 분야에서는 보급이 더딘 양상을 보이고 있습니다.
부문별 분석
MEMS 기술은 2025년에 시장의 43.89%를 차지했으며, 2031년까지 연평균 성장률(CAGR) 10.62%를 나타낼 것으로 전망됩니다. 각 하이퍼스케일러 기업들이 AI 워크로드의 부하 분산을 위해 밀리초 미만의 재구성을 요구하고 있기 때문에 MEMS 플랫폼용 광 스위치 시장 규모는 확대되고 있습니다. 삽입 손실이 2.5dB 미만인 Calient의 1,024×1,024 어레이는 높은 포트 수를 가진 MEMS가 포드 내의 스파인 라우터를 대체하고 있는 현실을 보여줍니다. 전기광학식 리튬 니오브산염의 변형은 주로 금융 및 방위 부문과 같이 나노초 단위의 스위칭이 요구되는 틈새 시장을 대상으로 하고 있지만, 전력 소비가 크기 때문에 주류로 채택되는 경우는 제한적입니다. 열광학 소자는 비용 효율을 중시하는 메트로 계약에서 우위를 점하고 있는 반면, 자기광학 스위치는 양자 컴퓨팅 시범 프로젝트에 국한된 상태입니다. 특허 출원 건수는 전년 대비 47% 증가하여, 구동 물리학 부문에서의 활발한 연구 개발을 반영하고 있습니다.
2차적인 영향으로는 공급망의 변화가 주를 이룹니다. 대만과 한국에 위치한 전문 MEMS 팹은 설계부터 생산에 이르는 서비스를 제공함으로써, 스타트업 기업의 진입 장벽을 낮추는 동시에 구매자에게 더 다양한 공급업체 선택지를 제공합니다. 유럽에서는 IEC 61753 신뢰성 프로토콜 준수가 이제 필수 조건이 되었으며, 각 공급업체는 제품이 하루 수백만 회의 사이클을 견딜 수 있도록 내구성을 강화하고 있습니다. 이러한 동향들이 맞물리면서, MEMS는 광 스위치 시장에서 향후 경쟁 벤치마킹의 기준으로 확고한 입지를 다지고 있습니다.
1X8 제품군은 액세스 애그리게이션 및 테스트 계측 랙에서 폭넓게 채택됨에 따라 2025년에는 매출 점유율의 36.71%를 차지했습니다. 그러나 하이퍼스케일 사업자들이 스파인 레벨의 메쉬 패브릭을 추구함에 따라 수요는 1X16 및 그 이상의 매트릭스로 빠르게 이동하고 있으며, 연평균 성장률(CAGR) 10.41%로 확대되고 있습니다. Meta의 데이터센터 개편을 위해 Lumentum이 새로 인증을 받은 1X32 MEMS 스위치는 그 대표적인 예입니다. 1X2 래칭 모델과 같은 하위 등급 제품은 보호 체계에서 여전히 필수적이지만, 매출에 기여하는 비중은 줄어들고 있습니다.
고밀도 제품은 패킷용 실리콘을 거치지 않고 ‘엘리펀트 플로우’를 오프로드하는 광 회로 교환형 오버레이를 구현하여 지연 시간을 획기적으로 단축합니다. 예를 들어, 유럽의 연구 네트워크에서는 1X64 어레이를 도입한 결과 지연 시간이 68% 감소한 것으로 입증되었습니다. 이러한 측정 가능한 이점을 고려할 때, 다포트 스위치는 금세기 말까지 기존 포트 수를 넘어설 것으로 예상되며, 광 스위치 시장에서 그 전략적 중요성이 더욱 높아질 것으로 전망됩니다.
지역별 분석
아시아태평양은 중국의 양자 백본, 인도의 5G 독립형(SA) 구축, 일본의 올림픽 이후 데이터센터 붐에 힘입어 2025년에는 전 세계 매출의 35.79%를 차지했습니다. 차이나모바일은 12개 성을 연결하는 양자 링크를 광 스위치로 연결하여 2028년까지 50개 도시를 커버하는 것을 목표로 하고 있습니다. 바티 에어텔의 18개 대도시권에 걸친 광섬유 구축으로 백홀용 광섬유 요구량이 31% 감소했습니다. 한국의 6G 로드맵에서는 광 스위칭이 테라헤르츠 대역 프론트홀을 실현하는 기술로 꼽히고 있는 반면, 호주의 국립 광대역 네트워크(NBN)는 광 네트워크 업그레이드에 12억 호주 달러(8억 400만 달러)를 투자했습니다.
중동에서는 사우디아라비아와 아랍에미리트가 클라우드 용량의 현지화를 추진함에 따라 2031년까지 연평균 10.51%의 성장이 예상됩니다. 사우지 텔레콤은 NEOM 스마트 시티의 백본과 실시간 전력망 자동화를 지원하기 위해 MEMS 스위치를 도입했습니다. 에티살라트는 산업용 IoT를 위해 5밀리초 미만의 지연을 실현하는 것을 목표로 5G 코어에 광 패브릭을 통합했습니다.
북미는 마이크로소프트, 아마존, 구글이 주도하는 150억 달러 규모의 하이퍼스케일 시설 개조를 견인하며 2025년 수요의 약 30%를 차지했습니다. 유럽은 22% 가까이 차지했으며, 독일과 프랑스의 통신 사업자들이 에너지 효율 규제에 대응하기 위해 업그레이드를 가속화하고 있습니다. 남미와 아프리카를 합치면 8% 미만이었습니다만, 브라질의 새로운 주파수 대역 할당 및 케냐의 광섬유 회랑에 대한 자금 지원으로 호재를 맞이하고 있습니다. EU의 ‘네트워크 및 정보 보안 지침 2(NIS II)’와 미국 FCC가 제안하고 있는 상호 운용성 의무화 같은 규제 프레임워크는 보안 및 호환성 기준을 표준화함으로써 각 지역의 도입 곡선을 형성할 것으로 보입니다.
기타 혜택
- 엑셀 형식 시장 예측(ME) 시트
- 3개월간의 애널리스트 지원
자주 묻는 질문
목차
제1장 서론
제2장 조사 방법
제3장 주요 요약
제4장 시장 구도
제5장 시장 규모 및 성장 예측
제6장 경쟁 구도
제7장 시장 기회 및 향후 전망
KTH 26.09.14According to Mordor Intelligence, the optical switches market size reached USD 8.06 billion in 2026 and is projected to climb to USD 12.71 billion by 2031, advancing at a 9.54% CAGR.
This report is Segmented by Switching Technology (Electro-Optic, Thermo-Optic Switching, and More), Port Count (1X2, 1X4, 1X8, and 1X16 and Above), Data Rate (Up To 40 Gbps, 40-100 Gbps, and More), End-User Industry (IT and Telecom, Manufacturing, and More), Application (Circuit Switching, Multiplexing, Cross-Connects, and More), and Geography. The Market Forecasts are Provided in Terms of Value (USD).
Global Optical Switches Market Trends and Insights
Surge in Hyperscale Data-Center Buildouts
Hyperscalers are shifting to optical fabrics to shave power budgets and curb latency spikes. Microsoft rolled out optical circuit switches across 12 Azure zones in 2025 and cut rack-level power draw by 18%. AWS is committed to silicon-photonics co-packaged optics for its next Graviton platforms, eliminating top-of-rack hops. Similar moves by Google and Meta confirmed a structural transition toward deterministic east-west bandwidth. These upgrades concentrate in Virginia, Oregon, Singapore, and the United Arab Emirates, where electricity costs and tax policies are favorable.
Rapid 5G and Forthcoming 6G Backhaul Densification
Mobile operators are inserting optical switches into central offices and edge sites to aggregate traffic from thousands of small cells. China Mobile equipped 47 provincial hubs with MEMS switches, trimming leased-fiber pairs by 29%. Bharti Airtel followed in 18 Indian metro areas, while Vodafone's Open RAN plan embeds optical cross-connects for real-time fronthaul redistribution. The GSM Association has already positioned optical circuit switching as a baseline for 6G backhaul, underscoring future traffic requirements.
Persistent Premium Over Electronic Leaf-Spine Fabrics
At 100- and 200 Gbps port tiers, optical switches remain 35-50% more expensive than their electronic peers. Dell'Oro pegged a 32-port optical chassis at USD 47,000 versus USD 31,000 for an electronic equivalent in Q2 2025. Many mid-tier enterprises cannot absorb the three-year payback threshold cited by Arista Networks, slowing penetration outside hyperscale footprints.
Other drivers and restraints analyzed in the detailed report include:
- Silicon-Photonics Cost Curve Crossing for >=400 Gbps Ports
- Energy-Efficiency Mandates Favoring All-Optical Switching
- Limited Field Expertise for Multi-Terabit Optical Fabrics
For complete list of drivers and restraints, kindly check the Table Of Contents.
Segment Analysis
MEMS technology accounted for 43.89% of the market in 2025 and is tracking a 10.62% CAGR through 2031. The optical switches market size for MEMS platforms is climbing as hyperscalers specify sub-millisecond reconfiguration for AI workload balancing. Calient's 1,024X1,024 array, with insertion loss below 2.5 dB, illustrates how high-port-count MEMS is replacing spine routers in pods. Electro-optic lithium niobate variants target nanosecond-switching niches, mainly finance and defense, but their higher power draw curbs mainstream adoption. Thermo-optic devices are winning cost-sensitive metro contracts, while magneto-optic switches stay limited to quantum pilots. Patent filings grew 47% year over year, reflecting brisk R&D in actuation physics.
Second-order effects center on supply-chain shifts. Specialized MEMS fabs in Taiwan and South Korea offer design-to-production services, lowering entry barriers for startups and widening vendor choice for buyers. Compliance with IEC 61753 reliability protocols is now non-negotiable in Europe, spurring vendors to harden products for millions of daily cycles. Collectively, these dynamics entrench MEMS as the benchmark for future competitive benchmarking in the optical switches market.
The 1X8 cohort held a 36.71% revenue share in 2025, owing to broad adoption in access aggregation and test-and-measurement racks. Yet demand is rapidly tilting toward 1X16 and larger matrices, expanding at a 10.41% CAGR as hyperscale operators pursue spine-level mesh fabrics. Lumentum's newly qualified 1X32 MEMS switch for Meta's data-center refresh is emblematic. Lower tiers, such as 1X2 latching models, remain vital for protection schemes but generate less revenue.
High-density products enable optical circuit-switched overlays that offload elephant flows without engaging packet silicon, driving step-function latency gains. European research networks, for example, documented a 68% reduction in latency after inserting 1X64 arrays. Given these measurable advantages, large-port switches are expected to eclipse legacy counts before the end of the decade, reinforcing their strategic importance in the optical switches market.
Complete Report Scope:
- By Switching Technology
- Electro-Optic Switching
- Acousto-Optic Switching
- MEMS-Based Switching
- Magneto-Optic Switching
- Thermo-Optic Switching
- Other Switching Technologies
- By Port Count
- 1X2
- 1X4
- 1X8
- 1X16 and Above
- By Data Rate
- Up to 40 Gbps
- 40-100 Gbps
- 100-400 Gbps
- Above 400 Gbps
- By End-User Industry
- IT and Telecom
- Government and Defense
- Banking, Financial Services, and Insurance (BFSI)
- Manufacturing
- Healthcare and Life Sciences
- Other End-User Industries
- By Application
- Circuit Switching
- Testing and Monitoring
- Multiplexing
- Cross-Connects
- Signal Monitoring
- Other Applications
- By Geography
- North America
- United States
- Canada
- Mexico
- Europe
- Germany
- United Kingdom
- France
- Russia
- Rest of Europe
- Asia-Pacific
- China
- Japan
- India
- South Korea
- Australia
- Rest of Asia-Pacific
- Middle East and Africa
- Middle East
- Saudi Arabia
- United Arab Emirates
- Rest of Middle East
- Africa
- South Africa
- Egypt
- Rest of Africa
- Middle East
- South America
- Brazil
- Argentina
- Rest of South America
- North America
Geography Analysis
Asia Pacific generated 35.79% of global revenue in 2025, fueled by China's quantum backbones, India's 5G standalone buildouts, and Japan's post-Olympic data-center boom. China Mobile connected 12 provincial quantum links with optical switches, aiming for 50-city coverage by 2028. Bharti Airtel's optical fiber rollout across 18 metros reduced backhaul fiber requirements by 31%. South Korea's 6G roadmap names optical switching as a terahertz fronthaul enabler, while Australia's National Broadband Network committed AUD 1.2 billion (USD 804 million) to optical upgrades.
The Middle East is projected to grow at 10.51% through 2031 as Saudi Arabia and the United Arab Emirates localize cloud capacity. Saudi Telecom installed MEMS switches to underpin the NEOM smart-city backbone and real-time grid automation. Etisalat integrated optical fabrics into its 5G core, aiming for sub-5 ms latency for industrial IoT.
North America held roughly 30% of 2025 demand, anchored by USD 15 billion in hyperscale retrofits from Microsoft, Amazon, and Google. Europe accounted for nearly 22%, with German and French operators accelerating upgrades to meet energy-efficiency regulations. South America and Africa together contributed under 8%, but they received tailwinds from new spectrum allocations in Brazil and fiber corridor funding in Kenya. Regulatory frameworks, such as the EU's Network and Information Security Directive 2 and a proposed U.S. FCC interoperability mandate, will shape regional adoption curves by standardizing security and compatibility baselines.
- Broadcom Inc.
- Cisco Systems Inc.
- Huawei Technologies Co. Ltd.
- Fujitsu Ltd.
- Nokia Corporation
- Juniper Networks Inc.
- NTT Advanced Technology Corporation
- Furukawa Electric Co. Ltd.
- Keysight Technologies Inc.
- Agiltron Inc.
- Ciena Corporation
- Infinera Corporation
- Huber+Suhner AG
- Lumentum Holdings Inc.
- II-VI Incorporated (Coherent Corp.)
- DiCon Fiberoptics Inc.
- Sercalo Microtechnology Ltd.
- Calient Technologies Inc.
- Accelink Technologies Co. Ltd.
- HYC Co. Ltd.
Additional Benefits:
- The market estimate (ME) sheet in Excel format
- 3 months of analyst support
TABLE OF CONTENTS
1 INTRODUCTION
- 1.1 Study Assumptions and Market Definition
- 1.2 Scope of the Study
2 RESEARCH METHODOLOGY
3 EXECUTIVE SUMMARY
4 MARKET LANDSCAPE
- 4.1 Market Overview
- 4.2 Market Drivers
- 4.2.1 Surge In Hyperscale Data-Center Buildouts
- 4.2.2 Rapid 5G And Forthcoming 6G Backhaul Densification
- 4.2.3 Silicon-Photonics Cost Curve Crossing For >=400 Gbps Ports
- 4.2.4 Energy-Efficiency Mandates Favouring All-Optical Switching
- 4.2.5 Government Quantum-Network Pilot Deployments
- 4.2.6 AI-Driven Optical Network Automation And Self-Healing
- 4.3 Market Restraints
- 4.3.1 Persistent Premium Over Electronic Leaf-Spine Fabrics
- 4.3.2 Limited Field Expertise For Multi-Terabit Optical Fabrics
- 4.3.3 Supply-Chain Exposure To III-V Wafer Shortages
- 4.3.4 Cyber-Resilience Certification Lag For Mission-Critical Users
- 4.4 Industry Value Chain Analysis
- 4.5 Impact of Macroeconomic Factors on the Market
- 4.6 Regulatory Landscape
- 4.7 Technological Outlook
- 4.8 Porter's Five Forces Analysis
- 4.8.1 Threat of New Entrants
- 4.8.2 Bargaining Power of Buyers
- 4.8.3 Bargaining Power of Suppliers
- 4.8.4 Threat of Substitutes
- 4.8.5 Intensity of Competitive Rivalry
5 MARKET SIZE AND GROWTH FORECASTS (VALUE)
- 5.1 By Switching Technology
- 5.1.1 Electro-Optic Switching
- 5.1.2 Acousto-Optic Switching
- 5.1.3 MEMS-Based Switching
- 5.1.4 Magneto-Optic Switching
- 5.1.5 Thermo-Optic Switching
- 5.1.6 Other Switching Technologies
- 5.2 By Port Count
- 5.2.1 1X2
- 5.2.2 1X4
- 5.2.3 1X8
- 5.2.4 1X16 and Above
- 5.3 By Data Rate
- 5.3.1 Up to 40 Gbps
- 5.3.2 40-100 Gbps
- 5.3.3 100-400 Gbps
- 5.3.4 Above 400 Gbps
- 5.4 By End-User Industry
- 5.4.1 IT and Telecom
- 5.4.2 Government and Defense
- 5.4.3 Banking, Financial Services, and Insurance (BFSI)
- 5.4.4 Manufacturing
- 5.4.5 Healthcare and Life Sciences
- 5.4.6 Other End-User Industries
- 5.5 By Application
- 5.5.1 Circuit Switching
- 5.5.2 Testing and Monitoring
- 5.5.3 Multiplexing
- 5.5.4 Cross-Connects
- 5.5.5 Signal Monitoring
- 5.5.6 Other Applications
- 5.6 By Geography
- 5.6.1 North America
- 5.6.1.1 United States
- 5.6.1.2 Canada
- 5.6.1.3 Mexico
- 5.6.2 Europe
- 5.6.2.1 Germany
- 5.6.2.2 United Kingdom
- 5.6.2.3 France
- 5.6.2.4 Russia
- 5.6.2.5 Rest of Europe
- 5.6.3 Asia-Pacific
- 5.6.3.1 China
- 5.6.3.2 Japan
- 5.6.3.3 India
- 5.6.3.4 South Korea
- 5.6.3.5 Australia
- 5.6.3.6 Rest of Asia-Pacific
- 5.6.4 Middle East and Africa
- 5.6.4.1 Middle East
- 5.6.4.1.1 Saudi Arabia
- 5.6.4.1.2 United Arab Emirates
- 5.6.4.1.3 Rest of Middle East
- 5.6.4.2 Africa
- 5.6.4.2.1 South Africa
- 5.6.4.2.2 Egypt
- 5.6.4.2.3 Rest of Africa
- 5.6.4.1 Middle East
- 5.6.5 South America
- 5.6.5.1 Brazil
- 5.6.5.2 Argentina
- 5.6.5.3 Rest of South America
- 5.6.1 North America
6 COMPETITIVE LANDSCAPE
- 6.1 Market Concentration
- 6.2 Strategic Moves
- 6.3 Market Share Analysis
- 6.4 Company Profiles (includes Global-level Overview, Market-level Overview, Core Segments, Financials as available, Strategic Information, Market Rank/Share, Products and Services, Recent Developments)
- 6.4.1 Broadcom Inc.
- 6.4.2 Cisco Systems Inc.
- 6.4.3 Huawei Technologies Co. Ltd.
- 6.4.4 Fujitsu Ltd.
- 6.4.5 Nokia Corporation
- 6.4.6 Juniper Networks Inc.
- 6.4.7 NTT Advanced Technology Corporation
- 6.4.8 Furukawa Electric Co. Ltd.
- 6.4.9 Keysight Technologies Inc.
- 6.4.10 Agiltron Inc.
- 6.4.11 Ciena Corporation
- 6.4.12 Infinera Corporation
- 6.4.13 Huber+Suhner AG
- 6.4.14 Lumentum Holdings Inc.
- 6.4.15 II-VI Incorporated (Coherent Corp.)
- 6.4.16 DiCon Fiberoptics Inc.
- 6.4.17 Sercalo Microtechnology Ltd.
- 6.4.18 Calient Technologies Inc.
- 6.4.19 Accelink Technologies Co. Ltd.
- 6.4.20 HYC Co. Ltd.
7 MARKET OPPORTUNITIES AND FUTURE OUTLOOK
- 7.1 White-Space and Unmet-Need Assessment