
|
시장보고서
상품코드
2125376
시큐어 액세스 서비스 엣지(SASE) : 시장 점유율 분석, 업계 동향 및 통계, 성장 예측(2026-2031년)Secure Access Service Edge - Market Share Analysis, Industry Trends & Statistics, Growth Forecasts (2026 - 2031) |
||||||
 Mordor Intelligence
Mordor Intelligence에 의하면, 시큐어 액세스 서비스 엣지(SASE) 시장 규모는 2025년 122억 1,000만 달러로 평가되었습니다. 2026년에는 155억 4,000만 달러로 확대되어 2031년까지 391억 4,000만 달러에 이를 것으로 예상되고 2026년부터 2031년에 걸쳐 CAGR 20.29%로 성장할 전망입니다.
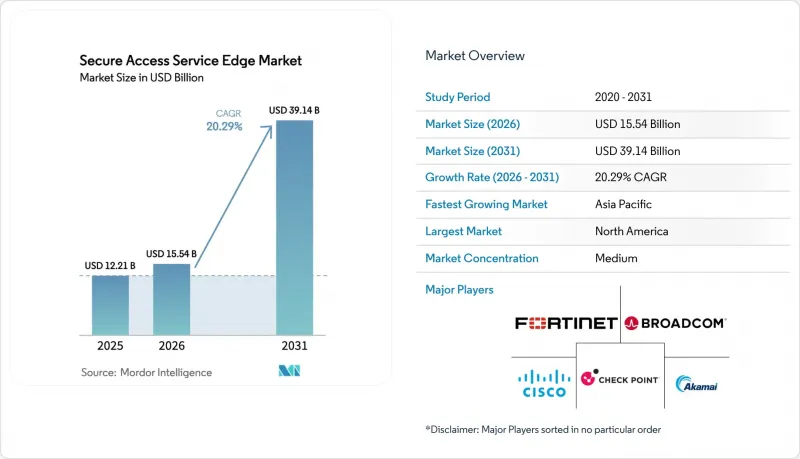
본 보고서는 제공 방식(Network-As-A-Service 등), 배포 모드(클라우드 네이티브 SASE, 하이브리드 SASE 등), 조직 규모(대기업 등), 최종 사용자 산업(은행 및 금융 서비스·보험(BFSI), 소매 및 전자상거래 등),접속 채널(지점 등), 지역별로 분류되어 있습니다. 시장 예측은 금액(달러) 기준으로 제시되어 있습니다.
세계의 시큐어 액세스 서비스 엣지(SASE) 시장 동향 및 인사이트
SD-WAN, FWaaS, SWG, CASB, ZTNA의 통합을 통한 통합된 클라우드 네이티브 스택의 형성
기업들은 과거 별도로 운영되던 5가지 제어 기능을 단일 SASE 패브릭으로 통합하여, 콘솔의 난립과 정책 편차를 해소하고 있습니다. 가트너의 조사에 따르면, 이러한 전환을 통해 네트워크 보안의 지속적인 운영 비용이 40% 절감될 것으로 나타났습니다. 모든 것이 하나의 정책 엔진으로 통합됨에 따라, 보안 웹 게이트웨이에서 발생한 피싱 경보가 별도의 사용자 정의 스크립트 없이도 클라우드 액세스 브로커에서 세션의 즉시 만료나 기기 격리를 즉각적으로 유발할 수 있게 되어, 대응 주기가 수 초 단위로 단축되었습니다. 각 벤더사는 하이퍼스케일 기업과의 제휴를 통해 도입을 가속화하고 있습니다. Palo Alto Networks와 Google Cloud는 엣지에서 SASE 노드를 사전 프로비저닝하고 있으며, 고객은 하드웨어를 조달할 필요 없이 API를 통해 마이크로 세분화을 활성화할 수 있으므로 도입 기간을 수개월에서 수일로 단축할 수 있습니다. 금융 기관이 도입을 주도하고 있는 이유는 PCI DSS v4.0이 부문 전반에 걸친 지속적인 모니터링을 요구하고 있으며, 멀티 벤더 스택에서는 이러한 감사가 어렵기 때문입니다. 통합 플랫폼이 성숙해짐에 따라, 의도를 규칙으로 변환하는 머신 러닝 기반의 정책 추천 기능이 추가되어, 이미 업무에 쫓기는 보안 팀의 관리 부담이 경감되고 있습니다.
2025년 이후 원격 및 하이브리드 근무 인력의 급증
2025년까지 OECD 회원국의 고용의 약 3분의 1이 원격 근무로 전환되었으며, 과거 VPN이 지키던 고정된 경계는 점차 사라지고 있습니다. SASE는 네트워크에 관계없이 신원 중심의 규칙을 적용하기 때문에 직원은 자택의 광대역 인터넷이나 5G 핫스팟을 통해 연결할 수 있으며, 트래픽을 데이터센터로 백홀할 필요가 없습니다. Netskope의 에이전트 없는 DLP는 SaaS로의 업로드를 실시간으로 스캔하여, 사용자 경험을 저해하지 않으면서도 보안 기능을 눈에 띄지 않게 운영할 수 있음을 입증하고 있습니다. 미국 메디케어·메디케이드 서비스 센터(CMS)의 보고에 따르면, 2024년부터 2025년에 걸쳐 온라인 진료 건수가 63% 급증하면서, 병원들은 HIPAA에 따라 임상의의 개인 단말기 보안을 확보해야만 했습니다. 또한 기업들도 지역 데이터센터를 폐쇄하고 트래픽을 클라우드 PoP(접속 지점)로 직접 라우팅함으로써 WAN 비용을 3분의 1 이상 절감하는 동시에 SaaS 지연 시간을 개선했습니다.
실시간 용도에서 인라인 보안으로 인한 지연
딥 패킷 검사(DPI)와 TLS 복호화는 암호화된 트래픽에 12-35밀리초의 지연을 초래합니다. 이는 수익을 내기 위해 마이크로초 단위의 차이가 중요한 고빈도 거래 업체에게는 용납할 수 없는 지연입니다. 포티넷은 NVIDIA BlueField-3 DPU를 통합하여 이 지연 문제를 해결하고 있습니다. 이를 통해 CPU에 부하를 주지 않고 100 Gbps로 검사 처리를 오프로드할 수 있지만, 하드웨어 비용은 소프트웨어 전용 장비에 비해 40-60% 더 높습니다. 실리콘을 통한 지원이 있더라도, 아시아태평양의 기업에서는 국경을 넘는 거래소에서 혼잡이 발생하여 종단 간 지연이 2배로 늘어나기 때문에 공장에서는 시간적 제약이 엄격한 제어 회선에서 SASE를 우회하는 경우가 많습니다. 클라우드 네이티브 제공업체들은 전 세계 300곳 이상의 PoP(접속 지점)를 활용하여 이 문제를 해결하려고 하고 있지만, 각 사이트에는 지속적인 자본 투자가 필요하며 엣지 밀도 확장에 한계가 있습니다. 검사 오버헤드가 용도의 허용 임계값 아래로 떨어질 때까지는 지연 시간이 음성, 비디오 및 알고리즘 트레이딩 워크로드의 도입을 계속해서 제약할 것입니다.
부문별 분석
Security-as-a-Service(SaaS)의 시큐어 액세스 서비스 엣지(SASE) 시장 점유율은 2025년에 58.34%에 달했습니다. 이는 기업들이 위협 방지 및 데이터 유출 대책에 중점을 두고 있음을 반영합니다. 금융 기관이 도입을 주도한 배경에는 감사 시 가동 시간보다 암호화 및 이상 감지가 더 엄격하게 검토되기 때문입니다. 예측 기간 동안 Network-as-a-Service(NaaS)는 20.63%라는 가장 높은 연평균 성장률(CAGR)을 보일 것으로 예상되며, 인터넷 기반 전송이 MPLS 회선을 대체하고 경로 선택 분석이 성능 조정에 필수적이 됨에 따라 시큐어 액세스 서비스 엣지(SASE) 시장을 주도할 것입니다.
또한, 조직이 지역 허브를 폐쇄하고 SaaS의 응답성을 유지하기 위해 동적 경로 최적화에 의존하게 됨에 따라 지점 통합도 네트워크 모듈 수요를 끌어올리고 있습니다. 소매 그룹의 사례에서 볼 수 있듯이, 결제 시 지연은 고객 만족도와 직결되므로 체인 소유주는 보안 모듈이 백그라운드에서 조용히 작동하더라도 지능형 경로 조정을 우선시하고 있습니다. 상세한 경로 가시성과 제로 트러스트 정책 오케스트레이션을 융합한 벤더는 인프라 팀과 보안 팀 모두로부터 예산을 확보하고 있으며, 시큐어 액세스 서비스 엣지(SASE) 업계의 기존 경계가 모호해지고 있습니다.
클라우드 네이티브 SASE는 2025년에 67.53%의 점유율을 차지하며, 어플라이언스형 방화벽을 완전히 건너뛴 신규 도입 기업들을 계속해서 끌어모았습니다. 멀티테넌트형 클라우드는 수백만 건의 동시 접속을 처리하고 고객의 유지 관리 부담을 줄여줌으로써, 시큐어 액세스 서비스 엣지(SASE) 시장의 성장 궤도를 뒷받침하고 있습니다. 그럼에도 불구하고, 규제가 엄격한 업계에서는 중앙 집중식 관리를 유지하면서 데이터 상주 요건을 충족하기 위해 연평균 성장률(CAGR) 20.81%를 나타낼 것으로 예측되는 하이브리드 SASE가 채택되고 있습니다.
유럽의 은행들은 일반적으로 결제 처리를 On-Premise에서 유지하면서 웹 및 SaaS 트래픽을 클라우드상의 검사 노드로 전송함으로써 지연과 규정 준수의 균형을 맞추고 있습니다. 정책의 이식성은 여전히 중요하기 때문에 규칙을 재작성하지 않고도 단계적인 전환을 지원하는 플랫폼이 차별화 요소가 됩니다. 지연은 여전히 결정적인 요소입니다. 클라우드는 이메일 및 협업 성능을 균일하게 만들어 주지만, 음성이나 동영상의 경우 대개 로컬에서 검사가 필요하기 때문에 시큐어 액세스 서비스 엣지(SASE) 시장 전반에 걸쳐 하이브리드 방식의 유연성에 대한 수요가 지속되고 있습니다.
지역별 분석
북미는 엄격한 연방 규정 준수 프레임워크와 적극적인 제품 혁신의 위험을 완화해 주는 풍부한 벤처 캐피털을 결합함으로써 압도적인 입지를 유지했습니다. 퍼블릭 클라우드 제공업체들은 FedRAMP 인증을 획득했으며, 이를 통해 연방 정부 기관 및 방위 관련 기업들이 초기 실제 운영 파일럿에 참여했습니다. 실리콘을 활용한 고속 검사는 마이크로초 단위로 수익이 결정되는 월스트리트 트레이딩 플로어에서 큰 인기를 끌었습니다. 미국의 매니지드 서비스 제공업체들은 SASE를 5G 비즈니스 번들에 통합함으로써 판매 채널의 범위를 확대하고, 시큐어 액세스 서비스 엣지(SASE) 시장에서 꾸준한 계약 갱신 주기를 촉진했습니다.
중국의 사이버 보안법 개정과 인도의 데이터 보호법이 국내 데이터 처리를 의무화하는 가운데, 다국적 기업들은 소버린 패브릭 구축을 강요받고 있어 아시아태평양의 전망은 밝아지고 있습니다. 화웨이와 타타 커뮤니케이션즈와 같은 현지 유력 기업들은 규제에 대한 깊은 이해를 바탕으로 국가 프로젝트를 수주하고 있는 반면, 미국에 본사를 둔 제공업체들은 규정 준수 격차를 해소하기 위해 지역 데이터센터 운영 사업자와 제휴하고 있습니다. 동남아시아의 5G 급속한 확산과 모바일 우선 비즈니스 모델이 견조한 수요를 뒷받침하고 있어, 아시아태평양은 시큐어 액세스 서비스 엣지(SASE) 시장의 성장에서 계속해서 선두를 달리고 있습니다.
유럽에서는 신중한 조달 자세와 디지털 주권을 목표로 하는 진보적인 법규제 간의 균형이 잡혀 있습니다. ‘데이터법’은 제공업체에 엄격한 정보 공개 관리를 의무화하고 있어, 감사인에게 규정 준수를 증명해야 하는 기업들 사이에서 이 법의 도입을 촉진하고 있습니다. 북유럽 국가들은 기업의 지속가능성 노력과 부합하는 형태로 재생에너지를 활용한 데이터센터를 중시하고 있으며, 이를 통해 검사 관련 워크로드를 현지 거점으로 유치하고 있습니다. 사이버 보험료의 인상은 유럽 대륙의 기업들에게 통합된 제로 트러스트 프레임워크 도입을 더욱 촉진하고 있으며, 이는 회원국 전체에서 ‘시큐어 액세스 서비스 엣지(SASE)’ 시장의 점진적인 확장을 뒷받침하고 있습니다.
기타 혜택 :
- 엑셀 형식 시장 예측(ME) 시트
- 3개월간의 애널리스트 지원
자주 묻는 질문
목차
제1장 서론
제2장 조사 방법
제3장 주요 요약
제4장 시장 구도
제5장 시장 규모 및 성장 예측
제6장 경쟁 구도
제7장 시장 기회 및 향후 전망
KTH 26.09.14According to Mordor Intelligence, the secure access service edge market size is expected to increase from USD 12.21 billion in 2025 to USD 15.54 billion in 2026 and reach USD 39.14 billion by 2031, growing at a CAGR of 20.29% over 2026-2031.
This report is Segmented by Offering (Network-As-A-Service, and More), Deployment Mode (Cloud-Native SASE, Hybrid SASE, and More), Organization Size (Large Enterprises, and More), End-User Vertical (Banking, Financial Services and Insurance (BFSI), Retail and E-Commerce, and More), Access Channel (Branch Offices, and More), and Geography. The Market Forecasts are Provided in Terms of Value (USD).
Global Secure Access Service Edge Market Trends and Insights
Convergence Of SD-WAN, FWaaS, SWG, CASB, And ZTNA Into A Unified Cloud-Native Stack
Enterprises are folding five once-separate controls into a single SASE fabric to eliminate console sprawl and policy drift, a shift that Gartner found lowers ongoing network security operating costs by 40%. With everything in one policy engine, a phishing alert in the secure web gateway can now trigger instant session revocation at the cloud-access broker and device quarantine without custom scripts, tightening the response loop to seconds. Vendors accelerate adoption through hyperscale alliances; Palo Alto Networks and Google Cloud pre-provision SASE nodes at the edge, enabling customers to enable micro-segmentation via APIs instead of hardware procurement, cutting rollout time from months to days. Financial institutions lead uptake because PCI DSS v4.0 demands continuous, segment-wide monitoring that multi-vendor stacks struggle to audit. As unified platforms mature, they add machine-learning policy recommendations that translate intent into rules, shrinking administrative effort for already-stretched security teams.
Surge In Remote And Hybrid Workforce Post-2025
Remote work is locked in at roughly one-third of OECD employment by 2025, dissolving the fixed perimeter that VPNs once guarded. SASE enforces identity-centric rules regardless of network, so staff can connect from home broadband or 5G hotspots without backhauling traffic to a data center. Netskope's agentless DLP scans SaaS uploads in real time, proving that security can run invisibly without eroding user experience. The U.S. Centers for Medicare & Medicaid Services reported a 63% jump in virtual visits between 2024 and 2025, forcing hospitals to secure clinicians' personal devices under HIPAA. Enterprises also closed regional data centers and routed traffic directly to cloud points of presence, trimming WAN spend by more than one-third while improving SaaS latency.
In-Line Security Latency For Real-Time Applications
Deep-packet inspection and TLS decryption add 12-35 milliseconds of delay to encrypted traffic, a margin that high-frequency traders reject because microseconds matter for profit. Fortinet counters the drag by embedding NVIDIA BlueField-3 DPUs that offload inspection at 100 Gbps without taxing the CPU, but the hardware premium runs 40-60% above software-only gear. Even with silicon assist, enterprises in Asia-Pacific see congestion at cross-border exchanges that doubles end-to-end delay, so factories often bypass SASE for time-critical control lines. Cloud-native providers try to solve this with 300-plus global points of presence, yet each site needs constant capital infusion, limiting how far edge density can scale. Until inspection overhead falls below application thresholds, latency will restrain deployment in voice, video, and algorithmic trading workloads.
Other drivers and restraints analyzed in the detailed report include:
- Growing MSSP Adoption Of Turnkey SASE Offerings
- Increasing Sovereign-Cloud And Data Residency Mandates In Europe And Asia-Pacific
- Shortage Of Skilled SASE Architects And Operators
For complete list of drivers and restraints, kindly check the Table Of Contents.
Segment Analysis
The Secure Access Service Edge market share for Security-as-a-Service reached 58.34% in 2025, reflecting enterprise emphasis on threat prevention and data-loss controls. Financial institutions drove uptake because audits scrutinize encryption and anomaly detection more intensely than uptime. Over the forecast horizon, Network-as-a-Service is projected to post the swiftest 20.63% CAGR, propelling the SASE market as internet-based transport replaces MPLS circuits and as path-selection analytics become integral to performance tuning.
Branch consolidation also lifts network modules, as organizations close regional hubs and rely on dynamic route optimization to maintain SaaS responsiveness. Retail groups illustrate that checkout latency directly ties to customer satisfaction, so chain owners prioritize intelligent path steering even when security modules run silently in the background. Vendors that fuse deep path visibility with zero-trust policy orchestration win budget from both infrastructure and security teams, blurring the historical separation within the Secure Access Service Edge industry.
Cloud-Native SASE captured a 67.53% share in 2025 and continues to attract greenfield adopters who skipped appliance-based firewalls entirely. Multi-tenant clouds handle millions of concurrent connections and remove customer maintenance overhead, reinforcing the Secure Access Service Edge market trajectory. Nevertheless, heavily regulated sectors turn to Hybrid SASE, forecast to grow at a 20.81% CAGR, to meet residency requirements while preserving centralized control.
European banks typically keep payment processing on-premises while forwarding web and SaaS traffic to cloud inspection nodes, balancing latency with compliance. Policy portability remains crucial, so platforms that support gradual migration without rewriting rules differentiate. Latency remains the deciding factor: cloud equalizes email and collaboration performance, but voice and video often require local inspection, sustaining demand for hybrid flexibility across the SASE market.
Complete Report Scope:
- By Offering
- Network-as-a-Service (NaaS)
- Security-as-a-Service (SECaaS)
- By Deployment Mode
- Cloud-Native SASE
- Hybrid SASE
- On-Premise / Legacy-Integrated SASE
- By Organization Size
- Large Enterprises
- Small and Medium-Sized Enterprises (SMEs)
- By End-User Vertical
- Banking, Financial Services and Insurance (BFSI)
- Information Technology and Telecom
- Retail and E-Commerce
- Healthcare and Life Sciences
- Government and Public Sector
- Manufacturing and Industrial
- Other End-User Verticals
- By Access Channel
- Remote / Mobile Users
- Branch Offices
- IoT and Edge Devices
- By Geography
- North America
- United States
- Canada
- Mexico
- Europe
- Germany
- United Kingdom
- France
- Rest of Europe
- Asia-Pacific
- China
- Japan
- India
- South Korea
- Australia
- Rest of Asia-Pacific
- Middle East and Africa
- Middle East
- Saudi Arabia
- United Arab Emirates
- Rest of Middle East
- Africa
- South Africa
- Egypt
- Rest of Africa
- Middle East
- South America
- Brazil
- Argentina
- Rest of South America
- North America
Geography Analysis
North America maintained a commanding position by combining stringent federal compliance frameworks with abundant venture capital that de-risks aggressive product innovation. Public cloud providers secured FedRAMP authorizations, which drew federal agencies and defense contractors into early production pilots. Silicon-accelerated inspection gained popularity on Wall Street trading floors where microseconds define earnings. Managed service providers in the United States expanded channel reach by integrating SASE into 5G business bundles, fostering steady renewal cycles in the SASE market.
Asia-Pacific's outlook brightens as China's cybersecurity amendments and India's data protection act insist upon in-country processing, compelling multinationals to build sovereign fabrics. Domestic champions such as Huawei and Tata Communications leverage regulatory familiarity to secure national projects, while U.S.-headquartered providers partner with regional data center operators to address compliance gaps. Rapid 5G expansion and mobile-first business models in Southeast Asia underpin resilient demand, keeping Asia-Pacific at the forefront of Secure Access Service Edge market growth.
Europe balances cautious procurement with progressive legislation aimed at digital sovereignty. The Data Act binds providers to strict disclosure controls, driving adoption among enterprises that must evidence compliance to auditors. Nordic countries emphasize renewable-energy-powered data centers, aligning with corporate sustainability commitments and luring inspection workloads to local points of presence. Rising cyberinsurance premiums further motivate continental businesses to deploy unified zero-trust frameworks, supporting the gradual expansion of the Secure Access Service Edge market across member states.
- Akamai Technologies, Inc.
- Barracuda Networks, Inc.
- Broadcom Inc.
- Check Point Software Technologies Ltd.
- Cisco Systems, Inc.
- Cloudflare, Inc.
- Cato Networks Ltd.
- Forcepoint LLC
- Fortinet, Inc.
- Hewlett Packard Enterprise Company
- Huawei Technologies Co., Ltd.
- International Business Machines Corporation
- Juniper Networks, Inc.
- Netskope, Inc.
- Palo Alto Networks, Inc.
- Perimeter 81 Ltd.
- Proofpoint, Inc.
- Sangfor Technologies Inc.
- Tata Communications Limited
- Versa Networks, Inc.
- VMware, Inc.
- Zscaler, Inc.
- Aryaka Networks, Inc.
Additional Benefits:
- The market estimate (ME) sheet in Excel format
- 3 months of analyst support
TABLE OF CONTENTS
1 INTRODUCTION
- 1.1 Study Assumptions and Market Definition
- 1.2 Scope of the Study
2 RESEARCH METHODOLOGY
3 EXECUTIVE SUMMARY
4 MARKET LANDSCAPE
- 4.1 Market Overview
- 4.2 Market Drivers
- 4.2.1 Convergence of SD-WAN, FWaaS, SWG, CASB and ZTNA into a Unified Cloud-Native Stack
- 4.2.2 Surge in Remote and Hybrid Workforce Post-2025
- 4.2.3 Growing MSSP Adoption of Turnkey SASE Offerings
- 4.2.4 Increasing Sovereign-Cloud and Data Residency Mandates in Europe and Asia Pacific
- 4.2.5 Integration of eSIM-Native Zero-Trust SASE for Cellular IoT Fleets
- 4.2.6 Chip-Level Security Offload (SmartNIC / DPU) Enabling Inline Inspection at 100 Gbps+
- 4.3 Market Restraints
- 4.3.1 In-Line Security Latency for Real-Time Applications
- 4.3.2 Shortage of Skilled SASE Architects and Operators
- 4.3.3 Escalating Egress Fees From SaaS Providers for Hyperscale Inspection Workloads
- 4.3.4 Proprietary Policy Languages Hindering Multi-Vendor Orchestration
- 4.4 Industry Value Chain Analysis
- 4.5 Technological Outlook
- 4.6 Porter's Five Forces Analysis
- 4.6.1 Bargaining Power of Suppliers
- 4.6.2 Bargaining Power of Buyers
- 4.6.3 Threat of New Entrants
- 4.6.4 Threat of Substitutes
- 4.6.5 Competitive Rivalry
- 4.7 Impact of Macroeconomic Factors on the Market
- 4.8 Key Use Cases and Case Studies
- 4.9 Investment Analysis
5 MARKET SIZE AND GROWTH FORECASTS (VALUE)
- 5.1 By Offering
- 5.1.1 Network-as-a-Service (NaaS)
- 5.1.2 Security-as-a-Service (SECaaS)
- 5.2 By Deployment Mode
- 5.2.1 Cloud-Native SASE
- 5.2.2 Hybrid SASE
- 5.2.3 On-Premise / Legacy-Integrated SASE
- 5.3 By Organization Size
- 5.3.1 Large Enterprises
- 5.3.2 Small and Medium-Sized Enterprises (SMEs)
- 5.4 By End-User Vertical
- 5.4.1 Banking, Financial Services and Insurance (BFSI)
- 5.4.2 Information Technology and Telecom
- 5.4.3 Retail and E-Commerce
- 5.4.4 Healthcare and Life Sciences
- 5.4.5 Government and Public Sector
- 5.4.6 Manufacturing and Industrial
- 5.4.7 Other End-User Verticals
- 5.5 By Access Channel
- 5.5.1 Remote / Mobile Users
- 5.5.2 Branch Offices
- 5.5.3 IoT and Edge Devices
- 5.6 By Geography
- 5.6.1 North America
- 5.6.1.1 United States
- 5.6.1.2 Canada
- 5.6.1.3 Mexico
- 5.6.2 Europe
- 5.6.2.1 Germany
- 5.6.2.2 United Kingdom
- 5.6.2.3 France
- 5.6.2.4 Rest of Europe
- 5.6.3 Asia-Pacific
- 5.6.3.1 China
- 5.6.3.2 Japan
- 5.6.3.3 India
- 5.6.3.4 South Korea
- 5.6.3.5 Australia
- 5.6.3.6 Rest of Asia-Pacific
- 5.6.4 Middle East and Africa
- 5.6.4.1 Middle East
- 5.6.4.1.1 Saudi Arabia
- 5.6.4.1.2 United Arab Emirates
- 5.6.4.1.3 Rest of Middle East
- 5.6.4.2 Africa
- 5.6.4.2.1 South Africa
- 5.6.4.2.2 Egypt
- 5.6.4.2.3 Rest of Africa
- 5.6.4.1 Middle East
- 5.6.5 South America
- 5.6.5.1 Brazil
- 5.6.5.2 Argentina
- 5.6.5.3 Rest of South America
- 5.6.1 North America
6 COMPETITIVE LANDSCAPE
- 6.1 Market Concentration
- 6.2 Strategic Moves
- 6.3 Market Share Analysis
- 6.4 Company Profiles (includes Global Level Overview, Market Level Overview, Core Segments, Financials as Available, Strategic Information, Market Rank / Share for Key Companies, Products and Services, and Recent Developments)
- 6.4.1 Akamai Technologies, Inc.
- 6.4.2 Barracuda Networks, Inc.
- 6.4.3 Broadcom Inc.
- 6.4.4 Check Point Software Technologies Ltd.
- 6.4.5 Cisco Systems, Inc.
- 6.4.6 Cloudflare, Inc.
- 6.4.7 Cato Networks Ltd.
- 6.4.8 Forcepoint LLC
- 6.4.9 Fortinet, Inc.
- 6.4.10 Hewlett Packard Enterprise Company
- 6.4.11 Huawei Technologies Co., Ltd.
- 6.4.12 International Business Machines Corporation
- 6.4.13 Juniper Networks, Inc.
- 6.4.14 Netskope, Inc.
- 6.4.15 Palo Alto Networks, Inc.
- 6.4.16 Perimeter 81 Ltd.
- 6.4.17 Proofpoint, Inc.
- 6.4.18 Sangfor Technologies Inc.
- 6.4.19 Tata Communications Limited
- 6.4.20 Versa Networks, Inc.
- 6.4.21 VMware, Inc.
- 6.4.22 Zscaler, Inc.
- 6.4.23 Aryaka Networks, Inc.
7 MARKET OPPORTUNITIES AND FUTURE OUTLOOK
- 7.1 White-Space and Unmet-Need Assessment