

|
시장보고서
상품코드
2125385
북미의 쓰레기봉투 : 시장 점유율 분석, 업계 동향 및 통계, 성장 예측(2026-2031년)North America Trash Bags - Market Share Analysis, Industry Trends & Statistics, Growth Forecasts (2026 - 2031) |
||||||
 Mordor Intelligence
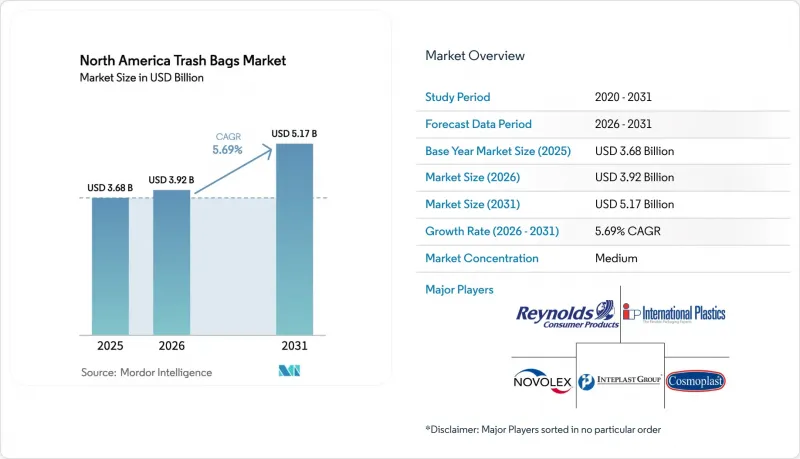
Mordor Intelligence에 의하면, 북미의 쓰레기봉투 시장 규모는 2025년 36억 8,000만 달러로 평가되었습니다. 2026년 39억 2,000만 달러에서 2031년까지 51억 7,000만 달러로 확대되고 2026년부터 2031년까지 연평균 복합 성장률(CAGR)은 5.69%를 나타낼 전망입니다.
본 보고서는 최종 사용자별(주거용, 상업용 등), 제품 유형별(저밀도 폴리에틸렌 봉투 등), 용량(8갤런 미만, 8-30갤런, 기타),원료 출처(버진 플라스틱, 소비 후 재활용 플라스틱, 하이브리드, 바이오 수지), 판매 채널(오프라인 소매, 온라인 소매, 기타), 지역별로 분류되어 있습니다. 시장 예측은 금액(달러)으로 표시되어 있습니다.
북미의 쓰레기봉투 시장 동향 및 인사이트
가정 쓰레기 증가 및 각 주의 매립 폐기물 감축 목표
2024년, 미국의 가정 쓰레기 배출량은 2억 9,200만 톤에 달했으며, 대도시권으로의 인구 유입으로 인해 1인당 폐기물 배출량이 증가하는 추세입니다. 캘리포니아주의 SB 1383 법안과 뉴욕주 및 매사추세츠주의 유사한 규제에 따라, 지자체는 유기물을 분리 수거할 의무가 있으며, ASTM D6400 규격을 준수하는 퇴비화 가능한 쓰레기 봉투에 대한 확실한 수요가 발생하고 있습니다. 지자체 조달 부서에서는 가구별 수거 시 교차 오염을 방지하기 위해 색상으로 구분된 다층 구조의 봉투를 지정하는 경향이 강해지고 있습니다. 각 변환 업체들은 재활용성을 해치지 않으면서 안료 밴드를 삽입하는 새로운 공압출 라인을 통해 이에 대응하고 있으며, 이러한 설비 투자 변화는 이미 연간 500만 달러 이상을 연구개발에 투자하고 있는 기존 기업들에게 유리하게 작용하고 있습니다. 이와 유사한 폐기물 감축 목표가 캐나다 각 주에도 확산되고 있는 만큼, 북미의 쓰레기 봉투 시장은 규제의 확실성을 기반으로 한 지속적인 성장 궤도에 올라 있습니다.
포춘 500대 기업 시설의 ‘제로 웨이스트’ 서약
현재 180개 이상의 포춘 500대 기업이 TRUE 또는 UL의 제로 웨이스트 인증 취득을 목표로 하고 있습니다. 이 인증을 받으려면 90% 이상의 자원화율과 최소 5가지 소재 분류가 요구됩니다. 감사 효율화를 위해 각 공장에서는 분리수거 작업자가 봉투를 개봉하지 않고도 내용물을 확인할 수 있는 투명한 내부 봉투로 전환하는 작업이 진행되고 있습니다. 이를 통해 프록터 앤 갬블(P&G)의 오하이오주 리마 공장에서는 2025년까지 오염 발생과 작업 시간을 12% 줄였습니다. 제너럴 모터스(GM)는 60갤런 용량의 반투명 쓰레기 봉투에 RFID 태그를 내장하여, 폐기물을 생산 셀까지 거슬러 올라가 추적할 수 있도록 했습니다. 이를 통해 작업자에 대한 맞춤형 교육이 가능해졌으며, 분리 수거 오류가 감소했습니다. 업소용 청소용품 도매업체에 따르면, 이러한 기능이 풍부한 SKU에는 20-30%의 가격 프리미엄이 붙어 있으며, 첨가제 배합 및 인라인 인쇄 기술을 습득한 컨버터 기업에게는 이익률 향상의 여지가 생기고 있습니다. 이처럼 기업의 노력이 확대됨에 따라 북미의 쓰레기 봉투 시장에서 지속 가능한 프리미엄 시장이 확립되고 있습니다.
변동이 심한 폴리에틸렌 및 바이오플라스틱 원료 가격
2025년, 멕시코만 연안의 허리케인으로 인한 혼란과 크래커 가동 중단으로 인해 LDPE 현물 가격은 파운드당 0.52달러에서 0.68달러 사이에서 변동했습니다. 가격 전가 조항이 없기 때문에 자사 브랜드 변환업체들은 이러한 가격 급등을 흡수할 수밖에 없어, 보통 12% 미만인 이익률이 더욱 압박받고 있습니다. 바이오플라스틱 원료 가격은 더욱 요동쳤으며, 중서부 지역의 가뭄으로 덱스트로스 수확량이 감소함에 따라 폴리젖산(PLA) 수지 가격은 파운드당 1.85달러에서 2.31달러로 상승했습니다. 중견 기업들은 현재 가격 변동을 헤지하기 위해 60-90일 분량의 재고를 보유하고 있으며, 이로 인해 공동 압출 성형 설비 업그레이드나 실험실 테스트에 사용되어야 할 운전 자금이 묶여 있습니다. 따라서 급격한 원가 상승은 북미의 쓰레기 봉투 시장 전체의 단기 수익성을 저해하는 요인이 되고 있습니다.
부문별 분석
2025년, 주거 부문은 북미의 쓰레기 봉투 시장 점유율의 45.67%를 차지했습니다. 이는 매주 주방용 쓰레기 봉투 구매를 안정화시키는 광범위한 문 앞 수거 프로그램의 혜택을 받은 결과입니다. 산업용 사용자 부문은 2031년까지 연평균 성장률(CAGR) 6.03%로 확대될 것으로 예상되며, 연방 정부 자금으로 진행되는 교량, 도로, 상수도 시스템 개보수 공사로 인해 견고한 라이너가 필요한 폐기물이 발생함에 따라 북미의 쓰레기봉투 시장 규모에서 차지하는 비중이 증가할 전망입니다. 건설업자들은 400psi를 초과하는 천공력을 견딜 수 있도록 설계된 30-55갤런 용량의 봉투를 지정하고 있으며, 조달 팀은 ASTM 성능 기준을 준수하는 것으로 확인된 제품에 대해 25-35%의 할증 가격을 지불하고 있습니다. 2025년 판매량의 약 32%는 사무실, 소매점, 접객 시설이 차지하고 있으며, 가동률이 68%로 회복됨에 따라 항균 첨가제가 함유된 청소용 봉투에 대한 수요가 뒷받침되고 있습니다.
상업 부문에 속하는 외식 사업자들은 NSF의 항균 프로토콜을 준수하는 인증을 받은 봉투를 선호하며, 이 틈새 시장은 2025년에 1,800만 달러의 벤처 자금을 조달했습니다. 또한, 산업 시설에서는 RFID 태그가 내장된 투명 쓰레기봉투가 채택되어, 제로 웨이스트 감사 담당자가 오염원을 특정 작업 셀까지 추적할 수 있게 되었습니다. 이 혁신적인 기술 덕분에 가격 프리미엄이 있음에도 불구하고 장기 계약이 확보되고 있습니다. 주거용 수요는 안정적이지만, 지자체에서 시행하는 무료 배포 제도를 통해 제공되는 재사용 가능한 용기로의 점진적인 대체가 진행되고 있습니다. 전반적으로, 예측 기간 동안 산업용 최종 사용자가 북미의 쓰레기 봉투 시장 규모에 대해 가장 큰 증분 수익을 가져올 것으로 전망됩니다.
저밀도 폴리에틸렌(LDPE)은 금형 사용에 익숙해질 필요가 없고 두께 편차를 유발하지 않으면서도 최대 40%의 소비 후 재생 수지를 배합할 수 있다는 점에 힘입어, 2025년 매출의 41.23%를 차지했습니다. 고밀도 폴리에틸렌(HDPE)은 강성 및 방습성이 중시되는 창고나 계약업체 현장에서 여전히 중요한 역할을 하고 있지만, 그 성장세는 LDPE 및 퇴비화 가능한 제품에 뒤처지고 있습니다. 캘리포니아주 법안 SB 1383 및 유사한 규제에 따라, 유기물 수거용 봉투는 ASTM D6400 또는 EN 13432 규격 준수가 법적으로 의무화되어 있기 때문에 생분해성 및 퇴비화 가능한 봉투는 제품 유형 중 가장 높은 연평균 성장률(CAGR) 7.12%를 나타낼 것으로 예측됩니다.
폴리젖산이나 전분 혼합 제품은 LDPE에 비해 50-80% 비싸지만, 규제가 시행되고 있는 관할 구역에서는 독점적으로 조달되고 있어 북미의 쓰레기 봉투 시장에서의 점유율을 꾸준히 확대되고 있습니다. 소매업체와 지자체가 환경 단체와 플라스틱 감축에 관한 협약을 체결함에 따라, 기존의 HDPE는 점차 시장 점유율이 줄어들고 있습니다. 그럼에도 불구하고 LDPE의 유연성, 밀봉 강도 및 비용 측면에서의 우위 덕분에 가정용 및 소규모 상업용 시장에서 주도적인 지위를 유지하고 있으며, 2031년까지 균형 잡히면서도 지속적으로 변화하는 제품 구성이 유지될 전망입니다.
기타 혜택 :
- 엑셀 형식 시장 예측(ME) 시트
- 3개월간의 애널리스트 지원
자주 묻는 질문
목차
제1장 서론
제2장 조사 방법
제3장 주요 요약
제4장 시장 구도
제5장 시장 규모 및 성장 예측
제6장 경쟁 구도
제7장 시장 기회 및 향후 전망
KTH 26.09.14According to Mordor Intelligence, the North America trash bags market size is projected to expand from USD 3.68 billion in 2025 and USD 3.92 billion in 2026 to USD 5.17 billion by 2031, registering a CAGR of 5.69% between 2026 to 2031.
This report is Segmented by End User (Residential, Commercial, and More), Product Type (Low-Density Polyethylene Bags, and More), Capacity (Less Than 8 Gal, 8-30 Gal, and More), Material Source (Virgin Plastic, Post-Consumer Recycled Plastic, Hybrid, and Bio-Based Resins), Sales Channel (Offline Retail, Online Retail, and More), and Geography. The Market Forecasts are Provided in Terms of Value (USD).
North America Trash Bags Market Trends and Insights
Residential Waste-Stream Expansion and State Landfill-Diversion Targets
Household waste in the United States reached 292 million tons in 2024, and population inflows into metropolitan areas are pushing per-capita disposal rates higher. California SB 1383 and comparable rules in New York and Massachusetts now obligate municipalities to collect organics separately, creating locked-in demand for ASTM D6400-compliant compostable liners. Municipal purchasing departments increasingly specify multi-layer bags with color cues that prevent cross-contamination during curbside pickup. Converters are answering with new coextrusion lines that embed pigment bands without compromising recyclability, a capital shift that favors incumbents already spending more than USD 5 million each year on R&D. As similar diversion targets propagate to Canadian provinces, the North America trash bags market gains a durable growth runway anchored in regulatory certainty.
Corporate Zero-Waste Pledges from Fortune 500 Facilities
More than 180 Fortune 500 companies now target TRUE or UL zero-waste certification, which requires diversion rates above 90% and segregation into at least five material streams. To streamline audits, plants are shifting to clear liners that let sorters verify contents without opening bags, cutting contamination and labor time at Procter and Gamble's Lima, Ohio, site by 12% in 2025. General Motors embedded RFID tags in 60-gallon translucent bags to trace waste back to production cells, enabling targeted operator training and fewer mis-sorted loads. Jan-san distributors report 20-30% price premiums for these feature-rich SKUs, creating margin headroom for converters that master additive dosing and inline printing. The expanding corporate pledge universe therefore secures a durable premium tier within the North America trash bags market.
Volatile Polyethylene and Bioplastic Feedstock Prices
LDPE spot prices swung between USD 0.52 and USD 0.68 per lb in 2025 after hurricane disruptions and cracker outages on the Gulf Coast. Without pass-through clauses, private-label converters absorb those spikes, eroding margins that typically run below 12%. Bioplastic inputs proved even choppier, with polylactic-acid resin climbing from USD 1.85 to USD 2.31 per lb as Midwest drought cut dextrose yields. Mid-tier firms now carry 60-90 days of inventory to hedge volatility, tying up working capital that could fund coextrusion upgrades or lab testing. Sudden cost jumps therefore sap near-term profitability across the North America trash bags market.
Other drivers and restraints analyzed in the detailed report include:
- Rapid E-Commerce Packaging Turnover Elevating Commercial Trash Volume
- Municipal Pay-As-You-Throw Programs Accelerating Bag Consumption
- Single-Use-Plastic Bans and Extended Producer Responsibility Laws
For complete list of drivers and restraints, kindly check the Table Of Contents.
Segment Analysis
The residential segment captured 45.67% of the North America trash bags market share in 2025, benefiting from widespread curbside programs that keep weekly kitchen-bag purchases steady. Industrial users are forecast to expand at a 6.03% CAGR through 2031, lifting their portion of the North America trash bags market size as federally funded bridge, road, and water-system upgrades create debris streams that require heavy-duty liners. Contractors specify 30-55 gallon bags engineered to resist puncture forces above 400 psi, and procurement teams pay premiums of 25-35% for products verified to ASTM performance standards. Commercial offices, retail locations, and hospitality venues accounted for roughly 32% of 2025 volume, with occupancy rebounding to 68% and supporting demand for janitorial liners that often feature antimicrobial additives.
Foodservice operators within the commercial bracket favor bags certified to NSF antimicrobial protocols, a niche that drew USD 18 million in venture funding during 2025. Industrial facilities also turn to transparent liners embedded with RFID tags so zero-waste auditors can trace contamination to specific workcells, an innovation that secures long-term contracts despite price premiums. Residential demand remains stable yet faces gradual substitution from reusable containers distributed under city give-away schemes. Overall, the industrial end user is set to contribute the largest incremental revenue to the North America trash bags market size over the forecast horizon.
Low-density polyethylene (LDPE) retained 41.23% of 2025 sales, sustained by tooling familiarity and the ability to incorporate up to 40% post-consumer resin without gauge drift. High-density polyethylene (HDPE) maintains relevance in warehouse and contractor settings where stiffness and moisture barriers are prized, but its advance lags LDPE and compostables. Biodegradable and compostable liners are projected to grow at a 7.12% CAGR, the fastest among product types, as California SB 1383 and similar rules legally obligate organics-collection bags to meet ASTM D6400 or EN 13432 standards.
Polylactic acid and starch-blend formulations cost 50-80% more than LDPE yet enjoy captive purchasing in regulated jurisdictions, steadily enlarging their slice of the North America trash bags market share. Conventional HDPE faces incremental erosion where retailers and municipalities forge plastic-reduction agreements with environmental groups. Still, LDPE's flexibility, seal strength, and cost advantage preserve its leadership in household and light-commercial channels, ensuring a balanced but shifting product-type mix through 2031.
Complete Report Scope:
- By End User
- Residential
- Commercial
- Industrial
- By Product Type
- Low-Density Polyethylene (LDPE) Bags
- High-Density Polyethylene (HDPE) Bags
- Biodegradable and Compostable Bags
- By Capacity (Gallons)
- Less than 8 Gal (Bathroom)
- 8 - 30 Gal (Kitchen)
- 30 - 55 Gal (Contractor)
- Above 55 Gal (Industrial Drum Liners)
- By Material Source
- Virgin Plastic
- Post-Consumer Recycled Plastic
- Hybrid (Recycled + Virgin)
- Bio-Based Resins
- By Sales Channel
- Offline Retail (Grocery, Mass Merchandiser)
- Online Retail
- Jan-San and Institutional Distribution
- By Country
- United States
- Canada
- Mexico
List of Companies Covered in this Report:
- Reynolds Consumer Products Inc. (Hefty)
- The Clorox Company (Glad Products Company)
- Novolex Holdings LLC
- Inteplast Group Corporation
- Riverside Paper Co. Inc.
- Cosmoplast Industrial Company LLC
- International Plastics Inc.
- Poly-America L.P.
- Four Star Plastics Inc.
- Neway Packaging Corporation
- All American Poly Corp.
- Aluf Plastics Inc.
- Petoskey Plastics Inc.
- Heritage Bag Company
- Crown Poly Inc.
- WasteZero Inc.
- Matrix Packaging LLC
- Elkay Plastics Co. Inc.
- Interplast Packaging LLC
- Super Bag Corp.
- RollPak Corp.
- Boulder Bag Company
Additional Benefits:
- The market estimate (ME) sheet in Excel format
- 3 months of analyst support
TABLE OF CONTENTS
1 INTRODUCTION
- 1.1 Study Assumptions and Market Definition
- 1.2 Scope of the Study
2 RESEARCH METHODOLOGY
3 EXECUTIVE SUMMARY
4 MARKET LANDSCAPE
- 4.1 Market Overview
- 4.2 Market Drivers
- 4.2.1 Residential Waste-Stream Expansion and State Landfill-Diversion Targets
- 4.2.2 Corporate Zero-Waste Pledges from Fortune 500 Facilities
- 4.2.3 Rapid E-Commerce Packaging Turnover Elevating Commercial Trash Volume
- 4.2.4 Municipal Pay-As-You-Throw (PAYT) Programs Accelerating Bag Consumption
- 4.2.5 High-Clarity, Recycled-Content Resins Enabling Premium Pricing
- 4.2.6 Adoption of Anti-Microbial Liners in Healthcare and Foodservice
- 4.3 Market Restraints
- 4.3.1 Volatile Polyethylene and Bioplastic Feedstock Prices
- 4.3.2 Single-Use-Plastic Bans and Extended-Producer-Responsibility (EPR) Laws
- 4.3.3 Retail SKU Cannibalization from Reusable Tote Initiatives
- 4.3.4 Logistics Emissions Scrutiny Curbing Import of Low-Grade Liners
- 4.4 Industry Value Chain Analysis
- 4.5 Regulatory Landscape
- 4.6 Technological Outlook
- 4.7 Impact of Macroeconomic Factors on the Market
- 4.8 Porter's Five Forces Analysis
- 4.8.1 Bargaining Power of Suppliers
- 4.8.2 Bargaining Power of Buyers
- 4.8.3 Threat of New Entrants
- 4.8.4 Threat of Substitutes
- 4.8.5 Intensity of Competitive Rivalry
- 4.9 Fragrance and Additive Formulation Trends
5 MARKET SIZE AND GROWTH FORECASTS (VALUE)
- 5.1 By End User
- 5.1.1 Residential
- 5.1.2 Commercial
- 5.1.3 Industrial
- 5.2 By Product Type
- 5.2.1 Low-Density Polyethylene (LDPE) Bags
- 5.2.2 High-Density Polyethylene (HDPE) Bags
- 5.2.3 Biodegradable and Compostable Bags
- 5.3 By Capacity (Gallons)
- 5.3.1 Less than 8 Gal (Bathroom)
- 5.3.2 8 - 30 Gal (Kitchen)
- 5.3.3 30 - 55 Gal (Contractor)
- 5.3.4 Above 55 Gal (Industrial Drum Liners)
- 5.4 By Material Source
- 5.4.1 Virgin Plastic
- 5.4.2 Post-Consumer Recycled Plastic
- 5.4.3 Hybrid (Recycled + Virgin)
- 5.4.4 Bio-Based Resins
- 5.5 By Sales Channel
- 5.5.1 Offline Retail (Grocery, Mass Merchandiser)
- 5.5.2 Online Retail
- 5.5.3 Jan-San and Institutional Distribution
- 5.6 By Country
- 5.6.1 United States
- 5.6.2 Canada
- 5.6.3 Mexico
6 COMPETITIVE LANDSCAPE
- 6.1 Market Concentration
- 6.2 Strategic Moves
- 6.3 Market Share Analysis
- 6.4 Company Profiles (includes Global Level Overview, Market Level Overview, Core Segments, Financials as available, Strategic Information, Market Rank/Share, Products and Services, Recent Developments)
- 6.4.1 Reynolds Consumer Products Inc. (Hefty)
- 6.4.2 The Clorox Company (Glad Products Company)
- 6.4.3 Novolex Holdings LLC
- 6.4.4 Inteplast Group Corporation
- 6.4.5 Riverside Paper Co. Inc.
- 6.4.6 Cosmoplast Industrial Company LLC
- 6.4.7 International Plastics Inc.
- 6.4.8 Poly-America L.P.
- 6.4.9 Four Star Plastics Inc.
- 6.4.10 Neway Packaging Corporation
- 6.4.11 All American Poly Corp.
- 6.4.12 Aluf Plastics Inc.
- 6.4.13 Petoskey Plastics Inc.
- 6.4.14 Heritage Bag Company
- 6.4.15 Crown Poly Inc.
- 6.4.16 WasteZero Inc.
- 6.4.17 Matrix Packaging LLC
- 6.4.18 Elkay Plastics Co. Inc.
- 6.4.19 Interplast Packaging LLC
- 6.4.20 Super Bag Corp.
- 6.4.21 RollPak Corp.
- 6.4.22 Boulder Bag Company
7 MARKET OPPORTUNITIES AND FUTURE OUTLOOK
- 7.1 White-Space and Unmet-Need Assessment


