

|
시장보고서
상품코드
2154295
CNG차 : 시장 점유율 분석, 업계 동향과 통계, 성장 예측(2026-2031년)CNG Vehicles - Market Share Analysis, Industry Trends & Statistics, Growth Forecasts (2026 - 2031) |
||||||
 Mordor Intelligence
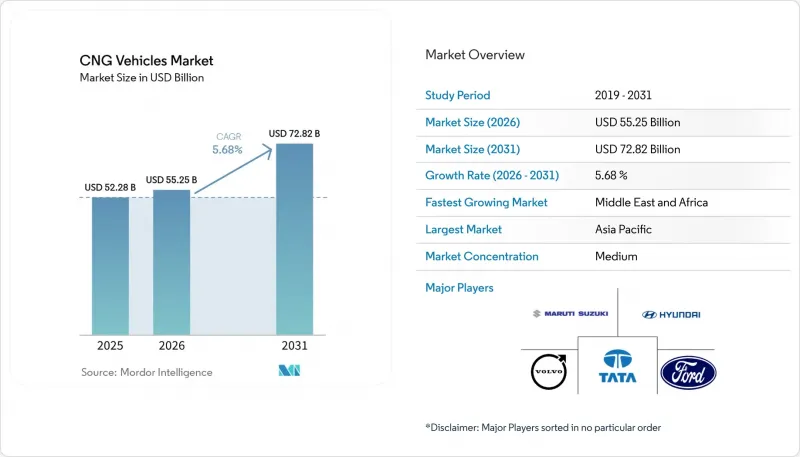
에 따르면 CNG차 시장 규모는 2025년에 522억 8,000만 달러로 평가되며, 2026년에는 552억 5,000만 달러로 추정되고 있으며, 예측 기간(2026-2031년)에 CAGR 5.68%로 추이하며, 2031년까지 728억 2,000만 달러에 달할 것으로 전망되고 있습니다.
세계 CNG 자동차 시장의 동향 및 인사이트
가솔린이나 디젤에 비해 총 소유 비용이 낮음
연료 가격 차이가 확대되고 있으며, 엔진 수명 연장을 보여주는 정비 분석 결과에 따라 차량 운용 측면에서의 경제성이 압축천연가스(CNG) 도입을 더욱 촉진하고 있습니다. 사업자들로부터는 디젤에 비해 30%에서 40%의 연료비 절감을 달성했을 뿐만 아니라, 파워트레인의 수명이 약 15%에서 25% 연장되었다는 보고가 있습니다. 이러한 이점은 소포 배송 서비스나 시내버스 운행 등 가동률이 높은 용도에서 특히 두드러집니다. 텔레매틱스 플랫폼은 마일당 비용에 관한 포괄적인 데이터를 제공하여, 차량 관리자가 연료 전략을 보다 정확하게 평가하고 최적화할 수 있도록 지원합니다. 입증된 비용 절감 효과는 총 운영비 절감을 목표로 하는 재무 목표와 밀접하게 연계되어 있습니다. 또한 조달 방침에는 미리 정의된 연료 가격 차이의 임계값에 기반한 CNG 도입 조건이 점점 더 많이 반영되고 있으며, 이를 통해 향후 수요 계획 프로세스가 체계화되고 효율화되고 있습니다.
엄격한 배기가스 규제
유럽 및 북미의 새로운 규제로 인해 질소산화물(NOx) 및 미세먼지 배출량에 대해 더욱 엄격한 제한이 도입됨에 따라 고가의 후처리 시스템을 도입하지 않고 규제를 준수하는 것은 디젤 엔진에 있으며, 큰 과제가 되고 있습니다. 이에 비해, 압축 천연가스(CNG) 파워트레인은 이러한 규제 기준의 상당 부분을 충족할 수 있으며, 차량 운영자에게 실용적이고 비용 효율적인 규정 준수 솔루션을 제공합니다. 인도에서는 BS VI 기준 도입으로 인해 18개월 동안 CNG 차량 등록 대수가 40%라는 놀라운 증가세를 보였습니다. 마찬가지로 미국 환경보호청(EPA)의 3단계 규정에 따른 클래스 8 트럭에 대한 향후 규제 요건도 구매 전 수요 증가를 촉진하고 있습니다. 이러한 규제 환경은 자동차 제조사(OEM)가 CNG 차량 라인업을 확대하도록 촉진하는 요인이 되고 있습니다. 이러한 동향들이 맞물리면서, 전동화 기술의 광범위한 보급이 예상되기 전에 정책 주도형 CNG 차량 수요 증가가 나타나고 있습니다.
주요 50대 대도시권 이외의 농촌 지역에서 충전소 밀도가 낮은 점
충전소 구축은 여전히 도시 지역에 집중되어 있습니다. 이는 지방 시장의 평균 처리량이 각 거점에 필요한 설비 투자를 정당화하기 어려운 경우가 많기 때문입니다. 광범위한 노선을 운행하는 플릿는 주행 거리에 대한 불안으로 인한 비용과 연료비 절감 효과를 빈번히 비교 검토하고 있으며, 그 결과 압축천연가스(CNG)로의 전환이 지연되는 경우가 많습니다. 민관 보조금을 통한 재정 지원이 있기는 하지만, 일반적으로 프로젝트 비용의 20-30%밖에 충당하지 못해 이러한 프로젝트의 재정적 실현 가능성은 여전히 불투명합니다. 이동식 압축 장치 및 차량 탑재형 저장 기술의 발전은 이러한 과제를 해결하기 위한 부분적인 해결책을 제시하고 있지만, 고밀도의 고정식 충전소 네트워크의 필요성을 완전히 대체할 수는 없습니다. 이러한 상황으로 인해 CNG 인프라 도입에 있으며, 지역적 격차가 발생하고 있으며, 이는 계속해서 이 시장의 전국적인 포괄적 성장 가능성을 저해하고 있습니다.
부문 분석
2025년, 승용차는 CNG 차량 시장에서 64.48%라는 압도적인 점유율을 차지하며 판매 대수 면에서 확고한 우위를 다졌습니다. 그러나 성장의 기세는 상용차 쪽으로 이동하고 있습니다. 버스 및 장거리 버스는 2031년까지 연평균 성장률(CAGR)이 9.14%에 달할 것으로 예측되며, 가장 빠르게 성장하는 부문이 될 전망입니다. 이러한 성장은 완전한 전기화에 수반되는 복잡성을 피하면서 즉각적인 배기가스 감축을 목표로 하는 대중교통 기관의 노력에 크게 기인합니다. 트럭은 특히 고출력 충전소가 부족한 지역에서 장거리 노선을 중심으로 여전히 지배적인 위치를 차지하고 있습니다. 동시에, 연료 가격이 소비자의 선택에 큰 영향을 미치는 남아시아에서는 이륜차 및 삼륜차 수요가 확대되고 있습니다.
소형 상용차는 전략적인 위치를 차지하고 있으며, 배터리 주행 거리 한계를 보완하는 형태로 도시내 배송에서 CNG의 신뢰성을 활용하고 있습니다. 2031년까지 CNG 버스 시장 규모는 공공 투자를 통해 차량 조달 주기가 활성화됨에 따라 거의 두 배로 증가할 것으로 예상됩니다. 기술 로드맵에는 현재 수소 대응 개조가 포함되어 있으며, 이를 통해 각 기관은 멀티퓨얼 대응 수명 기간 중 섀시의 감가상각 기간을 연장할 수 있게 되었습니다. 승용차 분야에서는 각 OEM 업체들이 가격 차이를 최소화한 바이퓨얼 사양 차량을 출시하고 있으며, 부유한 대도시권에서 배터리식 전기자동차의 점유율이 확대되는 상황 속에서도 안정적인 수요를 확보하고 있습니다.
2025년에는 OEM에 의한 통합이 CNG 차량 시장을 휩쓸며 75.74%의 점유율을 차지했습니다. 이러한 동향은 차량 플릿 및 소비자들 사이에서 공장에서 정교하게 설계된 파워트레인이 명확히 선호되고 있음을 보여줍니다. 공장 출고시 기본 사양 모델을 선택하는 것은 보증 관리를 효율화할 뿐만 아니라, 금융 기관의 경우 잔존 가치를 보다 명확하게 예측할 수 있게 하여 더욱 경쟁력 있는 리스 요율을 실현합니다. 자동차 제조사 입장에서는 이를 통해 인젝터, 실린더, 제어 장치 등 주요 부품에 대한 안정적인 수요가 창출됩니다. 이러한 수요의 예측 가능성 덕분에 대량 발주가 가능해져 부품 비용을 효과적으로 절감할 수 있습니다. 마케팅 전략에서는 공인 정비소에서 정비받을 수 있는 편의성을 강조하며, 출고시 기본 사양으로 장착된 CNG 차량을 기존 가솔린 차량을 대체할 수 있는 원활한 선택지로 포지셔닝하고 있습니다. 이러한 접근 방식은 업계 전반의 기준을 높이고, 구매자의 기대치를 향상시키는 결과로 이어집니다.
한편, 사후 개조된 차량군은 연평균 성장률(CAGR) 8.21%로 확대될 것으로 예측됩니다. 개조 키트는 자산의 수명을 연장할 뿐만 아니라, 점점 엄격해지는 배기가스 규제를 준수할 수 있도록 보장합니다. 또한 딜러가 장착하는 장비의 인증과 3년간의 엔진 보증을 통해 그동안 애프터마켓 성장을 저해해 온 신뢰성 관련 우려가 해소되고 있습니다. 표준화된 설치 절차로 가동 중단 시간을 최소화함으로써, 소규모 사업자도 장기간 정비소에 차량을 맡길 필요 없이 정기 점검시 차량을 개조할 수 있게 됩니다. 지역적으로는 CNG 충전소 밀도에 맞춰 개조 사업이 전개되고 있습니다. 초기 도입은 CNG 회랑이 확립된 주에 중점을 두고 있으며, 전국적인 확대를 위한 기반이 마련되었습니다. 그 결과, 개조는 틈새 시장 솔루션에서 기존 차량 환경을 활용한 중요한 성장 분야로 진화하고 있습니다.
지역별 분석
아시아태평양이 시장을 주도하며 수익에 크게 기여하고 있습니다. 인도의 정책 체계(차량 인센티브, 충전소 보조금, 규제 일정 등) 덕분에 도시 간 버스나 라이드셰어용 세단에게 CNG 회랑이 최적의 선택지로 자리 잡고 있습니다. 중국에서는 배터리 충전이 여전히 경제적으로 실현 불가능한 내륙 성에서 상용차 차량군을 대상으로 CNG가 우선적으로 채택되고 있습니다. 일본은 미래의 연료 전환에 대비하기 위한 전략적 선택지로 수소 대응이 가능한 CNG 구동 시스템을 추진하고 있습니다. 인젝터나 실린더 등의 부품을 포함한 지역 OEM 공급망은 비용 절감을 위해 현지화가 진행되고 있으며, 이를 통해 주요 도시 이외 지역에서의 CNG 도입이 촉진되고 있습니다.
중동 및 아프리카는 가스 자원이 풍부한 국가들이 휘발유 수입 감축과 국내 가스 매장량 활용을 위해 CNG를 활용하고 있으며, 연평균 성장률(CAGR) 7.28%로 세계에서 가장 빠른 성장을 달성하고 있습니다. 나이지리아의 ‘대통령 주도 CNG 구상’에서는 우대 대출과 세제 혜택을 결합하여 버스 차량의 CNG 전환을 추진하고 있습니다. 아랍에미리트(UAE)는 LNG 인프라를 활용하여 천연가스, 수소, 전기자동차(EV) 충전을 통합한 다중 연료 서비스 허브를 개발함으로써 물류 회랑의 장기적인 지속가능성을 확보하고 있습니다. 그러나 농촌 지역에서는 보급률이 제한적이기 때문에 라스트 마일 도입을 가능하게 할 이동식 급유 솔루션이 필요합니다.
유럽과 북미에서는 꾸준한 성장세를 보이고 있습니다. 차량의 전동화가 진행되는 가운데서도 엄격한 배기가스 규제와 바이오메탄 도입 의무로 인해 CNG의 환경적 매력이 높아지고 있습니다. 미국에서는 700곳 이상의 공공 충전소가 전미 횡단 화물 운송을 지원하고 있는 반면, EPA 3단계 규제로 인해 디젤 차량에 대한 규제 준수 압박이 강화되고 있습니다. 유럽에서는 트럭 제조사들이 연료 시스템 전문 기업과 제휴하여 고압 직접 분사(HPDI) 기술 도입을 추진하고 있습니다. 이를 통해 디젤 차량과 동등한 토크 성능을 유지하면서 메탄 배출량을 줄이고 있습니다. 이러한 동향의 대표적인 사례로 볼보 그룹과 웨스트포트사의 제휴를 들 수 있습니다.
기타 혜택:
- 엑셀 형식의 시장 예측(ME) 시트
- 3개월간의 애널리스트 지원
자주 묻는 질문
목차
제1장 서론
- 조사 전제조건과 시장 정의
- 조사 범위
제2장 조사 방법
제3장 개요
제4장 시장 구도
- 시장 개요
- 시장 성장 촉진요인
- 시장 성장 억제요인
- 밸류·공급망 분석
- 규제 상황
- 기술 전망
- Porter's Five Forces 분석
제5장 시장 규모와 성장 예측
- 차종별
- 판매 채널별
- 최종 용도별
- 실린더 유형별
- 지역별
- 북미
- 미국
- 캐나다
- 기타 북미 국가
- 남미
- 브라질
- 아르헨티나
- 콜롬비아
- 기타 남미 국가
- 유럽
- 독일
- 영국
- 프랑스
- 이탈리아
- 스페인
- 러시아
- 기타 유럽 국가
- 아시아태평양
- 중국
- 인도
- 일본
- 한국
- 인도네시아
- 태국
- 기타 아시아태평양 국가
- 중동 및 아프리카
- 튀르키예
- 사우디아라비아
- 아랍에미리트
- 카타르
- 남아프리카공화국
- 나이지리아
- 이집트
- 케냐
- 기타 중동 및 아프리카 국가
- 북미
제6장 경쟁 구도
- 시장 집중도
- 전략적 동향
- 시장 점유율 분석
- 기업 개요
- Suzuki Motor Corp
- Hyundai Motor Co
- Tata Motors Limited
- AB Volvo Group
- CNH Industrial(Iveco)
- General Motors
- Ford Motor Company
- MAN Truck and Bus SE
- Scania AB
- Ashok Leyland Ltd.
- Isuzu Motors Ltd.
- Westport Fuel Systems Inc.
- Landi Renzo SpA
- Hexagon Composites ASA
- Everest Kanto Cylinders Ltd.
제7장 시장 기회와 향후 전망
KSAAccording to Mordor Intelligence, the CNG vehicles market size was valued at USD 52.28 billion in 2025 and is estimated at USD 55.25 billion in 2026, and is projected to reach USD 72.82 billion by 2031, at a CAGR of 5.68% during the forecast period (2026-2031).
Global CNG Vehicles Market Trends and Insights
Lower Total Cost-of-Ownership Versus Gasoline and Diesel
Fleet economics increasingly support the adoption of compressed natural gas (CNG) due to the widening of pump price spreads and maintenance analytics that demonstrate improvements in engine longevity. Operators have reported achieving fuel cost savings ranging from 30% to 40% when compared to diesel, along with powertrain lifespan extensions of approximately 15% to 25%. These benefits are particularly significant in high-utilization applications, including parcel delivery services and urban bus operations. Telematics platforms provide comprehensive cost-per-mile data, enabling fleet managers to evaluate and optimize fuel strategies with greater accuracy. Verified cost savings align closely with financial objectives aimed at reducing overall operating expenses. Additionally, procurement policies are increasingly incorporating CNG adoption triggers that are based on predefined fuel-spread thresholds, thereby formalizing and streamlining future demand planning processes.
Stringent Tail-Pipe Emission Regulations
New regulations in Europe and North America have introduced stricter limits on nitrogen oxide (NOx) and particulate emissions, creating significant challenges for diesel engines to achieve compliance without the incorporation of expensive after-treatment systems. In comparison, compressed natural gas (CNG) powertrains are capable of meeting many of these regulatory standards, providing fleet operators with a practical and cost-effective compliance solution. In India, the implementation of BS VI standards resulted in a notable 40% increase in CNG vehicle registrations over a period of 18 months. Similarly, the forthcoming compliance requirements for U.S. Class-8 trucks under the Environmental Protection Agency (EPA) Phase 3 rules are driving increased pre-purchase activity. This regulatory environment is also encouraging original equipment manufacturers (OEMs) to expand their CNG vehicle offerings. These developments have collectively contributed to a policy-driven increase in demand for CNG vehicles, occurring in advance of the anticipated widespread adoption of electrification technologies.
Sparse Rural Station Density Outside Top 50 Metro Areas
Station development remains concentrated in urban areas, as the average throughput in rural markets often fails to justify the capital investment required for each site. Fleets operating across extensive routes frequently evaluate the costs associated with range anxiety in comparison to potential fuel savings, which often results in delays in adopting compressed natural gas (CNG) conversions. Although public-private grants provide some financial assistance, they typically cover only 20 to 30% of project costs, leaving the financial feasibility of such projects uncertain. Portable compression units and advancements in on-vehicle storage technologies offer partial solutions to address these challenges but cannot fully replace the need for a dense and fixed station network. This situation has created a geographic disparity in the adoption of CNG infrastructure, which continues to hinder the potential for comprehensive national growth in this market.
Other drivers and restraints analyzed in the detailed report include:
- Expanding CNG Refueling Infrastructure and OEM-Backed Warranty
- Renewable Natural Gas Blending Targets in the EU and California
- Rapidly Falling Battery-Electric TCO in Light-Duty Segment
For complete list of drivers and restraints, kindly check the Table Of Contents.
Segment Analysis
In 2025, passenger cars held a dominant 64.48% share of the CNG vehicle market, solidifying their lead in unit sales. However, the growth trajectory is shifting towards commercial vehicles. Buses and coaches are set to be the fastest-growing segment, with a projected CAGR of 9.14% through 2031. This growth is largely attributed to public transit authorities seeking immediate emission reductions while avoiding the complexities of full electrification. Trucks continue to dominate long-haul routes, particularly in areas lacking high-power charging stations. Simultaneously, two- and three-wheelers are experiencing growth in South Asia, where fuel prices significantly influence consumer choices.
Light commercial vehicles occupy a strategic position, leveraging CNG's reliability for urban deliveries, which is advantageous given battery range constraints. By 2031, the market size for CNG buses is expected to nearly double, driven by public investments unlocking fleet procurement cycles. Technology roadmaps are now incorporating hydrogen-ready modifications, enabling agencies to extend chassis amortization over multi-fuel lifetimes. On the passenger front, OEMs are introducing bi-fuel variants at minimal price premiums, ensuring steady demand even as battery-electric vehicles gain a larger share in affluent metropolitan areas.
In 2025, OEM integration dominated the CNG vehicle market, capturing a 75.74% share. This trend highlights a clear preference among fleets and consumers for powertrains meticulously engineered at the factory. Opting for factory-fitted models not only streamlines warranty management but also provides financiers with enhanced clarity on residual-value projections, enabling more competitive lease rates. For automakers, this results in consistent demand for essential components such as injectors, cylinders, and control units. Such predictability facilitates volume contracts, effectively reducing component costs. Marketing strategies emphasize the convenience of servicing at authorized workshops, positioning factory-fitted CNGs as a seamless alternative to traditional gasoline. This approach collectively raises industry standards, shaping elevated buyer expectations.
Conversely, retrofitted fleets are projected to grow at a CAGR of 8.21%. Conversion kits not only extend asset life but also ensure compliance with tightening emission regulations. Additionally, certifications for dealer-installed equipment and three-year engine warranties address reliability concerns that previously hindered aftermarket growth. Standardized installation protocols minimize downtime, allowing smaller operators to convert vehicles during routine maintenance rather than extended shop stays. Geographically, retrofitting initiatives are being rolled out in alignment with station density. Initial availability is focused on states with established CNG corridors, paving the way for broader national expansion. As a result, retrofitting is evolving from a niche solution into a significant growth avenue, leveraging the existing vehicle landscape.
Complete Report Scope:
- By Vehicle Type
- Passenger Cars
- Light Commercial Vehicles
- Buses and Coaches
- Trucks (Medium and Heavy-Duty)
- Two and Three-Wheelers
- By Sales Channel
- OEM-fitted
- Retrofitted/ After-market
- By End-use Application
- Private/Personal Use
- Taxi and Ride-hailing Fleets
- Public Transit Authorities
- Industrial and Utility Fleets
- By Cylinder Type
- Type I (All-metal)
- Type II (Metal hoop-wrapped)
- Type III (Full composite)
- Type IV (Polymer-liner composite)
- By Geography
- North America
- United States
- Canada
- Rest of North America
- South America
- Brazil
- Argentina
- Colombia
- Rest of South America
- Europe
- Germany
- United Kingdom
- France
- Italy
- Spain
- Russia
- Rest of Europe
- Asia-Pacific
- China
- India
- Japan
- South Korea
- Indonesia
- Thailand
- Rest of Asia-Pacific
- Middle East and Africa
- Turkey
- Saudi Arabia
- United Arab Emirates
- Qatar
- South Africa
- Nigeria
- Egypt
- Kenya
- Rest of Middle East and Africa
- North America
Geography Analysis
Asia-Pacific leads the market, contributing significantly to revenues. India's policy framework, including vehicle incentives, station grants, and regulatory timelines, has established CNG corridors as the preferred option for intercity buses and ride-share sedans. In China, CNG is prioritized for commercial fleets in inland provinces where battery charging remains economically unviable. Japan promotes hydrogen-ready CNG drivelines as a strategic option to adapt to future fuel transitions. Regional OEM supply chains, encompassing components such as injectors and cylinders, are localized to reduce costs, facilitating CNG adoption beyond tier-one cities.
The Middle East and Africa region is experiencing the fastest growth globally, with a CAGR of 7.28%, as gas-rich countries utilize CNG to reduce gasoline imports and capitalize on domestic gas reserves. Nigeria's Presidential CNG Initiative combines concessional loans with tax incentives to drive bus-fleet conversions. The UAE leverages its LNG infrastructure to develop multi-fuel service hubs integrating natural gas, hydrogen, and EV charging, positioning logistics corridors for long-term sustainability. However, rural areas face limited penetration, necessitating mobile refueling solutions to enable last-mile adoption.
Europe and North America exhibit steady growth trajectories. Strict emission regulations and biomethane mandates enhance CNG's environmental appeal, even as fleet electrification gains traction. In the United States, over 700 public stations support coast-to-coast freight operations, while EPA Phase 3 regulations increase compliance pressures on diesel fleets. In Europe, truck OEMs collaborate with fuel-system specialists to implement high-pressure direct-injection (HPDI) technologies, reducing methane emissions while maintaining diesel-like torque performance. This trend is exemplified by Volvo Group's partnership with Westport.
- Suzuki Motor Corp
- Hyundai Motor Co
- Tata Motors Limited
- AB Volvo Group
- CNH Industrial (Iveco)
- General Motors
- Ford Motor Company
- MAN Truck and Bus SE
- Scania AB
- Ashok Leyland Ltd.
- Isuzu Motors Ltd.
- Westport Fuel Systems Inc.
- Landi Renzo SpA
- Hexagon Composites ASA
- Everest Kanto Cylinders Ltd.
Additional Benefits:
- The market estimate (ME) sheet in Excel format
- 3 months of analyst support
TABLE OF CONTENTS
1 Introduction
- 1.1 Study Assumptions and Market Definition
- 1.2 Scope of the Study
2 Research Methodology
3 Executive Summary
4 Market Landscape
- 4.1 Market Overview
- 4.2 Market Drivers
- 4.2.1 Lower Total Cost-of-Ownership Versus Gasoline and Diesel
- 4.2.2 Stringent Tail-Pipe Emission Regulations (Euro 6/7, CAFE, BS VI)
- 4.2.3 Expanding CNG Refueling Infrastructure and OEM-Backed Warranty
- 4.2.4 Renewable Natural Gas (Bio-CNG) Blending Targets in EU and California
- 4.2.5 Fleet-Wide Telematics Proving Double-Digit Maintenance Savings
- 4.2.6 Hydrogen-Ready CNG Engine Platforms Announced 2025-27
- 4.3 Market Restraints
- 4.3.1 Sparse Rural Station Density Outside Top 50 Metro Areas
- 4.3.2 Rapidly Falling Battery-Electric TCO In Light-Duty Segment
- 4.3.3 Methane-Slip Compliance Risk Under Forthcoming EPA Rules
- 4.3.4 Volatile Global LNG/CNG Commodity Pricing Since 2022
- 4.4 Value/Supply-Chain Analysis
- 4.5 Regulatory Landscape
- 4.6 Technological Outlook
- 4.7 Porter's Five Forces Analysis
- 4.7.1 Threat of New Entrants
- 4.7.2 Bargaining Power of Suppliers
- 4.7.3 Bargaining Power of Buyers
- 4.7.4 Threat of Substitutes
- 4.7.5 Intensity of Competitive Rivalry
5 Market Size and Growth Forecasts (Value (USD) and Volume (Units))
- 5.1 By Vehicle Type
- 5.1.1 Passenger Cars
- 5.1.2 Light Commercial Vehicles
- 5.1.3 Buses and Coaches
- 5.1.4 Trucks (Medium and Heavy-Duty)
- 5.1.5 Two and Three-Wheelers
- 5.2 By Sales Channel
- 5.2.1 OEM-fitted
- 5.2.2 Retrofitted/ After-market
- 5.3 By End-use Application
- 5.3.1 Private/Personal Use
- 5.3.2 Taxi and Ride-hailing Fleets
- 5.3.3 Public Transit Authorities
- 5.3.4 Industrial and Utility Fleets
- 5.4 By Cylinder Type
- 5.4.1 Type I (All-metal)
- 5.4.2 Type II (Metal hoop-wrapped)
- 5.4.3 Type III (Full composite)
- 5.4.4 Type IV (Polymer-liner composite)
- 5.5 By Geography
- 5.5.1 North America
- 5.5.1.1 United States
- 5.5.1.2 Canada
- 5.5.1.3 Rest of North America
- 5.5.2 South America
- 5.5.2.1 Brazil
- 5.5.2.2 Argentina
- 5.5.2.3 Colombia
- 5.5.2.4 Rest of South America
- 5.5.3 Europe
- 5.5.3.1 Germany
- 5.5.3.2 United Kingdom
- 5.5.3.3 France
- 5.5.3.4 Italy
- 5.5.3.5 Spain
- 5.5.3.6 Russia
- 5.5.3.7 Rest of Europe
- 5.5.4 Asia-Pacific
- 5.5.4.1 China
- 5.5.4.2 India
- 5.5.4.3 Japan
- 5.5.4.4 South Korea
- 5.5.4.5 Indonesia
- 5.5.4.6 Thailand
- 5.5.4.7 Rest of Asia-Pacific
- 5.5.5 Middle East and Africa
- 5.5.5.1 Turkey
- 5.5.5.2 Saudi Arabia
- 5.5.5.3 United Arab Emirates
- 5.5.5.4 Qatar
- 5.5.5.5 South Africa
- 5.5.5.6 Nigeria
- 5.5.5.7 Egypt
- 5.5.5.8 Kenya
- 5.5.5.9 Rest of Middle East and Africa
- 5.5.1 North America
6 Competitive Landscape
- 6.1 Market Concentration
- 6.2 Strategic Moves
- 6.3 Market Share Analysis
- 6.4 Company Profiles (Includes Global level Overview, Market level overview, Core Segments, Financials as available, Strategic Information, Market Rank/Share, Products and Services, Recent Developments)
- 6.4.1 Suzuki Motor Corp
- 6.4.2 Hyundai Motor Co
- 6.4.3 Tata Motors Limited
- 6.4.4 AB Volvo Group
- 6.4.5 CNH Industrial (Iveco)
- 6.4.6 General Motors
- 6.4.7 Ford Motor Company
- 6.4.8 MAN Truck and Bus SE
- 6.4.9 Scania AB
- 6.4.10 Ashok Leyland Ltd.
- 6.4.11 Isuzu Motors Ltd.
- 6.4.12 Westport Fuel Systems Inc.
- 6.4.13 Landi Renzo SpA
- 6.4.14 Hexagon Composites ASA
- 6.4.15 Everest Kanto Cylinders Ltd.
7 Market Opportunities and Future Outlook
- 7.1 White-space and Unmet-need Assessment


