

|
시장보고서
상품코드
2154880
남미의 몰입형 엔터테인먼트 : 시장 점유율 분석, 업계 동향과 통계, 성장 예측(2026-2031년)South America Immersive Entertainment - Market Share Analysis, Industry Trends & Statistics, Growth Forecasts (2026 - 2031) |
||||||
 Mordor Intelligence
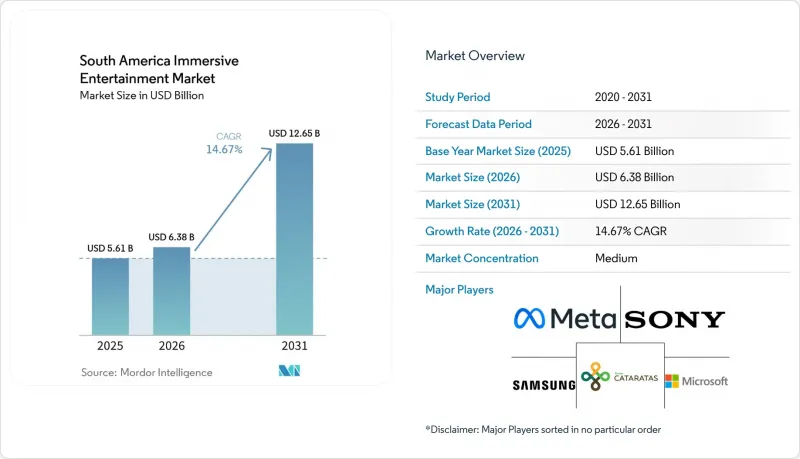
에 따르면 남미의 몰입형 엔터테인먼트 시장 규모는 2025년에 56억 1,000만 달러, 2026년에 63억 8,000만 달러로 평가되어 예측 기간(2026-2031년)에 CAGR 14.67%로 추이하며, 2031년까지 126억 5,000만 달러에 달할 것으로 전망되고 있습니다.
남미 몰입형 엔터테인먼트 시장의 동향 및 인사이트
쇼핑몰내 위치 기반 엔터테인먼트의 확대
E-Commerce의 부상으로 오프라인 매장의 역할이 변화하는 가운데, 쇼핑몰에서는 비어 있는 소매 공간을 엔터테인먼트 공간으로 전환하고 있습니다. 이로 인해 접근성이 좋은 도심 입지와 예측 가능한 방문객 수를 필요로 하는 사업자들에게 진입 장벽이 낮아지고 있습니다. 상파울루, 부에노스아이레스, 산티아고의 쇼핑몰 소유주들은 엔터테인먼트 입점 업체에 수익 분배형 임대 계약 및 인테리어 공사 지원을 제공하고 있습니다. 이러한 협약을 통해 중규모 몰입형 시설의 초기 투자 부담이 경감되고 있습니다. 2026년, 사업자들은 계속해서 쇼핑몰내 입지를 활용하여 멀티플레이어 체험이나 혼합현실(MR) 체험을 제공하고 있으며, 많은 경우 기존 영화관이나 음식점에서 유입된 고객과의 시너지 효과를 창출하고 있습니다. 쇼핑몰이 몰입형 시설을 단순히 빈 공간의 일시적인 이용자가 아닌, 방문객을 유치하는 핵심 시설로 자리매김함에 따라 남미의 몰입형 엔터테인먼트 시장은 그 혜택을 누리고 있습니다.
VR 아케이드와 가족 엔터테인먼트 센터의 성장
VR 아케이드는 체험 중심의 어트랙션에서 재방문이나 단체 참여를 염두에 둔 시설로 전환되고 있습니다. 무선 헤드셋의 도입으로 각 스테이션에 고정된 컴퓨터 장비를 설치할 필요가 줄어들어 시설 운영이 간소화되고 있습니다. Mixtou Experience와 Hopi Hari는 2026년 1월, 기존 테마파크 내에 시뮬레이터를 도입하여 유료 체험을 추가하는 전용 VR 구역을 개설했습니다. Mixtou사는 브라질에서 5년 동안 60곳의 신규 점포를 개설할 계획이며, 보도 자료에 인용된 2025년 환율을 기준으로 1억 브라질 레알(1,720만 달러)을 투자할 것이라고 밝혔습니다. 이 비즈니스 모델에서는 표준화된 장비, 인지도가 높은 게임, 그리고 소매 구역 전체에 전개 가능한 소규모 매장이 중시되고 있습니다. 이를 통해 사업자는 대규모 신규 시설을 건설하지 않고도 목적지형 테마파크 이외의 지역으로 사업을 확장할 수 있게 되어, 남미의 몰입형 엔터테인먼트 시장을 지원하고 있습니다.
몰입형 엔터테인먼트 시설의 높은 초기 도입 비용
높은 도입 비용으로 인해 여전히 몰입형 시설이 2·3선 도시로 확산되는 데 제약을 받고 있습니다. 중규모 시설의 경우에도 프로젝션 시스템, 공간 오디오, 햅틱스, 프리로밍 장비 및 부지 조성에 20만-50만 달러가 소요될 수 있습니다. 더 대규모의 목적지형 체험 시설의 경우, 세트, 전용 시스템, 라이선스 컨텐츠에 대한 추가 지출이 필요합니다. 브라질에서는 현재 78건의 오락·엔터테인먼트 프로젝트가 개발 중이며, 보고된 정보에 기재된 환율을 적용하면 총 투자액은 94억 레알(16억 2,000만 달러)에 달합니다. 이러한 수준의 투자는 자금 조달 능력이 있는 유서 깊은 개발사, 대규모 지역 운영사 및 글로벌 라이선스 제공자에게 유리하게 작용합니다. 따라서 남미의 몰입형 엔터테인먼트 시장에서는 소규모 시설을 상업적으로 성공시키기 위해 프랜차이즈나 수익 분배 모델에 의존하고 있습니다.
부문 분석
2025년, 테마형 엔터테인먼트는 남미 몰입형 엔터테인먼트 시장의 27.45%를 차지했습니다. 이러한 위상은 테마파크와 쇼핑몰이 방문객에게 친숙한 경험에 디지털 요소를 더할 수 있는 능력을 반영합니다. 기존 시설은 방문객 수, 식품 및 음료 서비스, 운영 팀을 활용하여 새로운 형태의 사업을 지원할 수 있습니다. 이로 인해 테마형 콘셉트는 처음부터 수요를 구축해야 하는 독립형 시설에 비해 실질적인 우위를 점하고 있습니다. 또한 이 형식은 어트랙션 인프라 전체를 개편하지 않고도 프로그램 변경에 대응할 수 있습니다. 이러한 확고한 입지는 기존 방문객을 대상으로 신기술을 시범적으로 도입하고자 하는 사업자에게 유용한 기반이 됩니다. 호러 어트랙션과 탈출 게임은 브라질과 콜롬비아에서 안정적인 중견 부문를 구축하고 있습니다. 몰입형 극장이나 체험형 미술관도 기관과의 제휴를 통해 지지를 넓혀가고 있습니다. 전시회나 소매점에서의 설치 예술이 여전히 중요시되는 이유는 소비자 대상 브랜드들이 신제품 출시나 축제에서 감각에 호소하는 형식을 채택하고 있기 때문입니다. 엘세브 콜라겐 리프터는 2026년 2월부터 3월에 걸쳐 리우데자네이루와 상파울루에서 몰입형 팝업 스토어를 운영했으며, 보도에 따르면 리우에서의 세션은 24시간 만에 매진되었다고 합니다.
라이브형 몰입형 게임 이벤트는 2026-2031년까지 연평균 성장률(CAGR) 14.95%로 확대될 것으로 예측됩니다. 이 형식은 물리적 이동과 게임 세계, 상호작용형 과제, 그룹 참여를 결합한 것입니다. 게임 컨텐츠 권리 보유자는 확고한 팬 커뮤니티를 활용하여 라이브 체험 행사에 방문객을 유치할 수 있습니다. 또한 이러한 이벤트는 같은 행사장 내에서 굿즈 판매, 식품 및 음료 서비스, 브랜드 관련 활동의 기회도 창출합니다. 대규모 제작을 위해서는 컨텐츠 소유자, 기술 공급업체, 프로듀서, 그리고 현지 행사장 파트너 간의 협력이 필요합니다. 이러한 조정은 소규모 사업자에게는 진입 장벽이 되지만, 경험이 풍부한 현지 공급업체에게는 제휴 기회를 제공합니다. 남미의 몰입형 엔터테인먼트 업계는 세계적인 게임 프랜차이즈를 활용하여 해당 지적재산권을 이미 알고 있는 관객을 유치할 수 있습니다. 대규모 프로덕션이 야외 엔터테인먼트 행사 개최지로서 부에노스아이레스의 인지도를 높임으로써, 이 도시는 혜택을 얻게 됩니다. 운영 사업자는 일정, 결제 방식, 관람객 지원을 현지 상황에 맞춰 조정해야 합니다. 이를 통해 글로벌 포맷이 첫 개최 후 재방문 수요를 창출할 수 있는지 여부가 결정됩니다.
2025년 시점에 기술별로 살펴보면, 남미의 몰입형 엔터테인먼트 시장에서 가상현실(VR)이 35.42%의 점유율을 차지했습니다. 독립형 헤드셋은 게임 센터, 가족 센터, 테마파크의 어트랙션에서 이러한 입지를 지원해 왔습니다. 이러한 헤드셋은 유선 연결 컴퓨터에 대한 의존도를 낮추고, 여러 스테이션으로 구성된 레이아웃 도입을 용이하게 합니다. 또한 방문객 수의 변동에 따라 행사장이 공간을 재구성하는 것도 쉬워집니다. 이러한 유연성은 운영자가 제한된 공간 내에서 사업을 운영해야 하는 쇼핑몰에서 중요합니다. 증강현실(AR)은 디지털 오버레이가 물리적 환경을 보완할 수 있는 브랜드 홍보나 야외 행사에서 활용되고 있습니다. 공간 오디오는 극장, 게임 공간, 전시회 등에서 점점 더 많이 도입되고 있습니다. 많은 시설에서 이는 독립된 체험 카테고라기보다는 체험을 가능하게 하는 기능으로 작용하고 있습니다. 햅틱 및 다감각 시스템은 더 많은 조정과 투자가 필요하므로 여전히 플래그십 체험에 집중되고 있습니다. 이러한 기술의 조합은 소매점이나 어트랙션 환경 내에서 안정적으로 작동하는 형태가 선호되고 있음을 반영합니다.
혼합현실(MR)은 2031년까지 연평균 성장률(CAGR) 15.17%로 확대될 것으로 예측됩니다. 패스스루 카메라를 통해 방문객은 물리적 주변 환경을 그대로 인식한 채, 그 위에 디지털 컨텐츠를 중첩하여 표시할 수 있습니다. 이를 통해 대형 프로젝션 돔이나 대규모 건설 공사의 필요성을 줄일 수 있습니다. 또한 방문객이 동일한 물리적 공간을 계속 인식하므로 이 형식은 공동 체험에도 대응할 수 있습니다. 보도에 따르면 Realigate사는 2025-2026년에 리우데자네이루의 바하 다 치주카 지역에서 130제곱미터 규모의 프리로밍형 혼합현실 아레나를 운영했습니다. Meta사는 메모리 칩 가격 상승을 이유로 2026년 4월 Quest 3S 및 Quest 3의 정가를 인상했습니다. 기기 비용 상승은 독립형 시스템이 유선 연결형 설비보다 여전히 비용이 저렴하더라도 확장 예산에 영향을 미칠 수 있습니다. 자산 부담이 적은 혼합 현실 서비스는 전용 테마파크를 전면적으로 건설하지 않고도 기존의 소매 공간을 활용할 수 있습니다. 남미의 몰입형 엔터테인먼트 업계는 신뢰할 수 있는 컨텐츠와 지속적인 기술 지원이 제공된다면 이러한 모델로부터 혜택을 볼 가능성이 있습니다. 사업자는 이러한 유연성과 기기 교체 및 소프트웨어 지원에 드는 비용 간의 균형을 맞춰야 합니다.
기타 혜택:
- 엑셀 형식의 시장 예측(ME) 시트
- 3개월간의 애널리스트 지원
자주 묻는 질문
목차
제1장 서론
- 조사 전제조건과 시장 정의
- 조사 범위
제2장 조사 방법
제3장 개요
제4장 시장 구도
- 시장 개요
- 거시경제 요인이 시장에 미치는 영향
- 시장 성장 촉진요인
- 시장 성장 억제요인
- 업계 밸류체인 분석
- 규제 상황
- 기술 전망
- Porter's Five Forces 분석
제5장 시장 규모와 성장 예측
- 용도별
- 기술별
- 회장 유형별
- 수입원별
- 지역별
- 브라질
- 아르헨티나
- 콜롬비아
- 기타 남미 국가
제6장 경쟁 구도
- 시장 집중도
- 전략적 동향
- 시장 점유율 분석
- 기업 개요
- 3dar
- Apple Inc.
- Barco NV
- Casa Mais
- Google LLC
- Grupo Cataratas
- Hello Park LLC
- HTC Corporation
- HQSoftware
- IMAX Corporation
- Meta Platforms, Inc.
- Microsoft Corporation
- Mixtou Experience
- MultiVerso Experience
- Novaworks
- Qualcomm Incorporated
- Samsung Electronics Co., Ltd.
- Sense Arq
- Sony Group Corporation
- Storyland Studios
- Universal Destinations & Experiences
- Visualfarm
- VR do Brasil
- VRMKT
제7장 시장 기회와 향후 전망
KSA 26.10.28According to Mordor Intelligence, the South America immersive entertainment market size was valued at USD 5.61 billion in 2025 and USD 6.38 billion in 2026, and is projected to reach USD 12.65 billion by 2031, at a CAGR of 14.67% during the forecast period (2026-2031).
South America Immersive Entertainment Market Trends and Insights
Expansion of Location-Based Entertainment in Shopping Malls
Shopping malls are converting retail vacancies into entertainment space as e-commerce changes the role of physical stores. This is lowering barriers for operators that need accessible urban locations and predictable visitor traffic. Mall owners in Sao Paulo, Buenos Aires, and Santiago are offering revenue-share leases and fit-out support to entertainment tenants. These arrangements reduce the initial capital burden for mid-sized immersive sites. In 2026, operators continued to use mall locations for multiplayer and mixed-reality experiences, often alongside existing cinema and food-service traffic. The South America immersive entertainment market benefits when malls treat immersive venues as visitor anchors rather than temporary users of vacant space.
Growth of VR Arcades and Family Entertainment Centers
VR arcades are moving from trial-oriented attractions toward venues designed for repeat visits and group participation. Wireless headsets reduce the need for fixed computing equipment at every station and simplify venue operations. Mixtou Experience and Hopi Hari opened a dedicated VR area in January 2026, using simulators that added paid experiences within an existing theme park. Mixtou stated that it planned 60 new units in Brazil over 5 years, with BRL 100 million in investment (USD 17.2 million) at the 2025 exchange rate cited in the reported information. The model favors standardized equipment, recognizable games, and smaller sites that can be replicated across retail corridors. This supports the South America immersive entertainment market by allowing operators to extend beyond destination parks without building large greenfield facilities.
High Upfront Cost of Immersive Entertainment Installations
High installation costs continue to limit the spread of immersive venues into secondary and tertiary cities. Mid-sized formats can require USD 200,000 to USD 500,000 for projection systems, spatial audio, haptics, free-roam equipment, and site preparation. Larger destination experiences require additional spending on scenery, specialized systems, and licensed content. Brazil has 78 amusement and entertainment projects under development, backed by BRL 9.4 billion (USD 1.62 billion) using the exchange rate cited in the reported information. This level of investment favors established developers, large regional operators, and global licensors with access to funding. The South America immersive entertainment market, therefore, depends on franchises and revenue-share structures to make smaller locations commercially possible.
Other drivers and restraints analyzed in the detailed report include:
- Rising Demand for Immersive Cultural and Art Experiences
- Increasing Brand Activation and Corporate Event Spending
- Limited Availability of Specialized Content and Technical Talent
For complete list of drivers and restraints, kindly check the Table Of Contents.
Segment Analysis
Themed entertainment held 27.45% of the South America immersive entertainment market in 2025. Its position reflects the ability of theme parks and malls to add digital elements to familiar guest experiences. Existing venues can use their visitor traffic, food service, and operating teams to support new formats. This gives themed concepts a practical advantage over a stand-alone launch that must build demand from the beginning. The format also supports changes to programming without replacing the wider attraction infrastructure. Its established presence provides a useful base for operators that want to test new technology with existing guests. Haunted attractions and escape rooms have built a stable middle segment in Brazil and Colombia. Immersive theaters and experiential art museums are also gaining support through institutional partnerships. Exhibitions and retail installations remain relevant because consumer brands are using sensory formats during launches and festivals. Elseve Collagen Lifter operated immersive pop-ups in Rio de Janeiro and Sao Paulo from February through March 2026, with Rio sessions selling out within 24 hours according to the reported information.
Live immersive gaming events are projected to expand at a 14.95% CAGR between 2026 and 2031. The format combines physical navigation with game worlds, interactive challenges, and group participation. Gaming properties can use established fan communities to support attendance at live experiences. The events also create opportunities for merchandise, food service, and branded activities at the same site. Large productions require content owners, technical suppliers, producers, and local venue partners to work together. That coordination creates entry barriers for small operators but opens partnership opportunities for experienced local providers. The South America immersive entertainment industry can use global gaming franchises to attract audiences that already recognize the intellectual property. Buenos Aires benefits when major productions strengthen its profile as a location for large outdoor entertainment events. Operators must still adapt scheduling, payment methods, and visitor support to local conditions. This helps determine whether a global format can build repeat demand after its first launch.
Virtual reality held 35.42% of the South America immersive entertainment market by technology in 2025. Standalone headsets have supported this position in arcades, family centers, and theme park attractions. They reduce dependence on tethered computers and make multi-station layouts easier to deploy. The devices also make it easier for venues to reconfigure space as visitor volumes change. This flexibility matters in malls where operators may work within compact footprints. Augmented reality has found use in brand activations and outdoor events where digital overlays can complement physical settings. Spatial audio is increasingly embedded across theaters, gaming spaces, and exhibitions. It functions as an enabling feature rather than a separate destination category in many venues. Haptics and multisensory systems remain concentrated in flagship experiences because they require more calibration and investment. The technology mix reflects the preference for formats that can operate reliably within retail and attraction environments.
Mixed reality is projected to expand at a 15.17% CAGR through 2031. Pass-through cameras allow a visitor to see physical surroundings while digital content is placed over them. This can reduce the need for large projection domes and extensive construction. The format can also support shared activity because visitors remain aware of the same physical space. Realigate operated a 130-square-meter free-roam mixed-reality arena in Rio de Janeiro's Barra da Tijuca during 2025 and 2026, according to reported information. Meta increased the listed prices of Quest 3S and Quest 3 devices in April 2026 because of higher memory-chip costs. Higher device costs can affect expansion budgets, even where standalone systems remain less costly than tethered installations. Asset-light mixed-reality services can use existing retail space without a full destination-park buildout. The South America immersive entertainment industry may benefit from these models when they provide reliable content and ongoing technical support. Operators must balance this flexibility with spending on device replacement and software support.
Complete Report Scope:
- By Application
- Themed Entertainment
- Haunted Attractions and Escape Rooms
- Immersive Theatres
- Experiential Art Museums
- Exhibitions and Retail Installations
- Live Immersive Gaming Events
- By Technology
- Virtual Reality (VR)
- Augmented Reality (AR)
- 3D Audio and Spatial Sound
- Mixed Reality (MR)
- Haptics and Multisensory Tech
- By Venue Type
- Theme and Amusement Parks
- Family/Indoor Entertainment Centers
- Museums and Galleries
- Stand-Alone Immersive Venues
- Pop-Up and Temporary Installations
- By Revenue Stream
- Ticket Sales
- Food and Beverage
- Merchandise
- Sponsorship and Brand Partnerships
- IP Licensing and Royalties
- Subscription and Memberships
- By Geography
- Brazil
- Argentina
- Colombia
- Rest of South America
List of Companies Covered in this Report:
- 3dar
- Apple Inc.
- Barco NV
- Casa Mais
- Google LLC
- Grupo Cataratas
- Hello Park LLC
- HTC Corporation
- HQSoftware
- IMAX Corporation
- Meta Platforms, Inc.
- Microsoft Corporation
- Mixtou Experience
- MultiVerso Experience
- Novaworks
- Qualcomm Incorporated
- Samsung Electronics Co., Ltd.
- Sense Arq
- Sony Group Corporation
- Storyland Studios
- Universal Destinations & Experiences
- Visualfarm
- VR do Brasil
- VRMKT
Additional Benefits:
- The market estimate (ME) sheet in Excel format
- 3 months of analyst support
TABLE OF CONTENTS
1 INTRODUCTION
- 1.1 Study Assumptions and Market Definition
- 1.2 Scope of the Study
2 RESEARCH METHODOLOGY
3 EXECUTIVE SUMMARY
4 MARKET LANDSCAPE
- 4.1 Market Overview
- 4.2 Impact of Macroeconomic Factors on the Market
- 4.3 Market Drivers
- 4.3.1 Expansion of Location-Based Entertainment in Shopping Malls
- 4.3.2 Growth of VR Arcades and Family Entertainment Centers
- 4.3.3 Rising Demand for Immersive Cultural and Art Experiences
- 4.3.4 Increasing Brand Activation and Corporate Event Spending
- 4.3.5 Expansion of Brazil's Tourism and Attraction Ecosystem
- 4.3.6 Falling Cost of Standalone VR Hardware and Wireless Headsets
- 4.4 Market Restraints
- 4.4.1 High Upfront Cost of Immersive Entertainment Installations
- 4.4.2 Limited Availability of Specialized Content and Technical Talent
- 4.4.3 Motion Sickness, Accessibility, and Health-Safety Concerns
- 4.4.4 Volatile Currency and Imported Hardware Exposure
- 4.5 Industry Value Chain Analysis
- 4.6 Regulatory Landscape
- 4.7 Technological Outlook
- 4.8 Porter's Five Forces Analysis
- 4.8.1 Bargaining Power of Suppliers
- 4.8.2 Bargaining Power of Buyers
- 4.8.3 Threat of New Entrants
- 4.8.4 Threat of Substitutes
- 4.8.5 Competitive Rivalry
5 MARKET SIZE AND GROWTH FORECASTS (VALUE)
- 5.1 By Application
- 5.1.1 Themed Entertainment
- 5.1.2 Haunted Attractions and Escape Rooms
- 5.1.3 Immersive Theatres
- 5.1.4 Experiential Art Museums
- 5.1.5 Exhibitions and Retail Installations
- 5.1.6 Live Immersive Gaming Events
- 5.2 By Technology
- 5.2.1 Virtual Reality (VR)
- 5.2.2 Augmented Reality (AR)
- 5.2.3 3D Audio and Spatial Sound
- 5.2.4 Mixed Reality (MR)
- 5.2.5 Haptics and Multisensory Tech
- 5.3 By Venue Type
- 5.3.1 Theme and Amusement Parks
- 5.3.2 Family/Indoor Entertainment Centers
- 5.3.3 Museums and Galleries
- 5.3.4 Stand-Alone Immersive Venues
- 5.3.5 Pop-Up and Temporary Installations
- 5.4 By Revenue Stream
- 5.4.1 Ticket Sales
- 5.4.2 Food and Beverage
- 5.4.3 Merchandise
- 5.4.4 Sponsorship and Brand Partnerships
- 5.4.5 IP Licensing and Royalties
- 5.4.6 Subscription and Memberships
- 5.5 By Geography
- 5.5.1 Brazil
- 5.5.2 Argentina
- 5.5.3 Colombia
- 5.5.4 Rest of South America
6 COMPETITIVE LANDSCAPE
- 6.1 Market Concentration
- 6.2 Strategic Moves
- 6.3 Market Share Analysis
- 6.4 Company Profiles (includes Global Level Overview, Market Level Overview, Core Segments, Financials as available, Strategic Information, Market Rank/Share, Products and Services, Recent Developments)
- 6.4.1 3dar
- 6.4.2 Apple Inc.
- 6.4.3 Barco NV
- 6.4.4 Casa Mais
- 6.4.5 Google LLC
- 6.4.6 Grupo Cataratas
- 6.4.7 Hello Park LLC
- 6.4.8 HTC Corporation
- 6.4.9 HQSoftware
- 6.4.10 IMAX Corporation
- 6.4.11 Meta Platforms, Inc.
- 6.4.12 Microsoft Corporation
- 6.4.13 Mixtou Experience
- 6.4.14 MultiVerso Experience
- 6.4.15 Novaworks
- 6.4.16 Qualcomm Incorporated
- 6.4.17 Samsung Electronics Co., Ltd.
- 6.4.18 Sense Arq
- 6.4.19 Sony Group Corporation
- 6.4.20 Storyland Studios
- 6.4.21 Universal Destinations & Experiences
- 6.4.22 Visualfarm
- 6.4.23 VR do Brasil
- 6.4.24 VRMKT
7 MARKET OPPORTUNITIES AND FUTURE OUTLOOK
- 7.1 White-Space and Unmet-Need Assessment


