

|
시장보고서
상품코드
2155667
애플리케이션 보안 테스트 오케스트레이션 : 시장 점유율 분석, 업계 동향과 통계, 성장 예측(2026-2031년)Application Security Testing Orchestration - Market Share Analysis, Industry Trends & Statistics, Growth Forecasts (2026 - 2031) |
||||||
 Mordor Intelligence
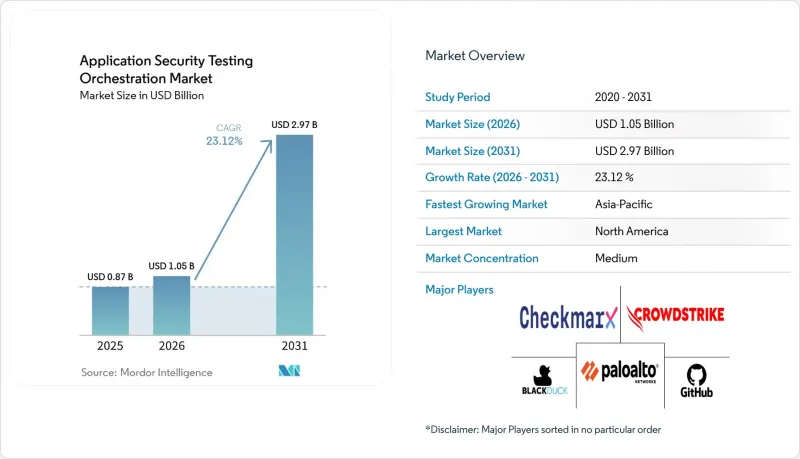
에 따르면 애플리케이션 보안 테스트 오케스트레이션 시장 규모는 2025년에 8억 7,000만 달러로 평가되며, 2026년 10억 5,000만 달러에서 2031년까지 29억 7,000만 달러에 달할 것으로 예측되며, 예측 기간(2026-2031년) 동안 CAGR은 23.12%가 될 전망입니다.
세계 애플리케이션 보안 테스트 오케스트레이션 시장의 동향 및 인사이트
애플리케이션 계층에 대한 공격 건수 증가
애플리케이션 계층에 대한 공격이 증가함에 따라 보안 오케스트레이션에 대한 지속적인 수요가 발생하고 있습니다. Radware사의 보고서에 따르면, 2026년 1분기에 차단된 웹 애플리케이션 및 API에 대한 공격 시도 중 취약점 악용에 의한 것이 62% 가까이 차지했습니다. SQL 인젝션 시도는월 5,000만-6,000만 건 수준을 유지하고 있는 반면, 2026년 3월에는 클라우드 서비스가 60억 건 이상의 악용 시도를 차단했습니다. Verizon의 보고서에 따르면, 2026년에는 소프트웨어 취약점이 31%를 차지하며 자격 증명 도용을 제치고 침해의 주요 침입 경로가 되었습니다. 자동화된 공격 도구는 팀이 수동으로 조사 결과를 검증하는 것보다 더 신속하게 공격 캠페인을 확대할 수 있습니다. SAST, DAST, IAST 및 SCA의 결과가 우선순위가 지정된 단일 시정 조치 대기열로 통합됨에 따라 애플리케이션 보안 테스트 오케스트레이션 시장은 혜택을 볼 것입니다. 지속적인 테스트를 통해 취약점이 코드에 포함된 후 팀이 대응하기까지 걸리는 시간을 단축할 수 있습니다.
DevSecOps 및 시프트 레프트 도입
DevSecOps 도입이 진행됨에 따라 소스 관리, 빌드 시스템, 개발 환경을 연동하는 도구에 대한 수요가 증가하고 있습니다. Black Duck은 2026년 2월, GitHub, GitLab, Azure DevOps, Bitbucket에서 Polaris의 연동 기능을 확충하여 SAST, SCA, DAST를 통합한 커버리지를 제공했습니다. 이는 각 벤더들이 테스트 엔진의 기능뿐만 아니라 연동 범위의 폭넓음에서도 경쟁을 치열하게 벌이고 있는 이유를 보여줍니다. GitLab의 조사에 따르면, 2025년에는 DevSecOps 전문가들이 도구의 파편화로 인해 매주 7시간을 낭비하고 있었던 것으로 밝혀졌습니다. 또한, 같은 조사에서 평균적인 기업이 50개 가까운 보안 도구를 관리하고 있는 것으로도 밝혀졌습니다. 필터링되지 않은 스캐너의 출력은 개발자가 품질 점검에 의한 차단을 회피하는 방법을 익히게 되면 ‘시프트 레프트’에 대한 피로감을 유발할 가능성이 있습니다. 애플리케이션 보안 테스트 오케스트레이션 시장에서는 발견 사항이 스프린트 큐에 들어가기 전에 악용 가능성을 검증할 수 있는 플랫폼이 선호되고 있습니다.
높은 총 소유 비용(TCO)과 통합의 복잡성
오케스트레이션 계층을 통합하려면 플랫폼 라이선스 비용 자체보다 더 많은 투자가 필요할 수 있습니다. 기업에서는 대개 레거시 SAST 엔진, 여러 DAST 스캐너, SCA 도구, 컨테이너 레지스트리 및 이슈 추적 시스템을 연동해야 합니다. 커넥터 개발, API 버전 조정, 정책 변환 등은 도입 시 예상치 못한 애플리케이션 보안 관련 엔지니어링 작업을 증가시킬 수 있습니다. GitLab의 2025년 조사에 따르면, 분산된 보안 도구로 인해 주당 7시간의 생산성이 손실되고 있는 것으로 보고되었습니다. 또한, PCI DSS 4.0에서는 소프트웨어 구성요소 인벤토리 작성이 의무화되어 있어, 이로 인해 구현 프로그램에 대한 문서 작성 작업이 증가합니다. ISO/IEC 27034는 통합 지침을 제공하지만, 커넥터에는 여전히 현장 조정이 필요합니다. 이러한 요구 사항으로 인해, 특히 아시아태평양이나 남미에서 보안 성숙도가 낮은 조직의 도입이 지연될 가능성이 있습니다.
부문 분석
2025년, 애플리케이션 보안 테스트 오케스트레이션 시장 매출 중 소프트웨어 및 플랫폼이 61.53%를 차지했습니다. 기업들은 공유 정책 계층과 서로 다른 도구에 걸친 검사 결과를 통합된 뷰로 제공하는, 전용으로 설계된 오케스트레이션 엔진을 선호하여 채택했습니다. 구매자들이 우선적으로 테스트 파이프라인 관리를 필요로 했기 때문에 이러한 투자가 초기 도입을 주도했습니다. 공통 인터페이스를 통해 각 포인트 제품을 개별 워크플로우로 관리해야 할 필요성이 줄어들었습니다. 또한 플랫폼 도입을 통해 보안 팀은 관련 위험 관리 프로세스를 추가할 수 있는 기반을 마련할 수 있었습니다. 애플리케이션 보안 테스트 업계는 팀이 테스트 규칙을 한 번만 설정하면 여러 리포지토리에 걸쳐 적용할 수 있는 플랫폼으로 전환되고 있습니다. 이러한 접근 방식을 통해 사업 부서 간 결과의 일관성을 높일 수 있습니다. 또한 개발자에게는 기반이 되는 테스트 스택을 쉽게 활용할 수 있다는 이점도 있습니다.
서비스 분야는 2026년부터 2031년까지 연평균 성장률(CAGR) 26.43%를 기록할 것으로 예상되며, 이는 제공 부문 중 가장 높은 성장률입니다. 이 부문에는 도입, 자문, 관리형 테스트 및 통합 작업이 포함됩니다. 오케스트레이션이 엔지니어링 프로세스에 깊이 침투함에 따라 구매자에게는 이러한 지원이 필요해집니다. 정책 조정이나 운영 모델 설계는 셀프서비스형 도입만으로는 대응하기 어려운 경우가 적지 않습니다. 또한, 서비스의 성장은 복잡한 프로그램의 설정 및 운영이 가능한 사내 전문가의 부족도 반영하고 있습니다. 따라서 이는 벤더에게 단순한 표준 업셀 기회 이상의 의미를 지닙니다. 매니지드 딜리버리는 소규모 보안 팀이 엔터프라이즈 수준의 관행을 활용할 수 있도록 지원합니다. 애플리케이션 보안 테스트 오케스트레이션 시장은 고객이 측정 가능한 도입 지원을 요구하는 이 모델로부터 혜택을 얻을 수 있습니다. 구현 작업은 대개 어떤 리포지토리, 테스트 및 과제 관리 시스템을 연동해야 할지 정의하는 것에서 시작됩니다. 그 후, 자문 지원을 통해 팀은 사내 위험 정책을 일상적인 개발 업무에서 활용할 수 있는 체크포인트로 전환할 수 있습니다. 관리형 테스트는 사내 인력 체계가 소프트웨어 릴리스 주기를 따라잡지 못하는 경우에도 구매자가 이러한 관리 체계를 유지할 수 있는 수단을 제공합니다. 바로 이러한 요구 사항이 소프트웨어 카테고리가 성숙해짐에 따라 서비스 수요가 감소하는 것이 아니라, 플랫폼 도입에 따라 증가할 수 있는 이유를 설명해 줍니다. 또한, 도입의 성패는 단순히 기술적 인터페이스를 연동하는 것뿐만 아니라 프로세스 설계에 달려 있음을 보여줍니다. 팀에게는 발견된 사항에 대한 명확한 책임 소재, 실용적인 에스컬레이션 절차, 그리고 개발자가 소프트웨어를 릴리스하는 방식에 맞춘 정책이 필요합니다. 이러한 요소가 부족할 경우, 새로운 플랫폼은 단순히 기존 경보의 잡음을 다른 인터페이스로 옮기는 것에 그치게 됩니다. 보안 팀이 자체적인 내부 역량을 구축하는 동안, 서비스 제공업체는 고객이 이러한 실무상의 과제를 해결할 수 있도록 지원할 수 있습니다.
위험 기반 테스트 우선순위 지정은 2026년부터 2031년까지 연평균 성장률(CAGR) 27.21%로 성장할 것으로 예측됩니다. 이는 멀티툴 환경에서 스프린트 중에 수천 건의 경보가 발생했을 때, 대응이 필요한 발견 사항을 식별해야 하는 필요성에 부응하는 것입니다. 우선순위 지정 프로세스에서는 작업을 할당하기 전에 악용 가능성, 접근 가능성 및 비즈니스에 미치는 영향을 종합적으로 고려할 수 있습니다. 이 프로세스를 통해 개발자는 더 짧고 관련성 높은 목록에 집중할 수 있게 됩니다. 이 기능과 관련된 애플리케이션 보안 테스트 오케스트레이션 시장의 규모는 탐지 능력에 비해 시정 능력이 제한적이라는 점 때문에 확대되고 있습니다. 보안 팀은 스캔의 원시 데이터 양보다 맥락에 기반한 증거를 더 중요하게 여기게 되었습니다. 이러한 변화는 피해를 초래할 가능성이 가장 높은 문제를 식별할 수 있는 도구의 활용을 촉진하고 있습니다. 또한, 연동되는 전체 도구에서 양질의 데이터 품질의 중요성도 높아지고 있습니다.
2025년 시점에서 도구 통합 및 테스트 파이프라인 관리는 매출 기준 최대 규모의 기능 하위 부문이었습니다. 이는 대부분의 조직이 고급 위험 모델을 적용하기 전에 구축하는 연결 계층을 형성합니다. 조직은 일반적으로 먼저 도구를 연동하고, 프로그램이 성숙해짐에 따라 리스크 스코어링 및 자동화된 정책 적용을 추가해 나갑니다. CISA의 2026년 SBOM 지침에는 우선순위 지정 엔진이 의존성 증거와 결합하여 사용할 수 있는, 기계 처리 가능한 구성요소 식별자 및 해시 요구 사항이 추가되었습니다. 그 후, 보안 정책과 품질 게이트의 적용을 통해 확보된 증거가 재현 가능한 개발 관리 조치로 전환됩니다. 테스트 일정 수립 및 실행의 오케스트레이션은 이러한 진전에 맞춰 발전해 나갑니다. 따라서 애플리케이션 보안 테스트 오케스트레이션 시장은 연결에서 우선순위 지정, 그리고 정책 자동화에 이르는 실용적인 순서를 따르고 있습니다. 이러한 순서 덕분에 구매자는 기존 테스트 엔진을 한 번에 모두 교체하지 않고도 성숙도를 높일 수 있습니다. 또한, 위험 기반 우선순위 지정이 급속히 확대되고 있음에도 불구하고 통합 작업이 여전히 중심적인 역할을 수행하는 이유도 이를 통해 설명할 수 있습니다. 연계된 프로그램이 신뢰할 수 있는 위험 점수를 산출하거나 공통의 품질 게이트를 적용하려면 일관된 입력 데이터가 필요합니다. 구매자는 기존 도구, 리포지토리 및 팀 전반에 걸친 변경을 단계적으로 시행할 수 있으며, 완전한 교체 프로그램을 시작할 필요가 없습니다. 이러한 단계적 접근 방식은 보안 투자가 이미 정착된 기업에서 오케스트레이션의 실용성을 높여줍니다. 이는 성숙한 조직이 단일 테스트 엔진, 단일 개발 환경, 또는 단일 릴리스 관행만을 사용하는 경우가 거의 없다는 사실을 인식한 것입니다. 과제는 조사 결과의 유용성을 뒷받침하는 맥락을 잃지 않으면서 다양한 증거 출처를 조율하는 데 있습니다. 이것이 바로 위험 기반의 우선순위 지정이 그 기반이 되는 통합 계층의 품질에 의존하는 이유이기도 합니다. 도구 간의 연동이 불충분한 플랫폼에서는 팀이 더 많은 기록을 확보할 수는 있겠지만, 시정 조치에 대한 명확한 판단에 이르지 못할 가능성이 있습니다.
지역별 분석
2025년, 북미는 애플리케이션 보안 테스트 오케스트레이션 시장 매출의 41.29%를 차지했습니다. 이 지역에는 엔터프라이즈용 기술 구매자가 집중되어 있으며, DevSecOps 인재 기반도 충분히 갖춰져 있습니다. 또한, 연방 정부의 ‘Secure-by-Design’ 조달 정책에 따라 소프트웨어 보안에 대한 기대가 상용 공급망으로도 확대되고 있습니다. Radware의 조사에 따르면, 2026년 1분기에 전 세계에서 차단된 악성 웹 애플리케이션 및 API 트랜잭션의 80%를 북미가 차지했습니다. 미국은 연방 정부의 지침에 따라 정부 조달 시 SBOM(소프트웨어 구성 관리) 생성 및 소프트웨어 보안 증명이 장려됨에 따라 계속해서 주요 지역 시장으로서의 지위를 유지했습니다. 이러한 노력은 공공 기관에 제품을 판매하는 민간 벤더에게도 영향을 미치고 있습니다. 캐나다와 멕시코 역시 미국의 규제 및 품질 기준에 대한 기대치와 국경을 초월한 일관성 덕분에 혜택을 보고 있습니다. 이 지역의 애플리케이션 보안 테스트 오케스트레이션 시장 점유율은 높은 위협 노출도와 지속적인 소프트웨어 보안 지출을 모두 반영하고 있습니다.
2025년, 유럽은 독일, 영국, 프랑스를 필두로 지역별 점유율에서 2위를 차지했습니다. 기업의 높은 기술 투자와 엄격한 규제가 이 지역에서의 도입을 뒷받침하고 있습니다. DORA는 2025년 1월 발효된 후, EU 금융 기관 전반에 걸쳐 플랫폼 평가를 촉진했습니다. 또한, GDPR의 설명 책임 요건으로 인해 소프트웨어 수준의 데이터 보호 대책에 대한 관심도 높아지고 있습니다. 유럽의 구매자들은 데이터 거주지 및 기술 주권에 대한 우려로 인해 온프레미스나 하이브리드형 옵션을 자주 요구하고 있습니다. 따라서 SaaS 제공업체는 지역별 클라우드 인스턴스나 자체 호스팅 방식의 대안을 제공해야 합니다. 남미는 브라질을 필두로 하는 신흥 지역으로, LGPD 요건이 보안 검증을 촉진하고 있을 뿐만 아니라, 금융 포용의 진전으로 인해 결제 제공업체의 디지털 포트폴리오가 확대되고 있습니다. 이러한 결제 제공업체들은 PCI DSS 의무도 준수해야 하므로, 감사 가능한 테스트 워크플로의 가치가 더욱 높아지고 있습니다.
아시아태평양은 2026년부터 2031년까지 연평균 성장률(CAGR) 24.79%로 성장할 것으로 예측됩니다. 중국, 인도, 일본, 한국, 호주에서는 규제 요건이 더욱 구체화되는 한편, 디지털 서비스의 확대가 진행되고 있습니다. 인도의 결제 시스템 관련 지침에서는 6개월마다 취약점 평가, 신규 서비스 개시 전 VAPT(취약점 평가 및 침투 테스트), 그리고 CERT-In에 등록된 공급업체가 작성한 CVSS 점수가 포함된 보고서를 의무화하고 있습니다. 싱가포르 금융관리청(MAS)이 정한 기술 리스크 관리 지침이나 일본 금융청(FSA)의 FISC 기준에서는 NIST 및 CIS 벤치마크에 대한 언급이 늘고 있습니다. 이러한 요건으로 인해 보안 태세에 대한 증빙 자료와 자동화된 규정 준수 보고의 필요성이 높아지고 있습니다. 중동 및 아프리카는 절대적인 수익 규모 면에서는 여전히 작지만, 아랍에미리트(UAE)와 사우디아라비아에서는 ‘비전 2030’의 디지털화 프로그램과 금융 사이버 보안 규제를 통해 수요가 증가하고 있습니다. 남아프리카, 나이지리아, 이집트에서도 디지털 뱅킹 인프라가 확대됨에 따라 수요가 증가하고 있습니다. 애플리케이션 보안 테스트 오케스트레이션 시장은 기존의 온프레미스형 테스트 방식보다 클라우드 도입이 빠르게 진행되고 있는 분야에서 성장 여지가 있습니다.
기타 혜택:
- 엑셀 형식의 시장 예측(ME) 시트
- 3개월간의 애널리스트 지원
자주 묻는 질문
목차
제1장 소개
- 조사 가정과 시장 정의
- 조사 범위
제2장 조사 방법
제3장 주요 요약
제4장 시장 구도
- 시장 개요
- 시장 성장 촉진요인
- 시장 성장 억제요인
- 가치 및 공급망 분석
- 거시경제 요인의 영향
- 규제 상황
- 기술 전망
- Porter's Five Forces 분석
제5장 시장 규모와 성장 예측
- 제공별
- 오케스트레이션 기능별
- 전개 방식별
- 조직 규모별
- 산업 분야별
- 지역별
- 북미
- 미국
- 캐나다
- 멕시코
- 남미
- 브라질
- 아르헨티나
- 기타 남미 국가
- 유럽
- 독일
- 영국
- 프랑스
- 이탈리아
- 베네룩스
- 기타 유럽 국가
- 아시아태평양
- 중국
- 일본
- 인도
- 한국
- 호주
- 기타 아시아태평양 국가
- 중동 및 아프리카
- 중동
- 아랍에미리트
- 사우디아라비아
- 기타 중동 국가
- 아프리카
- 남아프리카공화국
- 나이지리아
- 이집트
- 기타 아프리카 국가
- 중동
- 북미
제6장 경쟁 구도
- 시장 집중도
- 전략적 동향
- 시장 점유율 분석
- 기업 개요
- Black Duck
- Checkmarx Ltd.
- GitHub, Inc.
- Palo Alto Networks, Inc.
- CrowdStrike Holdings, Inc.
- Veracode, Inc.
- HCLSoftware
- OpenText Corporation
- IBM Corporation
- GitLab Inc.
- Snyk Limited
- Mend.io
- Rapid7, Inc.
- Qualys, Inc.
- Contrast Security, Inc.
- Invicti Security Corp.
- ArmorCode, Inc.
- Cycode, Inc.
- Legit Security, Inc.
- OX Security, Inc.
- DefectDojo, Inc.
- Phoenix Security Ltd.
- Apiiro Ltd.
- Endor Labs, Inc.
- SonarSource SA
제7장 시장 기회와 향후 전망
KSM 26.10.30According to Mordor Intelligence, the application security testing orchestration market size was valued at USD 0.87 billion in 2025 and estimated to grow from USD 1.05 billion in 2026 to reach USD 2.97 billion by 2031, at a CAGR of 23.12% during the forecast period (2026-2031).
Global Application Security Testing Orchestration Market Trends and Insights
Rising Application-Layer Attack Volume
Application-layer attacks are creating a continuing need for security orchestration. Radware reported that exploitation of vulnerabilities accounted for nearly 62% of blocked web application and API attempts in Q1 2026. SQL injection attempts remained at 50-60 million per month, while cloud services blocked more than 6 billion exploitation attempts in March 2026. Verizon reported that software vulnerabilities became the leading entry point for breaches at 31% in 2026, ahead of stolen credentials. Automated attack tools can scale campaigns more quickly than teams can manually review findings. The application security testing orchestration market benefits when SAST, DAST, IAST, and SCA results are consolidated into a single prioritized remediation queue. Continuous testing can shorten the time between a vulnerability entering code and a team responding to it.
DevSecOps and Shift-Left Adoption
DevSecOps adoption is increasing demand for tools that connect source control, build systems, and developer environments. Black Duck expanded Polaris integrations across GitHub, GitLab, Azure DevOps, and Bitbucket in February 2026, providing unified SAST, SCA, and DAST coverage. This shows why vendors increasingly compete on integration breadth as well as test-engine functionality. GitLab found that DevSecOps professionals lost 7 hours each week to fragmented tools in 2025. The same survey found that the average enterprise managed close to 50 security tools. Unfiltered scanner output can create shift-left fatigue when developers learn to work around blocking quality checks. The application security testing orchestration market favors platforms that validate exploitability before findings enter sprint queues.
High Total Cost of Ownership and Integration Complexity
Integrating an orchestration layer can require more investment than the platform license itself. Enterprises often need to connect legacy SAST engines, several DAST scanners, SCA tools, container registries, and issue-tracking systems. Connector development, API version alignment, and policy translation can add unplanned AppSec engineering work during deployment. GitLab's 2025 survey reported 7 hours of weekly productivity loss from fragmented security tools. PCI DSS 4.0 also requires a software component inventory, which adds documentation work to implementation programs. ISO/IEC 27034 can provide an integration reference, but connectors still need local tuning. These demands can slow adoption in lower-maturity organizations, particularly in Asia-Pacific and South America.
Other drivers and restraints analyzed in the detailed report include:
- API-First and Cloud-Native Application Growth
- AI-Generated Code Security Requirements
- Application-Security Talent Shortage
For complete list of drivers and restraints, kindly check the Table Of Contents.
Segment Analysis
Software and platforms held 61.53% of application security testing orchestration market revenue in 2025. Enterprises favored purpose-built orchestration engines that provided a shared policy layer and a unified view of findings across different tools. These investments dominated early adoption because buyers first needed control over testing pipelines. A common interface reduced the need to manage each point product as a separate workflow. Platform deployments also gave security teams a base for adding adjacent risk-management processes. The application security testing industry is moving toward platforms that help teams set testing rules once and apply them across repositories. This approach can make outcomes more consistent across business units. It can also make the underlying testing stack easier for developers to use.
Services are projected to record a 26.43% CAGR from 2026 to 2031, the highest growth rate within the offering segment. This segment includes implementation, advisory, managed testing, and integration work. Buyers need this support as orchestration reaches more deeply into engineering processes. Policy tuning and operating-model design often exceed what a self-service deployment can provide. Services growth also reflects the shortage of in-house specialists who can configure and operate complex programs. It is therefore more than a standard upsell opportunity for vendors. Managed delivery can help smaller security teams gain access to enterprise practices. The application security testing orchestration market can gain from this model where customers want measurable deployment support. Implementation work often starts with defining which repositories, tests, and issue-management systems should be connected. Advisory support can then help teams translate internal risk policies into usable gates for daily development work. Managed testing gives buyers a way to maintain those controls when internal staffing does not keep pace with software releases. These needs explain why services can rise alongside platform adoption instead of declining as the software category matures. They also show that a successful deployment depends on process design, not only on connecting technical interfaces. Teams need clear ownership for findings, workable escalation routes, and policies that match how developers release software. Where these elements are missing, a new platform can simply transfer existing alert noise into a different interface. Service providers can help customers address these practical issues while security teams build their own internal capabilities.
Risk-based test prioritization is projected to grow at a 27.21% CAGR from 2026 to 2031. It addresses the need to identify the findings that demand action when multi-tool environments generate thousands of alerts during a sprint. A prioritization process can combine exploitability, reachability, and business effect before assigning work. That process helps developers focus on a shorter, more relevant list. The application security testing orchestration market size for this capability is expanding as remediation capacity becomes more limited than detection capacity. Security teams are placing greater value on contextual evidence than on raw scan volume. This change supports tools that can identify the issues most likely to cause harm. It also increases the importance of good data quality across the connected tools.
Tool integration and test pipeline management was the largest capability sub-segment by revenue in 2025. It forms the connectivity layer that most organizations establish before applying advanced risk models. Organizations generally connect tools first, then add risk scoring and automated policy enforcement as programs mature. CISA's 2026 SBOM guidance added machine-processable component identifiers and hash requirements that prioritization engines can use with dependency evidence. Security policy and quality-gate enforcement then turns the resulting evidence into repeatable development controls. Test scheduling and execution orchestration develops alongside that progression. The application security testing orchestration market therefore follows a practical sequence from connectivity to prioritization and then to policy automation. This sequence allows buyers to improve maturity without replacing every existing testing engine at once. It also explains why integration work remains central even as risk-based prioritization grows faster. A connected program needs consistent inputs before it can produce credible risk scores or enforce common quality gates. Buyers can phase changes across their existing tools, repositories, and teams rather than undertake a complete replacement program. That gradual approach can make orchestration more practical in enterprises with established security investments. It recognizes that mature organizations rarely use one testing engine, one development environment, or one set of release practices. The task is to coordinate varied sources of evidence without losing the context that makes a finding useful. This is also why risk-based prioritization depends on the quality of the integration layer beneath it. A platform that connects tools poorly can leave teams with more records, but not with clearer remediation decisions.
Complete Report Scope:
- By Offering
- Software and Platforms
- Services
- By Orchestration Capability
- Test Scheduling and Execution Orchestration
- Tool Integration and Test Pipeline Management
- Finding Aggregation and Correlation
- Risk-Based Test Prioritization
- Security Policy and Quality-Gate Enforcement
- Other Orchestration Capabilities
- By Deployment Mode
- Cloud
- On-Premises
- Hybrid
- By Organization Size
- Large Enterprises
- Small and Medium-Sized Enterprises
- By Industry Vertical
- Government and Public Administration
- Industrial Manufacturing
- Retail and E-Commerce
- Transportation and Logistics
- Energy and Utilities
- Oil and Gas
- IT and Telecommunication
- Media and Entertainment
- Education and Research Institutions
- Healthcare and Life Sciences
- Banking, Financial Services, and Insurance (BFSI)
- Other Industry Verticals
- By Geography
- North America
- United States
- Canada
- Mexico
- South America
- Brazil
- Argentina
- Rest of South America
- Europe
- Germany
- United Kingdom
- France
- Italy
- BENELUX
- Rest of Europe
- Asia-Pacific
- China
- Japan
- India
- South Korea
- Australia
- Rest of Asia-Pacific
- Middle East and Africa
- Middle East
- United Arab Emirates
- Saudi Arabia
- Rest of Middle East
- Africa
- South Africa
- Nigeria
- Egypt
- Rest of Africa
- Middle East
- North America
Geography Analysis
North America held 41.29% of the application security testing orchestration market revenue in 2025. The region has a high concentration of enterprise technology buyers and a well-developed DevSecOps talent base. The Federal secure-by-design procurement direction also extends software security expectations to commercial supply chains. Radware found that North America accounted for 80% of blocked malicious web application and API transactions globally in Q1 2026. The United States remained the main regional market because federal guidance encouraged SBOM generation and software security attestations for government procurement. These practices influence commercial vendors that sell to public agencies. Canada and Mexico also benefit from cross-border alignment with U.S. regulations and quality-gate expectations. The application security testing orchestration market share in the region reflects both high threat exposure and sustained software security spending.
Europe held the second-largest regional share in 2025, led by Germany, the United Kingdom, and France. High enterprise technology spending and dense regulation support regional adoption. DORA prompted platform evaluations across EU financial institutions after it became effective in January 2025. GDPR accountability requirements also increase attention to software-level data protection controls. European buyers frequently seek on-premises and hybrid options because of data residency and technology sovereignty concerns. SaaS suppliers must therefore offer regional cloud instances or self-hosted alternatives. South America is an emerging area led by Brazil, where LGPD requirements support security validation and financial inclusion expands digital portfolios for payment providers. These payment providers also face PCI DSS obligations, which increases the value of auditable testing workflows.
Asia-Pacific is projected to grow at a 24.79% CAGR from 2026 to 2031. China, India, Japan, South Korea, and Australia are expanding digital services while regulatory requirements become more specific. India's payment-system direction requires vulnerability assessments every 6 months, VAPT before new services, and CVSS-scored reports from CERT-In empaneled vendors. Singapore's Monetary Authority of Singapore Technology Risk Management guidelines and Japan's FSA FISC standards increasingly reference NIST and CIS benchmarks. These requirements create a need for security-posture evidence and automated compliance reporting. The Middle East and Africa remains smaller in absolute revenue, but the UAE and Saudi Arabia are increasing demand through Vision 2030 digitization programs and financial cybersecurity rules. South Africa, Nigeria, and Egypt add demand as digital banking infrastructure expands. The application security testing orchestration market has room to grow where cloud adoption advances faster than older on-premises testing approaches.
- Black Duck
- Checkmarx Ltd.
- GitHub, Inc.
- Palo Alto Networks, Inc.
- CrowdStrike Holdings, Inc.
- Veracode, Inc.
- HCLSoftware
- OpenText Corporation
- IBM Corporation
- GitLab Inc.
- Snyk Limited
- Mend.io
- Rapid7, Inc.
- Qualys, Inc.
- Contrast Security, Inc.
- Invicti Security Corp.
- ArmorCode, Inc.
- Cycode, Inc.
- Legit Security, Inc.
- OX Security, Inc.
- DefectDojo, Inc.
- Phoenix Security Ltd.
- Apiiro Ltd.
- Endor Labs, Inc.
- SonarSource SA
Additional Benefits:
- The market estimate (ME) sheet in Excel format
- 3 months of analyst support
TABLE OF CONTENTS
1 INTRODUCTION
- 1.1 Study Assumptions and Market Definition
- 1.2 Scope of the Study
2 RESEARCH METHODOLOGY
3 EXECUTIVE SUMMARY
4 MARKET LANDSCAPE
- 4.1 Market Overview
- 4.2 Market Drivers
- 4.2.1 Rising Application-Layer Attack Volume
- 4.2.2 DevSecOps and Shift-Left Adoption
- 4.2.3 API-First and Cloud-Native Application Growth
- 4.2.4 Regulatory and Secure-by-Design Procurement Requirements
- 4.2.5 AI-Generated Code Security Requirements
- 4.2.6 Software Supply-Chain and SBOM Governance
- 4.3 Market Restraints
- 4.3.1 High Total Cost of Ownership and Integration Complexity
- 4.3.2 Application-Security Talent Shortage
- 4.3.3 False-Positive Fatigue and Developer Friction
- 4.3.4 Legacy Monolith and Data-Residency Constraints
- 4.4 Value and Supply-Chain Analysis
- 4.5 Impact of Macroeconomic Factors
- 4.6 Regulatory Landscape
- 4.7 Technological Outlook
- 4.8 Porter's Five Forces Analysis
- 4.8.1 Threat of Substitutes
- 4.8.2 Bargaining Power of Buyers
- 4.8.3 Bargaining Power of Suppliers
- 4.8.4 Threat of New Entrants
- 4.8.5 Competitive Rivalry
5 MARKET SIZE AND GROWTH FORECASTS (VALUE)
- 5.1 By Offering
- 5.1.1 Software and Platforms
- 5.1.2 Services
- 5.2 By Orchestration Capability
- 5.2.1 Test Scheduling and Execution Orchestration
- 5.2.2 Tool Integration and Test Pipeline Management
- 5.2.3 Finding Aggregation and Correlation
- 5.2.4 Risk-Based Test Prioritization
- 5.2.5 Security Policy and Quality-Gate Enforcement
- 5.2.6 Other Orchestration Capabilities
- 5.3 By Deployment Mode
- 5.3.1 Cloud
- 5.3.2 On-Premises
- 5.3.3 Hybrid
- 5.4 By Organization Size
- 5.4.1 Large Enterprises
- 5.4.2 Small and Medium-Sized Enterprises
- 5.5 By Industry Vertical
- 5.5.1 Government and Public Administration
- 5.5.2 Industrial Manufacturing
- 5.5.3 Retail and E-Commerce
- 5.5.4 Transportation and Logistics
- 5.5.5 Energy and Utilities
- 5.5.6 Oil and Gas
- 5.5.7 IT and Telecommunication
- 5.5.8 Media and Entertainment
- 5.5.9 Education and Research Institutions
- 5.5.10 Healthcare and Life Sciences
- 5.5.11 Banking, Financial Services, and Insurance (BFSI)
- 5.5.12 Other Industry Verticals
- 5.6 By Geography
- 5.6.1 North America
- 5.6.1.1 United States
- 5.6.1.2 Canada
- 5.6.1.3 Mexico
- 5.6.2 South America
- 5.6.2.1 Brazil
- 5.6.2.2 Argentina
- 5.6.2.3 Rest of South America
- 5.6.3 Europe
- 5.6.3.1 Germany
- 5.6.3.2 United Kingdom
- 5.6.3.3 France
- 5.6.3.4 Italy
- 5.6.3.5 BENELUX
- 5.6.3.6 Rest of Europe
- 5.6.4 Asia-Pacific
- 5.6.4.1 China
- 5.6.4.2 Japan
- 5.6.4.3 India
- 5.6.4.4 South Korea
- 5.6.4.5 Australia
- 5.6.4.6 Rest of Asia-Pacific
- 5.6.5 Middle East and Africa
- 5.6.5.1 Middle East
- 5.6.5.1.1 United Arab Emirates
- 5.6.5.1.2 Saudi Arabia
- 5.6.5.1.3 Rest of Middle East
- 5.6.5.2 Africa
- 5.6.5.2.1 South Africa
- 5.6.5.2.2 Nigeria
- 5.6.5.2.3 Egypt
- 5.6.5.2.4 Rest of Africa
- 5.6.5.1 Middle East
- 5.6.1 North America
6 COMPETITIVE LANDSCAPE
- 6.1 Market Concentration
- 6.2 Strategic Moves
- 6.3 Market Share Analysis
- 6.4 Company Profiles (includes Global Level Overview, Market Level Overview, Core Segments, Financials as available, Strategic Information, Market Rank/Share, Products and Services, Recent Developments)
- 6.4.1 Black Duck
- 6.4.2 Checkmarx Ltd.
- 6.4.3 GitHub, Inc.
- 6.4.4 Palo Alto Networks, Inc.
- 6.4.5 CrowdStrike Holdings, Inc.
- 6.4.6 Veracode, Inc.
- 6.4.7 HCLSoftware
- 6.4.8 OpenText Corporation
- 6.4.9 IBM Corporation
- 6.4.10 GitLab Inc.
- 6.4.11 Snyk Limited
- 6.4.12 Mend.io
- 6.4.13 Rapid7, Inc.
- 6.4.14 Qualys, Inc.
- 6.4.15 Contrast Security, Inc.
- 6.4.16 Invicti Security Corp.
- 6.4.17 ArmorCode, Inc.
- 6.4.18 Cycode, Inc.
- 6.4.19 Legit Security, Inc.
- 6.4.20 OX Security, Inc.
- 6.4.21 DefectDojo, Inc.
- 6.4.22 Phoenix Security Ltd.
- 6.4.23 Apiiro Ltd.
- 6.4.24 Endor Labs, Inc.
- 6.4.25 SonarSource SA
7 MARKET OPPORTUNITIES AND FUTURE OUTLOOK
- 7.1 White-Space and Unmet-Need Assessment


