|
시장보고서
상품코드
1636631
통신사업자 OPEX 분석(2016-23년) : 여전히 높은 네트워크 OPEX로 고민하는 통신사업자, 미래의 이익을 위해 AI와 자동화에 주목Telco Opex Analyzer, 2016-23: Telcos Grapple with Stubbornly High Network Opex, Look to AI and Automation for Future Gains |
||||||
본 보고서에서는 2016년부터 2013년까지 통신사업자의 OPEX 동향을 카테고리별로 심층 분석하여 주요 지역 32개사의 데이터를 분석하였습니다.
비주얼
2023년 세계 통신사업자의 매출은 전년 대비 0.5% 감소한 1조 7,781억 달러로, 10년 만에 최저치를 기록할 것으로 예상됩니다. 이는 10년 만에 가장 낮은 수준이며, 특히 일본의 환율 변동과 5G 수익화 기회의 제한이 그 원인으로 꼽힙니다. 수익 정체와 더불어 통신사들은 높은 CAPEX 수요와 치열한 경쟁에 직면하고 있으며, 자산 매각이나 아웃소싱과 같은 전통적인 방법뿐만 아니라 전략적 비용 최적화의 필요성이 강조되고 있습니다. 따라서 OPEX의 관리가 중요합니다.
주요 조사 결과:
2023년 OPEX는 1.0% 감소했지만, 감가상각비(D&A)를 제외한 OPEX는 0.5% 감소하여 수익과 거의 동일한 감소율을 보였습니다. 그 차이는 D&A이며, 2023년에는 3%로 가파른 하락세를 보이고 있습니다.
- 네트워크 관련 OPEX는 운영, 임대, 유틸리티, D&A를 포함하며 전체 OPEX의 50.8%를 차지하지만, 기업별로 큰 편차를 보입니다.
- 네트워크 운영비용은 2016년 OPEX의 16.5%에서 2023년 18.4%로 증가할 것으로 예상됩니다. 네트워크 리스 OPEX는 새로운 회계 규칙(IFRS 16)으로 인해 몇 년 전 감소했으며, 현재는 3.0-3.5% 범위에서 안정적으로 유지되고 있습니다.
- 가장 큰 OPEX 카테고리인 D&A는 2023년 OPEX의 23.4%로 증가하고 있습니다.
- 통신사들의 디지털 인재 확보 경쟁과 자동화 도입에 따라 OPEX에서 인건비가 차지하는 비중은 16% 이상 증가 추세에 있으며, 전체 OPEX에서 인건비가 차지하는 비중은 2016년 16.2%에서 2023년 17.4%로 증가하고 있습니다.
조사 대상 오퍼레이터:
|
|
목차
- 1. 보고서 하이라이트
- 2. 개요
- 3. 조사 결과 : 통신 그룹 32개사
- 4. 조사 결과 : 기업별
- 5. 분류
- 6. 당사에 대해
This report provides a deep dive into telco opex trends by category from 2016 to 2013, analyzing data from 32 companies across key regions.
VISUALS

Managing opex wisely is essential for telcos to thrive and grow profitability: in 2023, global telco revenues fell 0.5% YoY to $1,778.1B. That marks a decade-low, due to currency fluctuations, particularly in Japan, and limited 5G monetization opportunities. In addition to stagnant revenues, telcos face high capex demands and fierce competition, emphasizing the need for strategic cost optimization beyond traditional methods like asset sell-offs and outsourcing. Getting opex under control is key.
Key findings of our telco opex study include:
Total opex fell by 1.0% in 2023, but opex excluding depreciation and amortization (D&A) declined by 0.5%, or about the same rate of decline as revenues. The difference is D&A, which fell at the much steeper clip of 3% in 2023.
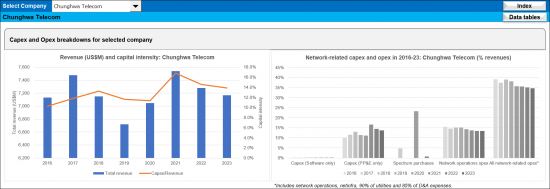
- Network-related opex, encompassing operations, leasing, utilities, and D&A, constitutes 50.8% of total opex, with significant company-specific variations.
- Network operations costs rose from 16.5% of opex in 2016 to 18.4% in 2023. Network leasing opex declined several years ago due to new accounting rules (IFRS 16) and are now steadily in the 3.0 to 3.5% range.
- Depreciation and amortization, the largest opex category, grew to 23.4% of opex in 2023.
- Labor costs, accounting for over 16% of opex, are rising as telcos compete for digital talent and embrace automation. As a percentage of total opex, labor costs increased from 16.2% in 2016 to 17.4% in 2023.
The report underscores the need for telcos to standardize opex tracking and implement transformative measures to enhance profitability. By benchmarking costs and uncovering inefficiencies, telcos and vendors can better navigate industry challenges and opportunities.
*Companies included: Advanced Info Service (AIS), Airtel, Batelco, BT, Charter Communications, China Mobile, Chunghwa Telecom, Du, Etisalat, Globe Telecom, KDDI, KPN, LG Uplus, Megafon, MTN Group, Oi, Ooredoo, Orange, PLDT, Proximus, Saudi Telecom (STC), Singtel, SK Telecom, Starhub, Swisscom, Tata Communications, Telecom Argentina, Telecom Italia, Telkom Indonesia, Telus, Turk Telekom, and Veon.
Operator coverage:
|
|
Table of Contents
- 1. Report Highlights
- 2. Abstract
- 3. Results for Group of 32 Telcos
- 4. Results by Company
- 5. Taxonomy
- 6. About