|
시장보고서
상품코드
1881278
에너지 및 지속가능성 추적 조사 - 통신사업자(2025년) : Teral Research와의 새로운 공동 조사 - 2024년 통신사업자 에너지 사용량은 정체되었으나, 재생에너지의 도입과 Scope 3 노력에 의해 온실가스 배출량은 다시 감소Energy & Sustainability Tracker - Telcos, 2025: New Joint Study with Teral Research - Telco Energy Use Flatlined in 2024, but GHG Emissions Fell Again Due to Renewables and Scope 3 Efforts |
||||||
기후 변화는 점점 더 심각해지고 있으며, 모든 산업이 이 문제를 해결해야 합니다. ICT 분야도 예외는 아닙니다. ICT 분야에서 네트워크 사업자는 막대한 에너지를 소비하고 막대한 탄소발자국을 남기고 있습니다. ICT의 성장은 클라우드와 AI를 위한 데이터센터에 투자하는 웹스케일 사업자(하이퍼스케일러)에 의해 주도되고 있지만, 에너지 측면에서는 통신사업자가 더 큰 문제에 직면해 있습니다. 2024년 통신 사업자는 340.6 테라와트시(TWh), 즉 340,572기가와트시(GWh)의 에너지를 소비했습니다. 이는 웹스케일 사업자의 2배 이상에 해당합니다. 재생에너지 도입률이 낮기 때문에 통신사업자의 탄소발자국은 몇 배나 큰 상황입니다. 네트워크 사업의 지속가능성을 높이기 위해서는 통신사업자의 노력이 가장 중요합니다.
경제적인 측면도 중요합니다. 통신사들은 평균적으로 OPEX의 4-5%를 에너지에 지출하고 있으며, 10% 이상을 지출하는 기업도 있습니다. 이러한 비용의 변동성이 주요 관심사입니다. 자연재해, 전쟁, 무역 제한은 모두 탄소 기반 에너지 가격에 영향을 미칩니다. 기후 변화 자체도 기상이변 증가와 인구 이동으로 인해 수입 화석연료에 대한 의존도를 높입니다. 반면, 지역 풍력, 태양광, 수력 등 재생에너지는 가격이 더 안정적인 경향이 있습니다. 따라서 탄소중립으로의 전환은 평균적인 통신 사업자의 비용 모델을 안정화시킬 수 있습니다.
비주얼
이 보고서는 통신 산업의 에너지 사용량과 지속가능성에 대한 상세한 평가를 제공합니다. 세계 시장의 약 85%를 차지하는 66개 통신사업자를 대상으로 에너지 소비량, 재생에너지 이용 현황, 배출량 등을 분석합니다. 전 세계 산업 전반을 검증하고, 모든 기업의 사용량, 효율성, 배출량 지표를 제시합니다. 또한 리더 기업, 최근 개선된 기업, 효율성과 재생에너지 비율 향상을 위해 공급업체의 지원이 필요한 후발주자 기업 등을 파악할 수 있는 순위도 포함되어 있습니다.
또한 총 66개 통신사업자에 대해 ESG 보고서에 기반한 에너지 사용량 및 Scope 1, 2 배출량 데이터를 제시하고 있습니다. 이 중 50개사는 충분한 Scope 3 데이터를 공개하고 있으며, 밸류체인 분석이 가능합니다. 또한 32개사는 트래픽 데이터를 공개하고 있으며, 에너지 소비 단위당 전송량 등의 지표 분석을 실현하고 있습니다.
본 분석은 MTN컨설팅이 지난 5년간 지속해 온 통신사업자 에너지 이용 연구의 연장선상에 있다고 할 수 있습니다. 이 조사는 2025년 6월까지 시장 데이터를 포함한 자체 Telco Financial Tracker를 기반으로 합니다. 또한 이 보고서를 위해 새롭게 수집한 재무 데이터(2019-2024년 총 66개 기업의 순유동자산을 포함)로 보완되었습니다.
MTN Consulting과 Teral Research의 제휴
이 보고서는 새로운 서비스인 TES(Telecom Energy &Sustainability)의 킥오프 제품입니다. TES는 MTNC와 Teral Research(TR)의 공동 서비스입니다.
대상 조직 :
|
|
목차
제1장 개요
제2장 분석
제3장 세계 시장의 결과
제4장 기업실적
제5장 순위
제6장 로 데이터
제7장 MTN Consulting, LLC 소개
KSA 25.12.12Why this report
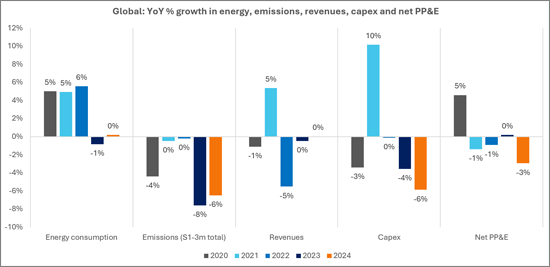
Climate change is worsening, and every sector must help meet this challenge. The ICT sector is no exception. Within ICT, network operators consume enormous amounts of energy and have a massive carbon footprint. While the growth in ICT comes from webscale operators (aka hyperscalers) investing in data centers for cloud and AI, the telco sector remains a larger energy problem. In 2024, telcos consumed 340.6 Terawatt hours (TWh) of energy, or 340,572 GWh. That's more than double that of webscale. The telco carbon footprint is also multiple times larger, due to a weaker adoption rate of renewables. For the networking business to improve its sustainability, the telco sector needs the most attention.
Economics also matter. Telcos spend an average of 4-5% of their operating expenses on energy, with some spending over 10%. The volatility of these costs is a primary concern. Natural disasters, war, and trade restrictions can all impact the price of carbon-based energy. Climate change itself, by intensifying extreme weather and causing population displacement, will make reliance on imported carbon sources even riskier. In contrast, renewable energy from local wind, solar, or hydro sources tends to have more stable prices. The march toward carbon neutrality could therefore also stabilize the cost model for the average telco.
VISUALS

Report overview
This report provides a detailed assessment of energy usage and sustainability in the telecommunications industry. We analyze energy consumption, renewable use, and emissions for 66 telcos representing about 85% of the global market. We examine the global industry and present metrics on usage, efficiency, and emissions for all companies. The report includes rankings to highlight leaders and recent improvers, as well as laggards, who often need supplier help to boost efficiency and renewability.
For all 66 telcos, we present data on energy use and Scope 1 and 2 emissions, based on their ESG reports. A subset of 50 companies also report enough Scope 3 data to allow for a value chain analysis. A subset of 32 publish traffic data, which lets us analyze traffic carried per unit of energy consumed and similar metrics.
This analysis extends MTN Consulting's research into network operator energy use, which began five years ago. The study relies on our proprietary telco financial tracker, with market data through June 2025. It is supplemented by new financial data gathered for this report, including Net PP&E for all 66 telcos from 2019 to 2024.
Scope and limitations
This report analyzes telecom operators, or telcos. These companies provide access-based services directly to end users, based on ownership of spectrum or regulator-issued licenses. This includes fixed, mobile, cable TV, and satellite providers. Our sample of 66 telcos is large and representative across all regions and segments. We are confident this is the best resource available for tracking energy use in the telco industry.
The telco business model has evolved, but most moves outside the core market have been reversed or failed to scale, as seen with AT&T's acquisition and subsequent spinoff of Time Warner. Some telcos are part of larger corporate groups and own infrastructure beyond telecom networks, like data centers or retail shops. However, almost all energy a telco consumes is tied directly to its network infrastructure, usually 80-90% of the total. For a mobile operator, the RAN alone is often 50-60% or more of total energy use. Data centers typically account for less than 10% of consumption, though this can reach 20-30% and may climb as Telco AI deployments mature.
Our database focuses on pure telcos or the telco division of a larger entity. In a few cases, like Softbank and Comcast, we must use corporate-level energy data because that is all they report. However, we only include financial metrics for their telco operations. Consequently, metrics like energy used per unit of revenue may be slightly overstated for these two companies.
Data and methodology
For the 66 telcos in this report, we present financial metrics alongside energy-related indicators: total energy and electricity consumption, renewable energy share, and greenhouse gas emissions by type. Data covers 2019-2024.
Compiling a consistent dataset was challenging. Unlike financial reporting, energy disclosures lack clear standards. Companies vary widely in what they report, and ESG data are not always audited. We reviewed dozens of sustainability reports, relying on verified data where possible and estimating where necessary to create comparable time series. We believe this is the most objective and comprehensive review of its kind.
Financial data is sourced from our latest Telco Tracker, supplemented with newly collected Net PP&E data. Energy and emissions figures are generally "as reported," but we made estimates in some cases. For instance, some companies do not report full historical Scope 3 data. We have energy and Scope 1-2 data for all 66 telcos. Scope 3 data is available for 50, and traffic data for 32.
A company can claim renewable electricity use when it (1) generates renewable power on-site; (2) purchases renewable electricity from the grid and retains the associated renewable energy certificates (RECs); (3) owns off-site renewable generation and retires the RECs; or (4) signs purchased power agreements (PPAs) with third-party suppliers of green power, and then also transfer the RECs.
When companies update their historical data, we modify our database to reflect this, as updates usually stem from improved methodologies. We do not restate data if it would change the reported scope.
A note on public vs. private companies
In telecom, nearly all major companies are public and now issue some form of ESG report. The quality and transparency vary, but few sizable telcos report no energy data. Our experience in reviewing hundreds of these reports helps us judge data credibility and make necessary estimates.
One caveat: our focus on public companies introduces a small reporting bias. Public companies face greater pressure to use renewables and commit to emissions reductions. The companies we do not track, which are often private, likely have weaker environmental records. Altice Europe and BSNL are examples. There is a minor issue with Scope 3 emissions as well: the companies that do not publish a full set of reliable scope 3 stats may be less environmentally friendly than the average. However, when we estimate global Scope 3 totals, we assume missing companies have the same average footprint as those included. This means we are likely slightly underestimating the telecom industry's environmental problem.
MTN Consulting Partnership with Teral Research
This report is the kickoff product for a new service called Telecom Energy & Sustainability (TES). TES is a collaboration between MTNC and Teral Research (TR).
Organizations covered:
|
|
