|
시장보고서
상품코드
1761778
적응 광학 시장 : 산업 분석, 시장 규모, 점유율, 성장, 동향, 예측(2025-2032년)Adaptive Optics Market: Global Industry Analysis, Size, Share, Growth, Trends, and Forecast, 2025 - 2032 |
||||||
Persistence Market Research사는 최근 세계의 적응 광학 시장에 관한 종합적인 보고서를 발표했습니다. 본 보고서는 시장 촉진요인, 동향, 기회, 촉진요인, 과제 등의 중요한 시장 역학을 철저히 평가하여 시장 구조에 대한 상세한 인사이트를 제공하고 있습니다. 이 조사 리포트는, 2025-2032년 세계 적응 광학 시장의 예측 성장 궤도를 개략적으로 설명하는 독점 데이터 및 통계를 게재하고 있습니다.
주요 인사이트
- 적응 광학 시장 규모(2025년) : 18억 9,650만 달러
- 시장 규모 예측(금액 기준, 2032년) : 89억 9,270만 달러
- 세계 시장 성장률(CAGR, 2025-2032년) : 24.9%
적응 광학 시장 : 분석 범위
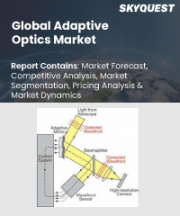
적응 광학은 파면 왜곡의 영향을 줄임으로써 광학 시스템의 성능을 높이기 위해 사용되는 최첨단 기술입니다. 천문, 현미경, 안과, 방위 용도에서 중요한 역할을 하고 있으며, 광학 수차를 실시간으로 보정함으로써 보다 선명한 화상과 시스템 성능의 향상을 실현하고 있습니다. 적응 광학 시장은 천문대, 생물의학 이미징 센터, 군사시설, 연구기관에 대응하고 있으며, 파면센서, 변형미러, 제어 시스템 등 폭넓은 컴포넌트를 제공하고 있습니다. 시장 성장의 원동력은, 고해상도 이미징 시스템 수요 증가, 방위 감시 진보, 생체 의료 진단 및 레이저 통신 시스템에서 적응 광학의 채용 확대입니다.
시장 성장 촉진요인 :
세계의 적응 광학 시장은 방위 및 보안 용도 분야에서 높은 정밀도 이미징 및 타겟팅 요구 증가와 같은 여러 주요 요인에 의해 추진되고 있습니다. 대기 왜곡을 보정하기 위한 천체 망원경에서의 보상 광학의 이용 확대가 관측 능력을 대폭 향상시켜, 첨단 천문대에 대한 투자를 촉진하고 있습니다. 헬스케어 분야에서는, 적응 광학은 지금까지 없었던 선명함을 제공하는 것으로 안과와 망막 이미징에 혁명을 가져왔고, 질병의 조기 발견에 도움이 되고 있습니다. 게다가 항공 우주나 통신 업계에서는, 적응 광학을 레이저 빔 쉐이핑이나 프리 스페이스 광통신 시스템과 통합하는 것으로, 보다 광범위한 시장 도입이 촉진되고 있습니다. 적응 광학 시스템의 소형화, 비용 절감을 위한 지속적인 연구 개발 노력에 의해, 이 기술은 보다 많은 분야에서 이용하기 쉬워지고 있습니다.
시장 성장 억제요인 :
적응 광학 시장은 강력한 성장 전망에도 불구하고 시스템의 복잡성, 기술적 장벽, 도입 비용 상승에 관한 과제에 직면하고 있습니다. 적응 광학 솔루션은 정밀한 엔지니어링 및 인테그레이션을 필요로 하기 때문에 소규모 조직이나 비용 중시 용도로 도입이 제한될 수 있습니다. 또한 표준화가 한정되어 있어 시스템의 교정이나 유지보수에 전문적인 지식이 필요하기 때문에 운용상의 과제도 있습니다. 소비자용 전자기기 및 일반 헬스케어 등 특정 분야에서의 상품화 속도가 느린 것도 시장 확대에 방해가 되고 있습니다. 이러한 허들에 대처하기 위해서는 비용의 최적화, 노동력 트레이닝, 기술의 통합과 확장성을 합리화하기 위한 타업종 콜라보레이션에 중점적으로 임할 필요가 있습니다.
시장 기회 :
적응 광학 시장은 기술 혁신, 우주 탐사 수요 증가, 고도 감시 시스템의 필요성에 의해 큰 성장 기회가 가져옵니다. 자율주행차, 3D 센싱, AR(증강현실) 등의 새로운 용도는 적응 광학이 제공하는 정확도의 혜택을 받을 가능성이 있습니다. 바이오 메디컬 이미징에서는, 컴팩트하고 저렴한 가격의 임상용 보상 광학 솔루션을 목표로 한 혁신이, 학술이나 연구 환경 이외에도 시장을 확대하고 있습니다. 또한 방위 능력을 근대화하고 천문 연구 프로그램을 지원하기 위한 정부의 노력과 민관 파트너십이 시장 투자를 뒷받침할 것으로 보입니다. 전략적 제휴, 제품 혁신, 수직 통합은, 급속히 발전하는 이 분야에서 새로운 기회를 포착해, 경쟁 우위성을 유지하기 위한 열쇠가 됩니다.
이 보고서에서 답변을 얻을 수 있는 주요 질문
- 세계 적응 광학 시장의 성장을 가속하는 주된 요인은 무엇인가?
- 다양한 분야에서 채용을 리드하고 있는 컴포넌트의 유형 및 용도는 무엇인가?
- 기술 진보는 적응 광학 기기 시장 경쟁 구도를 어떻게 바꾸고 있는가?
- 적응 광학 시장에 공헌하고 있는 주요 기업은 어디이며, 또 시장의 관련성을 유지하기 위해 어떠한 전략을 채용하고 있는가?
- 세계 적응 광학 시장의 새로운 동향 및 전망은?
목차
제1장 주요 요약
제2장 시장 개요
- 시장 범위 및 분류
- 시장의 정의, 범위 및 제한
제3장 시장 배경
- 시장 역학
- 시나리오 예측
- 기회 맵 분석
- 제품 수명주기 분석
- 공급망 분석
- 투자 실현 가능성 매트릭스
- 밸류체인 분석
- PESTLE과 Porter's Five Forces 분석
- 규제 상황
- 지역 친시장 전망
- 생산 및 소비 통계
- 수입 및 수출 통계
제4장 세계의 적응 광학 시장 분석
- 과거 시장 규모 분석(금액 및 수량 기준, 2019-2024년)
- 현재 및 미래 시장 규모 예측(금액 및 수량 기준, 2025-2032년)
- 전년대비 성장 동향 분석
- 절대적 수익 기회 분석
제5장 세계의 적응 광학 시장 분석 : 컴포넌트별
- 서문 및 주요 분석 결과
- 과거 시장 규모 분석 : 컴포넌트별(금액 및 수량 기준, 2019-2024년)
- 현재 및 미래 시장 규모의 분석과 예측 : 컴포넌트별(금액 및 수량 기준, 2025-2032년)
- 파면 센서
- 파면 변조기
- 제어 시스템
- 기타
- 전년대비 성장 동향 분석 : 컴포넌트별(2019-2024년)
- 절대적 수익 기회 분석 : 컴포넌트별(2025-2032년)
제6장 세계의 적응 광학 시장 분석 : 최종 용도 산업별
- 서문 및 주요 분석 결과
- 과거 시장 규모 분석 : 최종 용도 산업별(금액 및 수량 기준, 2019-2024년)
- 현재 및 미래 시장 규모의 분석 및 예측 : 최종 용도 산업별(금액 및 수량 기준, 2025-2032년)
- 가전제품
- 헤드 마운트 디스플레이
- 카메라 렌즈
- 기타 가전제품
- 천문학
- 바이오메디컬
- 안과
- 생물의학 현미경 검사
- 세포 분석
- 기타 용도
- 군 및 방위
- 레이저 방위 시스템
- 생체인증 보안
- 감시
- 기타 용도
- 공업제조업
- 정밀 제조
- 머신 비전
- 3D 프린팅
- 기타 용도
- 통신 및 기타
- 자유 공간 광통신
- 센싱
- 기타 용도
- 가전제품
- 전년대비 성장 동향 분석 : 최종 용도 산업별(2019-2024년)
- 절대적 수익 기회 분석 : 최종 용도 산업별(2025-2032년)
제7장 세계의 적응 광학 시장 분석 : 지역별
- 서문 및 주요 분석 결과
- 과거 시장 규모 분석 : 지역별(금액 및 수량 기준, 2019-2024년)
- 현재 시장 규모의 분석 및 예측 : 지역별(금액 및 수량 기준, 2025-2032년)
- 북미
- 라틴아메리카
- 유럽
- 아시아태평양
- 중동 및 아프리카
- 지역별 시장 매력 분석
제8장 북미의 적응 광학 시장 분석 : 국가별
제9장 라틴아메리카의 적응 광학 시장 분석 : 국가별
제10장 유럽의 적응 광학 시장 분석 : 국가별
제11장 아시아태평양의 적응 광학 시장 분석 : 국가별
제12장 중동 및 아프리카의 적응 광학 시장 분석 : 국가별
제13장 주요국의 적응 광학 시장 분석
- 미국
- 캐나다
- 브라질
- 멕시코
- 독일
- 영국
- 프랑스
- 스페인
- 이탈리아
- 중국
- 일본
- 한국
- 싱가포르
- 태국
- 인도네시아
- 호주
- 뉴질랜드
- GCC 국가
- 남아프리카
- 이스라엘
제14장 시장 구조 분석
- 경쟁 대시보드
- 경쟁 벤치마킹
- 주요 기업의 시장 점유율 분석
제15장 경쟁 분석
- 경쟁의 상세
- Teledyne e2v
- Northrop Grumman Corporation
- Thorlabs Inc.
- Iris AO, Inc.
- Adaptica SRL
- Active Optical Systems LLC
- OKO Technologies
- Imagine Optic Sa
- Boston Micromachines Corporation
- Phasics CORP
제16장 전제 및 사용되는 약어
제17장 조사 방법
AJY 25.07.10Persistence Market Research has recently released a comprehensive report on the worldwide market for adaptive optics. The report offers a thorough assessment of crucial market dynamics, including drivers, trends, opportunities, and challenges, providing detailed insights into the market structure. This research publication presents exclusive data and statistics outlining the anticipated growth trajectory of the global adaptive optics market from 2025 to 2032.
Key Insights:
- Adaptive Optics Market Size (2025E): USD 1,896.5 Million
- Projected Market Value (2032F): USD 8,992.7 Million
- Global Market Growth Rate (CAGR 2025 to 2032): 24.9%
Adaptive Optics Market - Report Scope:
Adaptive optics is a cutting-edge technology used to enhance the performance of optical systems by reducing the effect of wavefront distortions. It plays a crucial role in astronomy, microscopy, ophthalmology, and defense applications, enabling real-time correction of optical aberrations to deliver sharper images and improved system performance. The adaptive optics market caters to observatories, biomedical imaging centers, military installations, and research institutions, offering a wide range of components, including wavefront sensors, deformable mirrors, and control systems. Market growth is driven by increasing demand for high-resolution imaging systems, defense surveillance advancements, and the growing adoption of adaptive optics in biomedical diagnostics and laser communication systems.
Market Growth Drivers:
The global adaptive optics market is propelled by several key factors, including the rising need for precision imaging and targeting in defense and security applications. The expanding use of adaptive optics in astronomical telescopes to correct atmospheric distortions has significantly improved observational capabilities, driving investments in advanced observatories. In the healthcare sector, adaptive optics is revolutionizing ophthalmology and retinal imaging by offering unprecedented clarity, aiding in early disease detection. Furthermore, the integration of adaptive optics with laser beam shaping and free-space optical communication systems in aerospace and telecommunications industries is fostering broader market adoption. Ongoing R&D efforts to miniaturize and reduce the cost of adaptive optics systems are making the technology accessible across more sectors.
Market Restraints:
Despite the strong growth outlook, the adaptive optics market faces challenges related to high system complexity, technical barriers, and elevated costs of deployment. Adaptive optics solutions require precision engineering and integration, which can limit their adoption among smaller organizations and in cost-sensitive applications. Additionally, limited standardization and the need for specialized expertise in system calibration and maintenance pose operational challenges. The slow rate of commercialization in certain segments, such as consumer electronics and general healthcare, hampers market expansion. Addressing these hurdles requires focused efforts in cost optimization, workforce training, and cross-industry collaboration to streamline technology integration and scalability.
Market Opportunities:
The adaptive optics market presents substantial growth opportunities driven by technological innovation, increasing demand for space exploration, and the need for advanced surveillance systems. Emerging applications in autonomous vehicles, 3D sensing, and augmented reality could benefit from the precision offered by adaptive optics. In biomedical imaging, innovations aimed at compact and affordable adaptive optics solutions for clinical use are expanding the market beyond academic and research settings. Moreover, government initiatives and public-private partnerships to modernize defense capabilities and support astronomical research programs are expected to boost market investments. Strategic alliances, product innovation, and vertical integration are key to capturing emerging opportunities and maintaining competitive advantage in this rapidly evolving field.
Key Questions Answered in the Report:
- What are the primary factors driving the growth of the adaptive optics market globally?
- Which component types and applications are leading adoption across different sectors?
- How are technological advancements reshaping the competitive landscape of the adaptive optics market?
- Who are the key players contributing to the adaptive optics market, and what strategies are they employing to maintain market relevance?
- What are the emerging trends and future prospects in the global adaptive optics market?
Competitive Intelligence and Business Strategy:
Collaborations with space agencies, research universities, and military contractors facilitate product validation and drive widespread adoption. Additionally, efforts to expand into untapped markets through tailored solutions, such as portable ophthalmic devices and compact astronomical systems, are expected to enhance market reach and profitability. Commitment to performance optimization, customization, and user training contributes to sustained market leadership in the adaptive optics ecosystem.
Key Companies Profiled:
- Teledyne e2v
- Northrop Grumman Corporation
- Thorlabs Inc.
- Iris AO Inc.
- Adaptica S.R.L.
- Active Optical Systems LLC
- OKO Technologies
- Imagine Optic Sa
- Boston Micromachines Corporation
- Phasics CORP Etron Technology Inc.
Adaptive Optics Market Research Segmentation:
The adaptive optics market encompasses a diverse range of components, applications, end-use industries, and regional markets, supporting precision imaging and sensing across multiple sectors.
By Component:
- Wavefront Sensor
- Wavefront Modulator
- Control System
- Others
By End-use Industry:
- Consumer
- Head-Mounted Display
- Camera Lenses
- Other Consumer Devices
- Astronomy
- Bio-Medical
- Ophthalmology
- Biomedical Microscopy
- Cell Analysis
- Other Applications
- Military & Defense
- Laser Defense System
- Biometric Security
- Surveillance
- Other Applications
- Industrial Manufacturing
- Precision Manufacturing
- Machine Vision
- 3D Printing
- Other Applications
- Communication & Others
- Free-Space Optical Communications
- Sensing
- Other Applications
By Region:
- North America
- Europe
- Asia Pacific
- Latin America
- Middle East & Africa
Table of Contents
1. Executive Summary
- 1.1. Global Market Outlook
- 1.2. Demand-side Trends
- 1.3. Supply-side Trends
- 1.4. Technology Roadmap Analysis
- 1.5. Analysis and Recommendations
2. Market Overview
- 2.1. Market Coverage / Taxonomy
- 2.2. Market Definition / Scope / Limitations
3. Market Background
- 3.1. Market Dynamics
- 3.1.1. Drivers
- 3.1.2. Restraints
- 3.1.3. Opportunity
- 3.1.4. Trends
- 3.2. Scenario Forecast
- 3.2.1. Demand in Optimistic Scenario
- 3.2.2. Demand in Likely Scenario
- 3.2.3. Demand in Conservative Scenario
- 3.3. Opportunity Map Analysis
- 3.4. Product Life Cycle Analysis
- 3.5. Supply Chain Analysis
- 3.5.1. Supply Side Participants and their Roles
- 3.5.1.1. Producers
- 3.5.1.2. Mid-Level Participants (Traders/ Agents/ Brokers)
- 3.5.1.3. Wholesalers and Distributors
- 3.5.2. Value Added and Value Created at Node in the Supply Chain
- 3.5.3. List of Raw Material Suppliers
- 3.5.4. List of Existing and Potential Buyer's
- 3.5.1. Supply Side Participants and their Roles
- 3.6. Investment Feasibility Matrix
- 3.7. Value Chain Analysis
- 3.7.1. Profit Margin Analysis
- 3.7.2. Wholesalers and Distributors
- 3.7.3. Retailers
- 3.8. PESTLE and Porter's Analysis
- 3.9. Regulatory Landscape
- 3.9.1. By Key Regions
- 3.9.2. By Key Countries
- 3.10. Regional Parent Market Outlook
- 3.11. Production and Consumption Statistics
- 3.12. Import and Export Statistics
4. Global Adaptive Optics Market Analysis 2019-2024 and Forecast, 2025-2032
- 4.1. Historical Market Size Value (US$ billion) & Volume (Units) Analysis, 2019-2024
- 4.2. Current and Future Market Size Value (US$ billion) & Volume (Units) Projections, 2025-2032
- 4.2.1. Y-o-Y Growth Trend Analysis
- 4.2.2. Absolute $ Opportunity Analysis
5. Global Adaptive Optics Market Analysis 2019-2024 and Forecast 2025-2032, By Component
- 5.1. Introduction / Key Findings
- 5.2. Historical Market Size Value (US$ billion) & Volume (Units) Analysis By Component, 2019-2024
- 5.3. Current and Future Market Size Value (US$ billion) & Volume (Units) Analysis and Forecast By Component, 2025-2032
- 5.3.1. Wavefront Sensor
- 5.3.2. Wavefront Modulator
- 5.3.3. Control System
- 5.3.4. Others
- 5.4. Y-o-Y Growth Trend Analysis By Component, 2019-2024
- 5.5. Absolute $ Opportunity Analysis By Component, 2025-2032
6. Global Adaptive Optics Market Analysis 2019-2024 and Forecast 2025-2032, By End-Use Industry
- 6.1. Introduction / Key Findings
- 6.2. Historical Market Size Value (US$ billion) & Volume (Units) Analysis By End-Use Industry, 2019-2024
- 6.3. Current and Future Market Size Value (US$ billion) & Volume (Units) Analysis and Forecast By End-Use Industry, 2025-2032
- 6.3.1. Consumer
- 6.3.1.1. Head-Mounted Display
- 6.3.1.2. Camera Lenses
- 6.3.1.3. Other Consumer Devices
- 6.3.2. Astronomy
- 6.3.3. Bio-Medical
- 6.3.3.1. Ophthalmology
- 6.3.3.2. Biomedical Microscopy
- 6.3.3.3. Cell Analysis
- 6.3.3.4. Other Applications
- 6.3.4. Military & Defense
- 6.3.4.1. Laser Defense System
- 6.3.4.2. Biometric Security
- 6.3.4.3. Surveillance
- 6.3.4.4. Other Applications
- 6.3.5. Industrial Manufacturing
- 6.3.5.1. Precision Manufacturing
- 6.3.5.2. Machine Vision
- 6.3.5.3. 3D Printing
- 6.3.5.4. Other Applications
- 6.3.6. Communication & Others
- 6.3.6.1. Free-Space Optical Communications
- 6.3.6.2. Sensing
- 6.3.6.3. Other Applications
- 6.3.1. Consumer
- 6.4. Y-o-Y Growth Trend Analysis By End-Use Industry, 2019-2024
- 6.5. Absolute $ Opportunity Analysis By End-Use Industry, 2025-2032
7. Global Adaptive Optics Market Analysis 2019-2024 and Forecast 2025-2032, By Region
- 7.1. Introduction
- 7.2. Historical Market Size Value (US$ billion) & Volume (Units) Analysis By Region, 2019-2024
- 7.3. Current Market Size Value (US$ billion) & Volume (Units) Analysis and Forecast By Region, 2025-2032
- 7.3.1. North America
- 7.3.2. Latin America
- 7.3.3. Europe
- 7.3.4. Asia Pacific
- 7.3.5. Middle East and Africa
- 7.4. Market Attractiveness Analysis By Region
8. North America Adaptive Optics Market Analysis 2019-2024 and Forecast 2025-2032, By Country
- 8.1. Historical Market Size Value (US$ billion) & Volume (Units) Trend Analysis By Market Taxonomy, 2019-2024
- 8.2. Market Size Value (US$ billion) & Volume (Units) Forecast By Market Taxonomy, 2025-2032
- 8.2.1. By Country
- 8.2.1.1. USA
- 8.2.1.2. Canada
- 8.2.2. By Component
- 8.2.3. By End-Use Industry
- 8.2.1. By Country
- 8.3. Market Attractiveness Analysis
- 8.3.1. By Country
- 8.3.2. By Component
- 8.3.3. By End-Use Industry
- 8.4. Key Takeaways
9. Latin America Adaptive Optics Market Analysis 2019-2024 and Forecast 2025-2032, By Country
- 9.1. Historical Market Size Value (US$ billion) & Volume (Units) Trend Analysis By Market Taxonomy, 2019-2024
- 9.2. Market Size Value (US$ billion) & Volume (Units) Forecast By Market Taxonomy, 2025-2032
- 9.2.1. By Country
- 9.2.1.1. Brazil
- 9.2.1.2. Mexico
- 9.2.1.3. Rest of Latin America
- 9.2.2. By Component
- 9.2.3. By End-Use Industry
- 9.2.1. By Country
- 9.3. Market Attractiveness Analysis
- 9.3.1. By Country
- 9.3.2. By Component
- 9.3.3. By End-Use Industry
- 9.4. Key Takeaways
10. Europe Adaptive Optics Market Analysis 2019-2024 and Forecast 2025-2032, By Country
- 10.1. Historical Market Size Value (US$ billion) & Volume (Units) Trend Analysis By Market Taxonomy, 2019-2024
- 10.2. Market Size Value (US$ billion) & Volume (Units) Forecast By Market Taxonomy, 2025-2032
- 10.2.1. By Country
- 10.2.1.1. Germany
- 10.2.1.2. United Kingdom
- 10.2.1.3. France
- 10.2.1.4. Spain
- 10.2.1.5. Italy
- 10.2.1.6. Rest of Europe
- 10.2.2. By Component
- 10.2.3. By End-Use Industry
- 10.2.1. By Country
- 10.3. Market Attractiveness Analysis
- 10.3.1. By Country
- 10.3.2. By Component
- 10.3.3. By End-Use Industry
- 10.4. Key Takeaways
11. Asia Pacific Adaptive Optics Market Analysis 2019-2024 and Forecast 2025-2032, By Country
- 11.1. Historical Market Size Value (US$ billion) & Volume (Units) Trend Analysis By Market Taxonomy, 2019-2024
- 11.2. Market Size Value (US$ billion) & Volume (Units) Forecast By Market Taxonomy, 2025-2032
- 11.2.1. By Country
- 11.2.1.1. China
- 11.2.1.2. Japan
- 11.2.1.3. South Korea
- 11.2.1.4. Singapore
- 11.2.1.5. Thailand
- 11.2.1.6. Indonesia
- 11.2.1.7. Australia
- 11.2.1.8. New Zealand
- 11.2.1.9. Rest of Asia Pacific
- 11.2.2. By Component
- 11.2.3. By End-Use Industry
- 11.2.1. By Country
- 11.3. Market Attractiveness Analysis
- 11.3.1. By Country
- 11.3.2. By Component
- 11.3.3. By End-Use Industry
- 11.4. Key Takeaways
12. Middle East and Africa Adaptive Optics Market Analysis 2019-2024 and Forecast 2025-2032, By Country
- 12.1. Historical Market Size Value (US$ billion) & Volume (Units) Trend Analysis By Market Taxonomy, 2019-2024
- 12.2. Market Size Value (US$ billion) & Volume (Units) Forecast By Market Taxonomy, 2025-2032
- 12.2.1. By Country
- 12.2.1.1. Gulf Cooperation Council Countries
- 12.2.1.2. South Africa
- 12.2.1.3. Israel
- 12.2.1.4. Rest of Middle East and Africa
- 12.2.2. By Component
- 12.2.3. By End-Use Industry
- 12.2.1. By Country
- 12.3. Market Attractiveness Analysis
- 12.3.1. By Country
- 12.3.2. By Component
- 12.3.3. By End-Use Industry
- 12.4. Key Takeaways
13. Key Countries Adaptive Optics Market Analysis
- 13.1. USA
- 13.1.1. Pricing Analysis
- 13.1.2. Market Share Analysis, 2025
- 13.1.2.1. By Component
- 13.1.2.2. By End-Use Industry
- 13.2. Canada
- 13.2.1. Pricing Analysis
- 13.2.2. Market Share Analysis, 2025
- 13.2.2.1. By Component
- 13.2.2.2. By End-Use Industry
- 13.3. Brazil
- 13.3.1. Pricing Analysis
- 13.3.2. Market Share Analysis, 2025
- 13.3.2.1. By Component
- 13.3.2.2. By End-Use Industry
- 13.4. Mexico
- 13.4.1. Pricing Analysis
- 13.4.2. Market Share Analysis, 2025
- 13.4.2.1. By Component
- 13.4.2.2. By End-Use Industry
- 13.5. Germany
- 13.5.1. Pricing Analysis
- 13.5.2. Market Share Analysis, 2025
- 13.5.2.1. By Component
- 13.5.2.2. By End-Use Industry
- 13.6. United Kingdom
- 13.6.1. Pricing Analysis
- 13.6.2. Market Share Analysis, 2025
- 13.6.2.1. By Component
- 13.6.2.2. By End-Use Industry
- 13.7. France
- 13.7.1. Pricing Analysis
- 13.7.2. Market Share Analysis, 2025
- 13.7.2.1. By Component
- 13.7.2.2. By End-Use Industry
- 13.8. Spain
- 13.8.1. Pricing Analysis
- 13.8.2. Market Share Analysis, 2025
- 13.8.2.1. By Component
- 13.8.2.2. By End-Use Industry
- 13.9. Italy
- 13.9.1. Pricing Analysis
- 13.9.2. Market Share Analysis, 2025
- 13.9.2.1. By Component
- 13.9.2.2. By End-Use Industry
- 13.10. China
- 13.10.1. Pricing Analysis
- 13.10.2. Market Share Analysis, 2025
- 13.10.2.1. By Component
- 13.10.2.2. By End-Use Industry
- 13.11. Japan
- 13.11.1. Pricing Analysis
- 13.11.2. Market Share Analysis, 2025
- 13.11.2.1. By Component
- 13.11.2.2. By End-Use Industry
- 13.12. South Korea
- 13.12.1. Pricing Analysis
- 13.12.2. Market Share Analysis, 2025
- 13.12.2.1. By Component
- 13.12.2.2. By End-Use Industry
- 13.13. Singapore
- 13.13.1. Pricing Analysis
- 13.13.2. Market Share Analysis, 2025
- 13.13.2.1. By Component
- 13.13.2.2. By End-Use Industry
- 13.14. Thailand
- 13.14.1. Pricing Analysis
- 13.14.2. Market Share Analysis, 2025
- 13.14.2.1. By Component
- 13.14.2.2. By End-Use Industry
- 13.15. Indonesia
- 13.15.1. Pricing Analysis
- 13.15.2. Market Share Analysis, 2025
- 13.15.2.1. By Component
- 13.15.2.2. By End-Use Industry
- 13.16. Australia
- 13.16.1. Pricing Analysis
- 13.16.2. Market Share Analysis, 2025
- 13.16.2.1. By Component
- 13.16.2.2. By End-Use Industry
- 13.17. New Zealand
- 13.17.1. Pricing Analysis
- 13.17.2. Market Share Analysis, 2025
- 13.17.2.1. By Component
- 13.17.2.2. By End-Use Industry
- 13.18. Gulf Cooperation Council Countries
- 13.18.1. Pricing Analysis
- 13.18.2. Market Share Analysis, 2025
- 13.18.2.1. By Component
- 13.18.2.2. By End-Use Industry
- 13.19. South Africa
- 13.19.1. Pricing Analysis
- 13.19.2. Market Share Analysis, 2025
- 13.19.2.1. By Component
- 13.19.2.2. By End-Use Industry
- 13.20. Israel
- 13.20.1. Pricing Analysis
- 13.20.2. Market Share Analysis, 2025
- 13.20.2.1. By Component
- 13.20.2.2. By End-Use Industry
14. Market Structure Analysis
- 14.1. Competition Dashboard
- 14.2. Competition Benchmarking
- 14.3. Market Share Analysis of Top Players
- 14.3.1. By Regional
- 14.3.2. By Component
- 14.3.3. By End-Use Industry
15. Competition Analysis
- 15.1. Competition Deep Dive
- 15.1.1. Teledyne e2v
- 15.1.1.1. Overview
- 15.1.1.2. Product Portfolio
- 15.1.1.3. Profitability by Market Segments
- 15.1.1.4. Sales Footprint
- 15.1.1.5. Strategy Overview
- 15.1.1.5.1. Marketing Strategy
- 15.1.1.5.2. Product Strategy
- 15.1.1.5.3. Channel Strategy
- 15.1.2. Northrop Grumman Corporation
- 15.1.2.1. Overview
- 15.1.2.2. Product Portfolio
- 15.1.2.3. Profitability by Market Segments
- 15.1.2.4. Sales Footprint
- 15.1.2.5. Strategy Overview
- 15.1.2.5.1. Marketing Strategy
- 15.1.2.5.2. Product Strategy
- 15.1.2.5.3. Channel Strategy
- 15.1.3. Thorlabs Inc.
- 15.1.3.1. Overview
- 15.1.3.2. Product Portfolio
- 15.1.3.3. Profitability by Market Segments
- 15.1.3.4. Sales Footprint
- 15.1.3.5. Strategy Overview
- 15.1.3.5.1. Marketing Strategy
- 15.1.3.5.2. Product Strategy
- 15.1.3.5.3. Channel Strategy
- 15.1.4. Iris AO, Inc.
- 15.1.4.1. Overview
- 15.1.4.2. Product Portfolio
- 15.1.4.3. Profitability by Market Segments
- 15.1.4.4. Sales Footprint
- 15.1.4.5. Strategy Overview
- 15.1.4.5.1. Marketing Strategy
- 15.1.4.5.2. Product Strategy
- 15.1.4.5.3. Channel Strategy
- 15.1.5. Adaptica S.R.L.
- 15.1.5.1. Overview
- 15.1.5.2. Product Portfolio
- 15.1.5.3. Profitability by Market Segments
- 15.1.5.4. Sales Footprint
- 15.1.5.5. Strategy Overview
- 15.1.5.5.1. Marketing Strategy
- 15.1.5.5.2. Product Strategy
- 15.1.5.5.3. Channel Strategy
- 15.1.6. Active Optical Systems LLC
- 15.1.6.1. Overview
- 15.1.6.2. Product Portfolio
- 15.1.6.3. Profitability by Market Segments
- 15.1.6.4. Sales Footprint
- 15.1.6.5. Strategy Overview
- 15.1.6.5.1. Marketing Strategy
- 15.1.6.5.2. Product Strategy
- 15.1.6.5.3. Channel Strategy
- 15.1.7. OKO Technologies
- 15.1.7.1. Overview
- 15.1.7.2. Product Portfolio
- 15.1.7.3. Profitability by Market Segments
- 15.1.7.4. Sales Footprint
- 15.1.7.5. Strategy Overview
- 15.1.7.5.1. Marketing Strategy
- 15.1.7.5.2. Product Strategy
- 15.1.7.5.3. Channel Strategy
- 15.1.8. Imagine Optic Sa
- 15.1.8.1. Overview
- 15.1.8.2. Product Portfolio
- 15.1.8.3. Profitability by Market Segments
- 15.1.8.4. Sales Footprint
- 15.1.8.5. Strategy Overview
- 15.1.8.5.1. Marketing Strategy
- 15.1.8.5.2. Product Strategy
- 15.1.8.5.3. Channel Strategy
- 15.1.9. Boston Micromachines Corporation
- 15.1.9.1. Overview
- 15.1.9.2. Product Portfolio
- 15.1.9.3. Profitability by Market Segments
- 15.1.9.4. Sales Footprint
- 15.1.9.5. Strategy Overview
- 15.1.9.5.1. Marketing Strategy
- 15.1.9.5.2. Product Strategy
- 15.1.9.5.3. Channel Strategy
- 15.1.10. Phasics CORP
- 15.1.10.1. Overview
- 15.1.10.2. Product Portfolio
- 15.1.10.3. Profitability by Market Segments
- 15.1.10.4. Sales Footprint
- 15.1.10.5. Strategy Overview
- 15.1.10.5.1. Marketing Strategy
- 15.1.10.5.2. Product Strategy
- 15.1.10.5.3. Channel Strategy
- 15.1.1. Teledyne e2v