|
시장보고서
상품코드
1796408
폐기물 에너지화 시장 : 산업 동향과 세계 예측(-2035년) - 기술 유형, 폐기물 유형, 형태, 용도, 기업 규모, 주요 지역별Waste To Energy Market Till 2035: Distribution by Type of Technology, Type of Waste, Type of Form, Areas of Application, Company Size, and Key Geographical Regions: Industry Trends and Global Forecasts |
||||||
폐기물 에너지화 시장 : 개요
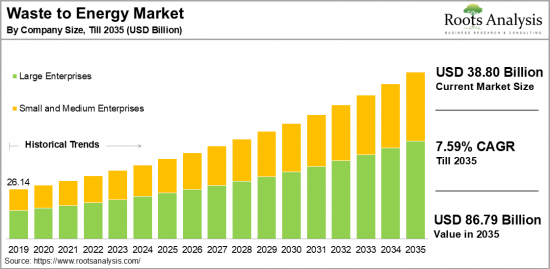
Roots Analysis에 따르면 세계의 폐기물 에너지화 시장 규모는 2035년까지의 예측 기간 중 CAGR 7.59%로, 현재 388억 달러에서 2035년까지 867억 9,000만 달러로 성장할 것으로 예측됩니다.

폐기물 에너지화 시장 기회: 분류
기술 유형
- 혐기성 소화
- 생화학 처리
- 소각
- 물리적 처리
- 열화학 처리
- 기타
폐기물 유형
- 농업 폐기물
- 도시 고형 폐기물(MSW)
- 기타
형태
- 전기
- 온수
- 증기
용도
- 에너지 생성
- 폐기물 처리
- 폐기물량 감소
- 기타
기업 규모
- 대기업
- 중소기업
지역
- 북미
- 미국
- 캐나다
- 멕시코
- 기타 북미 국가
- 유럽
- 오스트리아
- 벨기에
- 덴마크
- 프랑스
- 독일
- 아일랜드
- 이탈리아
- 네덜란드
- 노르웨이
- 러시아
- 스페인
- 스웨덴
- 스위스
- 영국
- 기타 유럽 국가
- 아시아
- 중국
- 인도
- 일본
- 싱가포르
- 한국
- 기타 아시아 국가
- 라틴아메리카
- 브라질
- 칠레
- 콜롬비아
- 베네수엘라
- 기타 라틴아메리카 국가
- 중동 및 북아프리카
- 이집트
- 이란
- 이라크
- 이스라엘
- 쿠웨이트
- 사우디아라비아
- 아랍에미리트
- 기타 중동 및 북아프리카 국가
- 세계 기타 지역
- 호주
- 뉴질랜드
- 기타 국가
폐기물 에너지화 시장 : 성장과 동향
일반적으로 '에너지 회수형 폐기물 처리'라고 불리는 폐기물 에너지화(WTE)은 열화학적, 생화학적 방법을 통해 도시 폐기물에서 에너지를 추출하여 전력, 증기, 연료를 생산하는 기술입니다. 이러한 첨단 기술을 통해 폐기물의 성질과 생성되는 에너지의 용도에 따라 원래의 폐기물 부피를 최대 90%까지 줄일 수 있습니다. WTE 플랜트에는 두 가지 주요 이점이 있습니다. 첫째, 환경 친화적인 폐기물 관리 및 처리 수단을 제공하는 것, 둘째, 깨끗한 전력을 생산하는 것입니다. 고형 및 액체 폐기물 처리 전략으로 WTE를 도입함으로써 도시 쓰레기 처리가 환경에 미치는 영향, 특히 온실 가스 배출 감소 측면에서 크게 감소하고 있습니다.
세계 인구 증가와 경제 발전으로 인해 에너지 수요가 증가함에 따라 WTE 시설은 그 수요를 충족시키는 데 필수적인 존재가 되었습니다. 이 플랜트들은 신뢰할 수 있는 재생에너지원으로 화석 연료에 대한 의존도를 효과적으로 낮출 수 있습니다. 또한 매립지 사용 감소와 온실가스 감축을 위한 각국 정부의 엄격한 규제 역시 폐기물 에너지화 프로그램의 확대를 부추기고 있습니다. 전반적으로 이러한 요인으로 인해 폐기물 에너지화 시장은 예측 기간 중 확대될 것으로 예측됩니다.
세계의 폐기물 에너지화 시장을 조사했으며, 시장 개요, 배경, 시장 영향요인의 분석, 시장 규모 추이·예측, 각종 구분·지역별 상세 분석, 경쟁 구도, 주요 기업의 개요 등을 정리하여 전해드립니다.
목차
섹션 I : 리포트 개요
제1장 서문
제2장 조사 방법
제3장 시장 역학
제4장 거시경제 지표
섹션 II : 정성적 인사이트
제5장 개요
제6장 서론
제7장 규제 시나리오
섹션 III : 시장 개요
제8장 주요 기업의 종합적 데이터베이스
제9장 경쟁 구도
제10장 화이트 스페이스 분석
제11장 기업의 경쟁력 분석
제12장 폐기물 에너지화 시장에서의 스타트업 에코시스템
섹션 IV : 기업 개요
제13장 기업 개요
- 챕터 개요
- A2A SpA
- Abu Dhabi National Energy
- Allseas
- AVR
- Babcock &Wilcox
- Biffa
- China Everbright Environment
- Covanta
- EDF
- Foster Wheeler
- Green Conversion Systems
- Hitachi Zosen
- Huawei
- JANSEN Combustion and Boiler
- Keppel Seghers
- Martin
- Mitsubishi Heavy
- MVV Energie
섹션 V : 시장 동향
제14장 메가트렌드 분석
제15장 미충족 요구 분석
제16장 특허 분석
제17장 최근 동향
섹션 VI : 시장 기회 분석
제18장 세계의 폐기물 에너지화 시장
제19장 기술별 시장 기회
제20장 폐기물 유형별 시장 기회
제21장 형태별 시장 기회
제22장 용도별 시장 기회
제23장 북미에서 폐기물 에너지화의 시장 기회
제24장 유럽에서 폐기물 에너지화의 시장 기회
제25장 아시아에서 폐기물 에너지화의 시장 기회
제26장 중동·북아프리카에서 폐기물 에너지화의 시장 기회
제27장 라틴아메리카에서 폐기물 에너지화의 시장 기회
제28장 세계의 기타 지역에서 폐기물 에너지화의 시장 기회
제29장 시장 집중 분석 : 주요 기업의 분포
제30장 인접 시장 분석
섹션 VII : 전략 툴
제31장 주요 승리 전략
제32장 Porter's Five Forces 분석
제33장 SWOT 분석
제34장 밸류체인 분석
제35장 ROOTS 전략 제안
섹션 VIII : 기타 독점적 인사이트
제36장 1차 조사로부터의 인사이트
제37장 보고서 결론
섹션 IX : 부록
제38장 표형식 데이터
제39장 기업·단체 리스트
제40장 커스터마이즈 기회
제41장 ROOTS 서브스크립션 서비스
제42장 저자 상세
KSA 25.09.01Waste To Energy Market Overview
As per Roots Analysis, the global waste to energy market size is estimated to grow from USD 38.80 billion in the current year to USD 86.79 billion by 2035, at a CAGR of 7.59% during the forecast period, till 2035.
The opportunity for waste to energy market has been distributed across the following segments:
Type of Technology
- Anaerobic Digestion
- Biochemical
- Incineration
- Physical
- Thermochemical
- Others
Type of Waste
- Agricultural Waste
- Municipal Solid Waste (MSW)
- Others
Type of Form
- Electricity
- Hot Water
- Steam
Areas of Application
- Generation of Energy
- Treatment of Waste
- Reduction of Waste Volume
- Others
Company Size
- Large Enterprises
- Small and Medium Enterprises
Geographical Regions
- North America
- US
- Canada
- Mexico
- Other North American countries
- Europe
- Austria
- Belgium
- Denmark
- France
- Germany
- Ireland
- Italy
- Netherlands
- Norway
- Russia
- Spain
- Sweden
- Switzerland
- UK
- Other European countries
- Asia
- China
- India
- Japan
- Singapore
- South Korea
- Other Asian countries
- Latin America
- Brazil
- Chile
- Colombia
- Venezuela
- Other Latin American countries
- Middle East and North Africa
- Egypt
- Iran
- Iraq
- Israel
- Kuwait
- Saudi Arabia
- UAE
- Other MENA countries
- Rest of the World
- Australia
- New Zealand
- Other countries
WASTE TO ENERGY MARKET: GROWTH AND TRENDS
Waste-to-Energy (WTE), commonly known as energy from waste, encompasses the utilization of thermochemical and biochemical techniques to harness energy from urban waste, resulting in electricity, steam, and fuels. These cutting-edge technologies can reduce the original waste volume by up to 90%, depending on the composition of the waste and the desired application of the energy generated. WTE plants offer two main benefits: they provide environmentally responsible waste management and disposal options while producing clean electricity. The growing implementation of WTE as a strategy for handling both solid and liquid waste has significantly alleviated the environmental impacts of municipal solid waste management, especially in terms of lowering greenhouse gas emissions.
The increase in global population and economic development has led to a rising demand for energy, making WTE facilities vital in fulfilling this requirement. These plants act as a reliable source of renewable energy, effectively reducing reliance on fossil fuels. Further, strict government regulations aimed at minimizing landfill usage and reducing greenhouse gas emissions further support the growth of waste-to-energy programs. Overall, owing to these factors, the waste to energy market is expected to increase during the forecast period.
WASTE TO ENERGY MARKET: KEY SEGMENTS
Market Share by Type of Technology
Based on type of technology, the global waste to energy market is segmented into anaerobic digestion, biochemical, incineration, physical, thermochemical and others. According to our estimates, currently, the incineration segment captures the majority share of the market. This can be attributed to effectiveness in minimizing waste volume while producing energy through high-temperature combustion. This method has become widely accepted and is favored for its reliability and capability to handle various waste types.
However, thermochemical technologies segment is expected to grow at a relatively higher CAGR during the forecast period. This can be attributed to the application of technologies such as gasification and pyrolysis in this segment. The improvements in efficiency and their correspondence with the rising demand for sustainable energy solutions are propelling market expansion.
Market Share by Type of Waste
Based on type of waste, the waste to energy market is segmented into agricultural waste, municipal solid waste (MSW), and others. According to our estimates, currently, the municipal solid waste (MSW) segment captures the majority of the market. This can be attributed to the significant availability and steady generation of this waste from households, businesses, and institutions. This segment is recognized for its capability to effectively transform waste into renewable energy while simultaneously decreasing landfill usage and greenhouse gas emissions.
However, the agricultural waste segment is expected to grow at a relatively higher CAGR during the forecast period. This can be attributed to the technological innovations that improve the efficiency of converting agricultural waste into energy, aligning with global trends towards renewable energy and sustainable waste management practices.
Market Share by Type of Form
Based on type of form, the waste to energy market is segmented into electricity, hot water and steam. According to our estimates, currently, the electricity segment captures the majority of the market. This can be attributed to the rising demand for sustainable energy options and the influence of government regulations that encourage renewable energy production from waste.
However, the hot water and steam segment is expected to grow at a relatively higher CAGR during the forecast period. This increase is due to the innovations in waste to energy technologies and growing uses in industrial processes that need thermal energy.
Market Share by Areas of Application
Based on areas of application, the waste to energy market is segmented into generation of energy, treatment of waste, reduction of waste volume and others. According to our estimates, currently, the generation of energy segment captures the majority of the market. This can be attributed to the global transition toward sustainable energy initiatives and rising government incentives to encourage eco-friendly practices.
However, the reduction of waste volume segment is expected to grow at a relatively higher CAGR during the forecast period. This increase is due to innovations in waste processing technologies that not only reduce waste but also aid in the generation of cleaner energy, thus promoting sustainability objectives.
Market Share by Company Size
Based on company size, the waste to energy market is segmented into large and small and medium enterprise. According to our estimates, currently, the large enterprise segment captures the majority of the market. However, small and medium-sized enterprises are expected to grow at a relatively higher CAGR during the forecast period. This can be attributed to their agility, innovative approaches, focus on specialized markets, and capacity to adapt to evolving customer demands and market dynamics.
Market Share by Geographical Regions
Based on geographical regions, the waste to energy market is segmented into North America, Europe, Asia, Latin America, Middle East and North Africa, and the rest of the world. According to our estimates, currently, Asia captures the majority share of the market. This increase can be attributed to the rising economic activities, which in turn have led to an increase in waste generation. Consequently, various Asian governments have established waste-to-energy facilities, further promoting the growth of the waste-to-energy sector.
Example Players in Waste to Energy Market
- A2A SpA
- Abu Dhabi National Energy
- Allseas
- AVR
- Babcock & Wilcox
- Biffa
- China Everbright Environment
- Covanta
- EDF
- Foster Wheeler
- Green Conversion Systems
- Hitachi Zosen
- Huawei
- JANSEN Combustion and Boiler
- Keppel Seghers
- Martin
- Mitsubishi Heavy
- MVV Energie
- Recology
- SUEZ
- Sims
- Stericycle
- Velocys
- Veolia Environnement
- Viridor
- Waste Connections
- Waste Management
- Wheelabrator Technologies
- WM Intellectual Property Holdings
- Xcel Energy
WASTE TO ENERGY MARKET: RESEARCH COVERAGE
The report on the waste to energy market features insights on various sections, including:
- Market Sizing and Opportunity Analysis: An in-depth analysis of the waste to energy market, focusing on key market segments, including [A] type of technology, [B] type of waste, [C] type of form, [D] areas of application, [E] company size, and [F] key geographical regions.
- Competitive Landscape: A comprehensive analysis of the companies engaged in the waste to energy market, based on several relevant parameters, such as [A] year of establishment, [B] company size, [C] location of headquarters and [D] ownership structure.
- Company Profiles: Elaborate profiles of prominent players engaged in the waste to energy market, providing details on [A] location of headquarters, [B] company size, [C] company mission, [D] company footprint, [E] management team, [F] contact details, [G] financial information, [H] operating business segments, [I] service / product portfolio, [J] moat analysis, [K] recent developments, and an informed future outlook.
- Megatrends: An evaluation of ongoing megatrends in the waste to energy industry.
- Patent Analysis: An insightful analysis of patents filed / granted in the waste to energy domain, based on relevant parameters, including [A] type of patent, [B] patent publication year, [C] patent age and [D] leading players.
- Porter's Five Forces Analysis: An analysis of five competitive forces prevailing in the waste to energy market, including threats of new entrants, bargaining power of buyers, bargaining power of suppliers, threats of substitute products and rivalry among existing competitors.
- Recent Developments: An overview of the recent developments made in the waste to energy market, along with analysis based on relevant parameters, including [A] year of initiative, [B] type of initiative, [C] geographical distribution and [D] most active players.
- SWOT Analysis: An insightful SWOT framework, highlighting the strengths, weaknesses, opportunities and threats in the domain. Additionally, it provides Harvey ball analysis, highlighting the relative impact of each SWOT parameter.
- Value Chain Analysis: A comprehensive analysis of the value chain, providing information on the different phases and stakeholders involved in the waste to energy market.
KEY QUESTIONS ANSWERED IN THIS REPORT
- How many companies are currently engaged in waste to energy market?
- Which are the leading companies in this market?
- What factors are likely to influence the evolution of this market?
- What is the current and future market size?
- What is the CAGR of this market?
- How is the current and future market opportunity likely to be distributed across key market segments?
REASONS TO BUY THIS REPORT
- The report provides a comprehensive market analysis, offering detailed revenue projections of the overall market and its specific sub-segments. This information is valuable to both established market leaders and emerging entrants.
- Stakeholders can leverage the report to gain a deeper understanding of the competitive dynamics within the market. By analyzing the competitive landscape, businesses can make informed decisions to optimize their market positioning and develop effective go-to-market strategies.
- The report offers stakeholders a comprehensive overview of the market, including key drivers, barriers, opportunities, and challenges. This information empowers stakeholders to stay abreast of market trends and make data-driven decisions to capitalize on growth prospects.
ADDITIONAL BENEFITS
- Complimentary Excel Data Packs for all Analytical Modules in the Report
- 15% Free Content Customization
- Detailed Report Walkthrough Session with Research Team
- Free Updated report if the report is 6-12 months old or older
TABLE OF CONTENTS
SECTION I: REPORT OVERVIEW
1. PREFACE
- 1.1. Introduction
- 1.2. Market Share Insights
- 1.3. Key Market Insights
- 1.4. Report Coverage
- 1.5. Key Questions Answered
- 1.6. Chapter Outlines
2. RESEARCH METHODOLOGY
- 2.1. Chapter Overview
- 2.2. Research Assumptions
- 2.3. Database Building
- 2.3.1. Data Collection
- 2.3.2. Data Validation
- 2.3.3. Data Analysis
- 2.4. Project Methodology
- 2.4.1. Secondary Research
- 2.4.1.1. Annual Reports
- 2.4.1.2. Academic Research Papers
- 2.4.1.3. Company Websites
- 2.4.1.4. Investor Presentations
- 2.4.1.5. Regulatory Filings
- 2.4.1.6. White Papers
- 2.4.1.7. Industry Publications
- 2.4.1.8. Conferences and Seminars
- 2.4.1.9. Government Portals
- 2.4.1.10. Media and Press Releases
- 2.4.1.11. Newsletters
- 2.4.1.12. Industry Databases
- 2.4.1.13. Roots Proprietary Databases
- 2.4.1.14. Paid Databases and Sources
- 2.4.1.15. Social Media Portals
- 2.4.1.16. Other Secondary Sources
- 2.4.2. Primary Research
- 2.4.2.1. Introduction
- 2.4.2.2. Types
- 2.4.2.2.1. Qualitative
- 2.4.2.2.2. Quantitative
- 2.4.2.3. Advantages
- 2.4.2.4. Techniques
- 2.4.2.4.1. Interviews
- 2.4.2.4.2. Surveys
- 2.4.2.4.3. Focus Groups
- 2.4.2.4.4. Observational Research
- 2.4.2.4.5. Social Media Interactions
- 2.4.2.5. Stakeholders
- 2.4.2.5.1. Company Executives (CXOs)
- 2.4.2.5.2. Board of Directors
- 2.4.2.5.3. Company Presidents and Vice Presidents
- 2.4.2.5.4. Key Opinion Leaders
- 2.4.2.5.5. Research and Development Heads
- 2.4.2.5.6. Technical Experts
- 2.4.2.5.7. Subject Matter Experts
- 2.4.2.5.8. Scientists
- 2.4.2.5.9. Doctors and Other Healthcare Providers
- 2.4.2.6. Ethics and Integrity
- 2.4.2.6.1. Research Ethics
- 2.4.2.6.2. Data Integrity
- 2.4.3. Analytical Tools and Databases
- 2.4.1. Secondary Research
3. MARKET DYNAMICS
- 3.1. Forecast Methodology
- 3.1.1. Top-Down Approach
- 3.1.2. Bottom-Up Approach
- 3.1.3. Hybrid Approach
- 3.2. Market Assessment Framework
- 3.2.1. Total Addressable Market (TAM)
- 3.2.2. Serviceable Addressable Market (SAM)
- 3.2.3. Serviceable Obtainable Market (SOM)
- 3.2.4. Currently Acquired Market (CAM)
- 3.3. Forecasting Tools and Techniques
- 3.3.1. Qualitative Forecasting
- 3.3.2. Correlation
- 3.3.3. Regression
- 3.3.4. Time Series Analysis
- 3.3.5. Extrapolation
- 3.3.6. Convergence
- 3.3.7. Forecast Error Analysis
- 3.3.8. Data Visualization
- 3.3.9. Scenario Planning
- 3.3.10. Sensitivity Analysis
- 3.4. Key Considerations
- 3.4.1. Demographics
- 3.4.2. Market Access
- 3.4.3. Reimbursement Scenarios
- 3.4.4. Industry Consolidation
- 3.5. Robust Quality Control
- 3.6. Key Market Segmentations
- 3.7. Limitations
4. MACRO-ECONOMIC INDICATORS
- 4.1. Chapter Overview
- 4.2. Market Dynamics
- 4.2.1. Time Period
- 4.2.1.1. Historical Trends
- 4.2.1.2. Current and Forecasted Estimates
- 4.2.2. Currency Coverage
- 4.2.2.1. Overview of Major Currencies Affecting the Market
- 4.2.2.2. Impact of Currency Fluctuations on the Industry
- 4.2.3. Foreign Exchange Impact
- 4.2.3.1. Evaluation of Foreign Exchange Rates and Their Impact on Market
- 4.2.3.2. Strategies for Mitigating Foreign Exchange Risk
- 4.2.4. Recession
- 4.2.4.1. Historical Analysis of Past Recessions and Lessons Learnt
- 4.2.4.2. Assessment of Current Economic Conditions and Potential Impact on the Market
- 4.2.5. Inflation
- 4.2.5.1. Measurement and Analysis of Inflationary Pressures in the Economy
- 4.2.5.2. Potential Impact of Inflation on the Market Evolution
- 4.2.6. Interest Rates
- 4.2.6.1. Overview of Interest Rates and Their Impact on the Market
- 4.2.6.2. Strategies for Managing Interest Rate Risk
- 4.2.7. Commodity Flow Analysis
- 4.2.7.1. Type of Commodity
- 4.2.7.2. Origins and Destinations
- 4.2.7.3. Values and Weights
- 4.2.7.4. Modes of Transportation
- 4.2.8. Global Trade Dynamics
- 4.2.8.1. Import Scenario
- 4.2.8.2. Export Scenario
- 4.2.9. War Impact Analysis
- 4.2.9.1. Russian-Ukraine War
- 4.2.9.2. Israel-Hamas War
- 4.2.10. COVID Impact / Related Factors
- 4.2.10.1. Global Economic Impact
- 4.2.10.2. Industry-specific Impact
- 4.2.10.3. Government Response and Stimulus Measures
- 4.2.10.4. Future Outlook and Adaptation Strategies
- 4.2.11. Other Indicators
- 4.2.11.1. Fiscal Policy
- 4.2.11.2. Consumer Spending
- 4.2.11.3. Gross Domestic Product (GDP)
- 4.2.11.4. Employment
- 4.2.11.5. Taxes
- 4.2.11.6. R&D Innovation
- 4.2.11.7. Stock Market Performance
- 4.2.11.8. Supply Chain
- 4.2.11.9. Cross-Border Dynamics
- 4.2.1. Time Period
SECTION II: QUALITATIVE INSIGHTS
5. EXECUTIVE SUMMARY
6. INTRODUCTION
- 6.1. Chapter Overview
- 6.2. Overview of Waste to energy market
- 6.2.1. Type of Technology
- 6.2.2. Type of Waste
- 6.2.3. Type of Form
- 6.2.4. Areas of Application
- 6.3. Future Perspective
7. REGULATORY SCENARIO
SECTION III: MARKET OVERVIEW
8. COMPREHENSIVE DATABASE OF LEADING PLAYERS
9. COMPETITIVE LANDSCAPE
- 9.1. Chapter Overview
- 9.2. Waste to Energy: Overall Market Landscape
- 9.2.1. Analysis by Year of Establishment
- 9.2.2. Analysis by Company Size
- 9.2.3. Analysis by Location of Headquarters
- 9.2.4. Analysis by Ownership Structure
10. WHITE SPACE ANALYSIS
11. COMPANY COMPETITIVENESS ANALYSIS
12. STARTUP ECOSYSTEM IN THE WASTE TO ENERGY MARKET
- 12.1. Waste to Energy Market: Market Landscape of Startups
- 12.1.1. Analysis by Year of Establishment
- 12.1.2. Analysis by Company Size
- 12.1.3. Analysis by Company Size and Year of Establishment
- 12.1.4. Analysis by Location of Headquarters
- 12.1.5. Analysis by Company Size and Location of Headquarters
- 12.1.6. Analysis by Ownership Structure
- 12.2. Key Findings
SECTION IV: COMPANY PROFILES
13. COMPANY PROFILES
- 13.1. Chapter Overview
- 13.2. A2A SpA*
- 13.2.1. Company Overview
- 13.2.2. Company Mission
- 13.2.3. Company Footprint
- 13.2.4. Management Team
- 13.2.5. Contact Details
- 13.2.6. Financial Performance
- 13.2.7. Operating Business Segments
- 13.2.8. Service / Product Portfolio (project specific)
- 13.2.9. MOAT Analysis
- 13.2.10. Recent Developments and Future Outlook
- 13.3. Abu Dhabi National Energy
- 13.4. Allseas
- 13.5. AVR
- 13.6. Babcock & Wilcox
- 13.7. Biffa
- 13.8. China Everbright Environment
- 13.9. Covanta
- 13.10. EDF
- 13.11. Foster Wheeler
- 13.12. Green Conversion Systems
- 13.13. Hitachi Zosen
- 13.14. Huawei
- 13.15. JANSEN Combustion and Boiler
- 13.16. Keppel Seghers
- 13.17. Martin
- 13.18. Mitsubishi Heavy
- 13.19. MVV Energie
SECTION V: MARKET TRENDS
14. MEGA TRENDS ANALYSIS
15. UNMET NEED ANALYSIS
16. PATENT ANALYSIS
17. RECENT DEVELOPMENTS
- 17.1. Chapter Overview
- 17.2. Recent Funding
- 17.3. Recent Partnerships
- 17.4. Other Recent Initiatives
SECTION VI: MARKET OPPORTUNITY ANALYSIS
18. GLOBAL WASTE TO ENERGY MARKET
- 18.1. Chapter Overview
- 18.2. Key Assumptions and Methodology
- 18.3. Trends Disruption Impacting Market
- 18.4. Demand Side Trends
- 18.5. Supply Side Trends
- 18.6. Global Waste to Energy Market, Historical Trends (Since 2019) and Forecasted Estimates (Till 2035)
- 18.7. Multivariate Scenario Analysis
- 18.7.1. Conservative Scenario
- 18.7.2. Optimistic Scenario
- 18.8. Investment Feasibility Index
- 18.9. Key Market Segmentations
19. MARKET OPPORTUNITIES BASED ON TYPE OF TECHNOLOGY
- 19.1. Chapter Overview
- 19.2. Key Assumptions and Methodology
- 19.3. Revenue Shift Analysis
- 19.4. Market Movement Analysis
- 19.5. Penetration-Growth (P-G) Matrix
- 19.6. Waste To Energy Market for Anaerobic Digestion: Historical Trends (Since 2019) and Forecasted Estimates (Till 2035)
- 19.7. Waste To Energy Market for Biochemical: Historical Trends (Since 2019) and Forecasted Estimates (Till 2035)
- 19.8. Waste To Energy Market for Incineration: Historical Trends (Since 2019) and Forecasted Estimates (Till 2035)
- 19.9. Waste To Energy Market for Physical: Historical Trends (Since 2019) and Forecasted Estimates (Till 2035)
- 19.10. Waste To Energy Market for Thermochemical: Historical Trends (Since 2019) and Forecasted Estimates (Till 2035)
- 19.11. Waste To Energy Market for Others: Historical Trends (Since 2019) and Forecasted Estimates (Till 2035)
- 19.12. Data Triangulation and Validation
- 19.12.1. Secondary Sources
- 19.12.2. Primary Sources
- 19.12.3. Statistical Modeling
20. MARKET OPPORTUNITIES BASED ON TYPE OF WASTE
- 20.1. Chapter Overview
- 20.2. Key Assumptions and Methodology
- 20.3. Revenue Shift Analysis
- 20.4. Market Movement Analysis
- 20.5. Penetration-Growth (P-G) Matrix
- 20.6. Waste To Energy Market for Agricultural Waste: Historical Trends (Since 2019) and Forecasted Estimates (Till 2035)
- 20.7. Waste To Energy Market for Municipal Solid Waste (MSW): Historical Trends (Since 2019) and Forecasted Estimates (Till 2035)
- 20.8. Waste To Energy Market for Others: Historical Trends (Since 2019) and Forecasted Estimates (Till 2035)
- 20.9. Data Triangulation and Validation
- 20.9.1. Secondary Sources
- 20.9.2. Primary Sources
- 20.9.3. Statistical Modeling
21. MARKET OPPORTUNITIES BASED ON TYPE OF FORM
- 21.1. Chapter Overview
- 21.2. Key Assumptions and Methodology
- 21.3. Revenue Shift Analysis
- 21.4. Market Movement Analysis
- 21.5. Penetration-Growth (P-G) Matrix
- 21.6. Waste To Energy Market for Electricity: Historical Trends (Since 2019) and Forecasted Estimates (Till 2035)
- 21.7. Waste To Energy Market for Hot Water: Historical Trends (Since 2019) and Forecasted Estimates (Till 2035)
- 21.8. Waste To Energy Market for Steam: Historical Trends (Since 2019) and Forecasted Estimates (Till 2035)
- 21.9. Data Triangulation and Validation
- 21.9.1. Secondary Sources
- 21.9.2. Primary Sources
- 21.9.3. Statistical Modeling
22. MARKET OPPORTUNITIES BASED ON AREAS OF APPLICATION
- 22.1. Chapter Overview
- 22.2. Key Assumptions and Methodology
- 22.3. Revenue Shift Analysis
- 22.4. Market Movement Analysis
- 22.5. Penetration-Growth (P-G) Matrix
- 22.6. Waste To Energy Market for Generation of Energy: Historical Trends (Since 2019) and Forecasted Estimates (Till 2035)
- 22.7. Waste To Energy Market for Treatment of Waste: Historical Trends (Since 2019) and Forecasted Estimates (Till 2035)
- 22.8. Waste To Energy Market for Reduction of Waste Volume: Historical Trends (Since 2019) and Forecasted Estimates (Till 2035)
- 22.9. Waste To Energy Market for Others: Historical Trends (Since 2019) and Forecasted Estimates (Till 2035)
- 22.10. Data Triangulation and Validation
- 22.10.1. Secondary Sources
- 22.10.2. Primary Sources
- 22.10.3. Statistical Modeling
23. MARKET OPPORTUNITIES FOR WASTE TO ENERGY IN NORTH AMERICA
- 23.1. Chapter Overview
- 23.2. Key Assumptions and Methodology
- 23.3. Revenue Shift Analysis
- 23.4. Market Movement Analysis
- 23.5. Penetration-Growth (P-G) Matrix
- 23.6. Waste To Energy Market in North America: Historical Trends (Since 2019) and Forecasted Estimates (Till 2035)
- 23.6.1. Waste To Energy Market in the US: Historical Trends (Since 2019) and Forecasted Estimates (Till 2035)
- 23.6.2. Waste To Energy Market in Canada: Historical Trends (Since 2019) and Forecasted Estimates (Till 2035)
- 23.6.3. Waste To Energy Market in Mexico: Historical Trends (Since 2019) and Forecasted Estimates (Till 2035)
- 23.6.4. Waste To Energy Market in Other North American Countries: Historical Trends (Since 2019) and Forecasted Estimates (Till 2035)
- 23.7. Data Triangulation and Validation
24. MARKET OPPORTUNITIES FOR WASTE TO ENERGY IN EUROPE
- 24.1. Chapter Overview
- 24.2. Key Assumptions and Methodology
- 24.3. Revenue Shift Analysis
- 24.4. Market Movement Analysis
- 24.5. Penetration-Growth (P-G) Matrix
- 24.6. Waste To Energy Market in Europe: Historical Trends (Since 2019) and Forecasted Estimates (Till 2035)
- 24.6.1. Waste To Energy Market in Austria: Historical Trends (Since 2019) and Forecasted Estimates (Till 2035)
- 24.6.2. Waste To Energy Market in Belgium: Historical Trends (Since 2019) and Forecasted Estimates (Till 2035)
- 24.6.3. Waste To Energy Market in Denmark: Historical Trends (Since 2019) and Forecasted Estimates (Till 2035)
- 24.6.4. Waste To Energy Market in France: Historical Trends (Since 2019) and Forecasted Estimates (Till 2035)
- 24.6.5. Waste To Energy Market in Germany: Historical Trends (Since 2019) and Forecasted Estimates (Till 2035)
- 24.6.6. Waste To Energy Market in Ireland: Historical Trends (Since 2019) and Forecasted Estimates (Till 2035)
- 24.6.7. Waste To Energy Market in Italy: Historical Trends (Since 2019) and Forecasted Estimates (Till 2035)
- 24.6.8. Waste To Energy Market in Netherlands: Historical Trends (Since 2019) and Forecasted Estimates (Till 2035)
- 24.6.9. Waste To Energy Market in Norway: Historical Trends (Since 2019) and Forecasted Estimates (Till 2035)
- 24.6.10. Waste To Energy Market in Russia: Historical Trends (Since 2019) and Forecasted Estimates (Till 2035)
- 24.6.11. Waste To Energy Market in Spain: Historical Trends (Since 2019) and Forecasted Estimates (Till 2035)
- 24.6.12. Waste To Energy Market in Sweden: Historical Trends (Since 2019) and Forecasted Estimates (Till 2035)
- 24.6.13. Waste To Energy Market in Sweden: Historical Trends (Since 2019) and Forecasted Estimates (Till 2035)
- 24.6.14. Waste To Energy Market in Switzerland: Historical Trends (Since 2019) and Forecasted Estimates (Till 2035)
- 24.6.15. Waste To Energy Market in the UK: Historical Trends (Since 2019) and Forecasted Estimates (Till 2035)
- 24.6.16. Waste To Energy Market in Other European Countries: Historical Trends (Since 2019) and Forecasted Estimates (Till 2035)
- 24.7. Data Triangulation and Validation
25. MARKET OPPORTUNITIES FOR WASTE TO ENERGY IN ASIA
- 25.1. Chapter Overview
- 25.2. Key Assumptions and Methodology
- 25.3. Revenue Shift Analysis
- 25.4. Market Movement Analysis
- 25.5. Penetration-Growth (P-G) Matrix
- 25.6. Waste To Energy Market in Asia: Historical Trends (Since 2019) and Forecasted Estimates (Till 2035)
- 25.6.1. Waste To Energy Market in China: Historical Trends (Since 2019) and Forecasted Estimates (Till 2035)
- 25.6.2. Waste To Energy Market in India: Historical Trends (Since 2019) and Forecasted Estimates (Till 2035)
- 25.6.3. Waste To Energy Market in Japan: Historical Trends (Since 2019) and Forecasted Estimates (Till 2035)
- 25.6.4. Waste To Energy Market in Singapore: Historical Trends (Since 2019) and Forecasted Estimates (Till 2035)
- 25.6.5. Waste To Energy Market in South Korea: Historical Trends (Since 2019) and Forecasted Estimates (Till 2035)
- 25.6.6. Waste To Energy Market in Other Asian Countries: Historical Trends (Since 2019) and Forecasted Estimates (Till 2035)
- 25.7. Data Triangulation and Validation
26. MARKET OPPORTUNITIES FOR WASTE TO ENERGY IN MIDDLE EAST AND NORTH AFRICA (MENA)
- 26.1. Chapter Overview
- 26.2. Key Assumptions and Methodology
- 26.3. Revenue Shift Analysis
- 26.4. Market Movement Analysis
- 26.5. Penetration-Growth (P-G) Matrix
- 26.6. Waste To Energy Market in Middle East and North Africa (MENA): Historical Trends (Since 2019) and Forecasted Estimates (Till 2035)
- 26.6.1. Waste To Energy Market in Egypt: Historical Trends (Since 2019) and Forecasted Estimates (Till 205)
- 26.6.2. Waste To Energy Market in Iran: Historical Trends (Since 2019) and Forecasted Estimates (Till 2035)
- 26.6.3. Waste To Energy Market in Iraq: Historical Trends (Since 2019) and Forecasted Estimates (Till 2035)
- 26.6.4. Waste To Energy Market in Israel: Historical Trends (Since 2019) and Forecasted Estimates (Till 2035)
- 26.6.5. Waste To Energy Market in Kuwait: Historical Trends (Since 2019) and Forecasted Estimates (Till 2035)
- 26.6.6. Waste To Energy Market in Saudi Arabia: Historical Trends (Since 2019) and Forecasted Estimates (Till 2035)
- 26.6.7. Waste To Energy Market in United Arab Emirates (UAE): Historical Trends (Since 2019) and Forecasted Estimates (Till 2035)
- 26.6.8. Waste To Energy Market in Other MENA Countries: Historical Trends (Since 2019) and Forecasted Estimates (Till 2035)
- 26.7. Data Triangulation and Validation
27. MARKET OPPORTUNITIES FOR WASTE TO ENERGY IN LATIN AMERICA
- 27.1. Chapter Overview
- 27.2. Key Assumptions and Methodology
- 27.3. Revenue Shift Analysis
- 27.4. Market Movement Analysis
- 27.5. Penetration-Growth (P-G) Matrix
- 27.6. Waste To Energy Market in Latin America: Historical Trends (Since 2019) and Forecasted Estimates (Till 2035)
- 27.6.1. Waste To Energy Market in Argentina: Historical Trends (Since 2019) and Forecasted Estimates (Till 2035)
- 27.6.2. Waste To Energy Market in Brazil: Historical Trends (Since 2019) and Forecasted Estimates (Till 2035)
- 27.6.3. Waste To Energy Market in Chile: Historical Trends (Since 2019) and Forecasted Estimates (Till 2035)
- 27.6.4. Waste To Energy Market in Colombia Historical Trends (Since 2019) and Forecasted Estimates (Till 2035)
- 27.6.5. Waste To Energy Market in Venezuela: Historical Trends (Since 2019) and Forecasted Estimates (Till 2035)
- 27.6.6. Waste To Energy Market in Other Latin American Countries: Historical Trends (Since 2019) and Forecasted Estimates (Till 2035)
- 27.7. Data Triangulation and Validation
28. MARKET OPPORTUNITIES FOR WASTE TO ENERGY IN REST OF THE WORLD
- 28.1. Chapter Overview
- 28.2. Key Assumptions and Methodology
- 28.3. Revenue Shift Analysis
- 28.4. Market Movement Analysis
- 28.5. Penetration-Growth (P-G) Matrix
- 28.6. Waste To Energy Market in Rest of the World: Historical Trends (Since 2019) and Forecasted Estimates (Till 2035)
- 28.6.1. Waste To Energy Market in Australia: Historical Trends (Since 2019) and Forecasted Estimates (Till 2035)
- 28.6.2. Waste To Energy Market in New Zealand: Historical Trends (Since 2019) and Forecasted Estimates (Till 2035)
- 28.6.3. Waste To Energy Market in Other Countries
- 28.7. Data Triangulation and Validation
29. MARKET CONCENTRATION ANALYSIS: DISTRIBUTION BY LEADING PLAYERS
- 29.1. Leading Player 1
- 29.2. Leading Player 2
- 29.3. Leading Player 3
- 29.4. Leading Player 4
- 29.5. Leading Player 5
- 29.6. Leading Player 6
- 29.7. Leading Player 7
- 29.8. Leading Player 8
30. ADJACENT MARKET ANALYSIS
SECTION VII: STRATEGIC TOOLS
31. KEY WINNING STRATEGIES
32. PORTER'S FIVE FORCES ANALYSIS
33. SWOT ANALYSIS
34. VALUE CHAIN ANALYSIS
35. ROOTS STRATEGIC RECOMMENDATIONS
- 35.1. Chapter Overview
- 35.2. Key Business-related Strategies
- 35.2.1. Research & Development
- 35.2.2. Product Manufacturing
- 35.2.3. Commercialization / Go-to-Market
- 35.2.4. Sales and Marketing
- 35.3. Key Operations-related Strategies
- 35.3.1. Risk Management
- 35.3.2. Workforce
- 35.3.3. Finance
- 35.3.4. Others