|
시장보고서
상품코드
1821516
수익 관리 시장(-2035년) : 컴포넌트 유형별, 솔루션 유형별, 서비스 유형별, 전개 방식별, 업계 유형별, 지역별 - 산업 동향 및 예측Revenue Management Market, Till 2035: Distribution by Type of Component, Type of Solution, Type of Service, Deployment Mode, Type of Vertical, and Geographical Regions: Industry Trends and Global Forecasts |
||||||
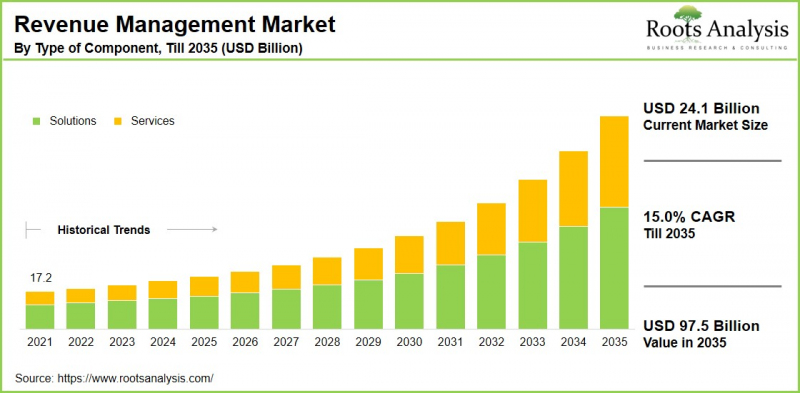
세계 수익 관리 시장 규모는 현재 241억 달러에서 2035년까지 975억 달러에 달할 것으로 추정되며, 2035년까지 예측 기간 동안 연평균 15.0%의 성장률을 보일 것으로 예측됩니다.

수익 관리 시장 : 성장과 동향
수익 관리는 데이터 분석을 통해 수요를 예측하고, 가격을 조정하고, 가치 있는 고객 부문을 식별하여 비즈니스 성공을 촉진합니다. 과거 매출 데이터를 평가하고, 미래 추세를 예측하고, 정보에 입각한 가격 책정을 위해 수익 관리 솔루션을 도입하는 기업이 늘고 있습니다. 이 방법을 통해 기업은 업무를 최적화하면서 수익을 향상시킬 수 있습니다. 고객 행동 파악의 필요성이 높아지면서 기업들은 급변하는 시장에서 경쟁력을 유지하기 위해 이 소프트웨어에 의존하고 있습니다.
혁신적인 기술의 등장과 세계화로 인해 수익 관리는 현대의 비즈니스 전략에 필수적인 요소로 자리 잡았습니다. 수익 관리 시스템(RMS)을 통해 기업은 맞춤형 가격 책정 알고리즘을 사용하여 동적 가격 책정 기술을 채택하고 재고 관리를 개선하는 동시에 영업 지출을 낮출 수 있습니다.
호텔, 항공, 소매, 통신 등 고정비가 높고 한계비용이 낮은 특징을 가진 부문이 수익 관리 환경에서 우위를 점하고 있습니다. 이들 산업은 수익성을 높이기 위해 가격 분석과 재고 관리에 의존하고 있습니다.
특히 호텔 산업에서 수익 관리는 가동률, 고객 확보 비용과 같은 중요한 지표를 강화하여 수익 관리 시장의 성장에 기여하고 있습니다. 항공사는 수익 관리를 활용하여 동적 가격 책정 및 좌석 재고를 개선하고 각 항공편의 수익을 극대화하고 있습니다.
실시간 분석의 중요성이 높아짐에 따라 이러한 도구의 채택이 가속화되고 있으며, 신속한 의사결정을 위한 실용적인 통찰력을 제공합니다. 수익 관리의 AI 통합, 머신러닝, 디지털 전환 등 눈에 띄는 트렌드가 수익 최적화 부문을 변화시키고 있습니다. AI와 머신러닝은 광범위한 데이터 세트를 분석하여 고객 행동을 예측하고 실시간으로 가격을 조정하는 한편, 클라우드 기반 수익 관리 솔루션은 확장성과 적응성을 제공합니다. 결과적으로, 위의 요인으로 인해 수익 관리 시장은 예측 기간 동안 크게 성장할 것으로 예측됩니다.
세계의 수익 관리(Revenue Management) 시장에 대해 조사했으며, 시장 규모 추정과 기회 분석, 경쟁 구도, 기업 프로파일 등의 정보를 전해드립니다.
목차
섹션 1 보고서 개요
제1장 서문
제2장 조사 방법
제3장 시장 역학
제4장 거시경제 지표
섹션 2 정성적 인사이트
제5장 주요 요약
제6장 서론
제7장 규제 시나리오
제8장 공급망 분석
섹션 3 시장 개요
제9장 주요 수익 관리 솔루션/서비스 제공업체 시장 구도
제10장 기업 경쟁력 분석
제11장 스타트업 생태계 분석
섹션 4 기업 개요와 주요 성공 전략
제12장 기업 개요
- 본 장의 개요
- Accenture
- Amdocs
- Cerillion
- Ericsson
- Fiserv
- Huwaei
- IdeaS
- Infor
- Netcracker
- Optiva
- Oracle
- RIA Advisory
- Sabre
- SAP
- Workday
- Zuora
제13장 중요 승리 전략
섹션 5 시장 동향
제14장 시장 동향
제15장 특허 분석
제16장 최근 발전
섹션 6 시장 예측과 기회 분석
제17장 시장 영향 분석
제18장 세계의 수익 관리 시장
제19장 시장 기회 : 컴포넌트 유형별
제20장 시장 기회 : 솔루션 유형별
제21장 시장 기회 : 서비스 유형별
제22장 시장 기회 : 전개 방식별
제23장 시장 기회 : 업계 유형별
제24장 시장 기회 : 지역별
섹션 7 : 지역별 시장 기회 분석
제25장 시장 기회 분석 : 북미
제26장 시장 기회 분석 : 유럽
제27장 시장 기회 분석 : 아시아태평양
제28장 시장 기회 분석 : 중동 및 아프리카
제29장 시장 기회 분석 : 라틴아메리카
섹션 8 전략적 툴
제30장 Porter의 Five Forces 분석
제31장 사례 연구 : 수익 관리 개혁, 미충족 요구와 주요 완화 전략에 대한 주목
섹션 9 기타 주요 인사이트
제32장 결론
섹션 10 부록
LSH 25.09.30Revenue Management Market Overview
As per Roots Analysis, the global revenue management market size is estimated to grow from USD 24.1 billion in the current year to USD 97.5 billion by 2035, at a CAGR of 15.0% during the forecast period, till 2035.
The opportunity for revenue management market has been distributed across the following segments:
Type of Component
- Solutions
- Services
Type of Solution
- Billing and Payment
- Channel Management
- Price Management
- Revenue Assurance and Fraud Management
Type of Service
- Managed Services
- Professional Services
Deployment Mode
- Cloud
- On-Premises
Type of Vertical
- Telecom
- Hospitality
- Healthcare
- BFSI
- Retail & E-Commerce
- Public
- Utilities
- Others
Geographical Regions
- North America
- US
- Canada
- Europe
- UK
- France
- Germany
- Spain
- Netherlands
- Rest of Europe
- Asia
- India
- China
- Australia
- Singapore
- South Korea
- Rest of Asia-Pacific
- Latin America
- Brazil
- Colombia
- Mexico
- Rest of Latin America
- Middle East and North Africa
- UAE
- Israel
- Saudi Arabia
- Rest of Middle East and Africa
Revenue Management Market: Growth and Trends
Revenue management promotes business success through the use of data analytics to anticipate demand, adjust pricing, and identify valuable customer segments. More businesses are adopting revenue management solutions to evaluate past sales data, forecast future trends, and make informed pricing choices. This technique allows companies to enhance profits while optimizing their operations. As the need to grasp customer behavior increases, organizations depend on this software to maintain a competitive edge in rapidly changing markets.
The emergence of innovative technologies and globalization has made revenue management an essential aspect of contemporary business strategies. Revenue management systems (RMS) enable businesses to employ dynamic pricing techniques and improve inventory management, using customized pricing algorithms that increase revenue while lowering operational expenses.
Sectors characterized by high fixed costs and low marginal costs, such as hospitality, airlines, retail, and telecommunications, dominate the revenue management landscape. These industries rely on pricing analysis and inventory management to enhance profitability.
Specifically, revenue management in hospitality enhances vital metrics like occupancy rates and customer acquisition expenses, contributing to the growth of the revenue management market. Airlines utilize revenue management to refine dynamic pricing and seat inventory, maximizing revenue for each flight.
The increasing importance of real-time analytics has driven the accelerated adoption of these tools, offering actionable insights for prompt decision-making. Prominent trends, including the integration of AI in revenue management, machine learning, and digital transformation, are transforming the revenue optimization sector. AI and machine learning analyze extensive datasets to forecast customer behavior and fine-tune pricing in real time, while cloud-based revenue management solutions provide scalability and adaptability. As a result, owing to the above mentioned factors, the revenue management market is expected to grow significantly during the forecast period.
Revenue Management Market: Key Segments
Market Share by Type of Component
Based on type of component, the global revenue management market is segmented into solutions and services. According to our estimates, currently, the solutions segment captures the majority of the market share.
However, the services segment is expected to grow at a higher CAGR throughout the forecast period. This can be attributed to the rising complexities associated with revenue management systems (RMS), including the difficulties of integrating omnichannel payment options and overseeing advanced platforms with limited internal expertise.
Market Share by Type of Solution
Based on type of solution, the global revenue management market is segmented into billing and payment, channel management, price management, and revenue assurance and fraud management. According to our estimates, currently, the billing and payments segment captures the majority of the market share.
However, the revenue assurance and fraud management segment is expected to grow at a higher CAGR throughout the forecast period. This can be attributed to the increasing occurrence of revenue loss and fraudulent activities.
Market Share by Type of Service
Based on type of service, the global revenue management market is segmented into managed services and professional services. According to our estimates, currently, the managed services segment captures the majority of the market share. This can be attributed to the intricate nature of IT environments, which necessitates specialized skills that organizations frequently do not possess in-house.
The rising emphasis on cybersecurity and compliance also promotes the demand for outsourced security solutions and risk management expertise that managed service providers (MSPs) offer. Additionally, the increasing adoption of cloud technologies significantly contributes, as businesses utilize cloud-based services for scalability, cost-effectiveness, and flexibility, often depending on MSPs to efficiently manage their cloud infrastructure.
Market Share by Deployment Mode
Based on deployment mode, the global revenue management market is segmented into cloud and on-premises. According to our estimates, currently, the cloud segment captures the majority of the market share, owing to its scalability and flexibility. Additionally, cloud-based solutions offer companies easy implementation, allowing them to adjust their operations in response to demand fluctuations.
Market Share by Type of Vertical
Based on type of vertical, the global revenue management market is segmented into telecom, hospitality, Healthcare, BFSI, Retail & E-commerce, public, utilities and other industries. According to our estimates, currently, the telecom segment captures the majority of the market share, due to its foundational role in quantum key distribution.
This dominance is due to several factors, including the rapidly increasing number of mobile and internet users, the challenges of managing a wide range of evolving telecom services (such as IoT and 5G), and the growing demand for effective billing and revenue assurance solutions to mitigate revenue loss.
Market Share by Geographical Regions
Based on geographical regions, the revenue management market is segmented into North America, Europe, Asia, Latin America, Middle East and North Africa, and the rest of the world. According to our estimates, currently, North America captures the majority share of the market. However, the market in Asia-Pacific region is expected to experience a relatively higher compound annual growth rate (CAGR) during the forecast period, driven by the swift digital transformation and an emphasis on embracing advanced technologies such as automation.
Example Players in Revenue Management Market
- Accenture
- Amdoc
- Cerillion
- Ericsson
- Fiserv
- Huawei
- IdeaS
- Infor
- Netcracker
- Optiva
- Oracle
- RIA Advisory
- Sabre
- SAP
- Workday
- Zuora
Revenue Management Market: Research Coverage
The report on the revenue management market features insights on various sections, including:
- Market Sizing and Opportunity Analysis: An in-depth analysis of the revenue management market, focusing on key market segments, including [A] type of component, [B] type of solution, [C] type of service, [D] deployment mode, [E] type of vertical, and [F] geographical regions.
- Competitive Landscape: A comprehensive analysis of the companies engaged in the revenue management market, based on several relevant parameters, such as [A] year of establishment, [B] company size, [C] location of headquarters and [D] ownership structure.
- Company Profiles: Elaborate profiles of prominent players engaged in the revenue management market, providing details on [A] location of headquarters, [B] company size, [C] company mission, [D] company footprint, [E] management team, [F] contact details, [G] financial information, [H] operating business segments, [I] revenue management portfolio, [J] moat analysis, [K] recent developments, and an informed future outlook.
- Megatrends: An evaluation of ongoing megatrends in the revenue management industry.
- Patent Analysis: An insightful analysis of patents filed / granted in the revenue management domain, based on relevant parameters, including [A] type of patent, [B] patent publication year, [C] patent age and [D] leading players.
- Recent Developments: An overview of the recent developments made in the revenue management market, along with analysis based on relevant parameters, including [A] year of initiative, [B] type of initiative, [C] geographical distribution and [D] most active players.
- Porter's Five Forces Analysis: An analysis of five competitive forces prevailing in the revenue management market, including threats of new entrants, bargaining power of buyers, bargaining power of suppliers, threats of substitute products and rivalry among existing competitors.
- SWOT Analysis: An insightful SWOT framework, highlighting the strengths, weaknesses, opportunities and threats in the domain. Additionally, it provides Harvey ball analysis, highlighting the relative impact of each SWOT parameter.
- Value Chain Analysis: A comprehensive analysis of the value chain, providing information on the different phases and stakeholders involved in the revenue management market.
Key Questions Answered in this Report
- How many companies are currently engaged in revenue management market?
- Which are the leading companies in this market?
- What factors are likely to influence the evolution of this market?
- What is the current and future market size?
- What is the CAGR of this market?
- How is the current and future market opportunity likely to be distributed across key market segments?
Reasons to Buy this Report
- The report provides a comprehensive market analysis, offering detailed revenue projections of the overall market and its specific sub-segments. This information is valuable to both established market leaders and emerging entrants.
- Stakeholders can leverage the report to gain a deeper understanding of the competitive dynamics within the market. By analyzing the competitive landscape, businesses can make informed decisions to optimize their market positioning and develop effective go-to-market strategies.
- The report offers stakeholders a comprehensive overview of the market, including key drivers, barriers, opportunities, and challenges. This information empowers stakeholders to stay abreast of market trends and make data-driven decisions to capitalize on growth prospects.
Additional Benefits
- Complimentary Excel Data Packs for all Analytical Modules in the Report
- 15% Free Content Customization
- Detailed Report Walkthrough Session with Research Team
- Free Updated report if the report is 6-12 months old or older
TABLE OF CONTENTS
SECTION I: REPORT OVERVIEW
1. PREFACE
- 1.1. Introduction
- 1.2. Market Share Insights
- 1.3. Key Market Insights
- 1.4. Report Coverage
- 1.5. Key Questions Answered
- 1.6. Chapter Outlines
2. RESEARCH METHODOLOGY
- 2.1. Chapter Overview
- 2.2. Research Assumptions
- 2.2.1. Market Landscape and Market Trends
- 2.2.2. Market Forecast and Opportunity Analysis
- 2.2.3. Comparative Analysis
- 2.3. Database Building
- 2.3.1. Data Collection
- 2.3.2. Data Validation
- 2.3.3. Data Analysis
- 2.4. Project Methodology
- 2.4.1. Secondary Research
- 2.4.1.1. Annual Reports
- 2.4.1.2. Academic Research Papers
- 2.4.1.3. Company Websites
- 2.4.1.4. Investor Presentations
- 2.4.1.5. Regulatory Filings
- 2.4.1.6. White Papers
- 2.4.1.7. Industry Publications
- 2.4.1.8. Conferences and Seminars
- 2.4.1.9. Government Portals
- 2.4.1.10. Media and Press Releases
- 2.4.1.11. Newsletters
- 2.4.1.12. Industry Databases
- 2.4.1.13. Roots Proprietary Databases
- 2.4.1.14. Paid Databases and Sources
- 2.4.1.15. Social Media Portals
- 2.4.1.16. Other Secondary Sources
- 2.4.2. Primary Research
- 2.4.2.1. Types of Primary Research
- 2.4.2.1.1. Qualitative Research
- 2.4.2.1.2. Quantitative Research
- 2.4.2.1.3. Hybrid Approach
- 2.4.2.2. Advantages of Primary Research
- 2.4.2.3. Techniques for Primary Research
- 2.4.2.3.1. Interviews
- 2.4.2.3.2. Surveys
- 2.4.2.3.3. Focus Groups
- 2.4.2.3.4. Observational Research
- 2.4.2.3.5. Social Media Interactions
- 2.4.2.4. Key Opinion Leaders Considered in Primary Research
- 2.4.2.4.1. Company Executives (CXOs)
- 2.4.2.4.2. Board of Directors
- 2.4.2.4.3. Company Presidents and Vice Presidents
- 2.4.2.4.4. Research and Development Heads
- 2.4.2.4.5. Technical Experts
- 2.4.2.4.6. Subject Matter Experts
- 2.4.2.4.7. Scientists
- 2.4.2.4.8. Doctors and Other Healthcare Providers
- 2.4.2.5. Ethics and Integrity
- 2.4.2.5.1. Research Ethics
- 2.4.2.5.2. Data Integrity
- 2.4.2.1. Types of Primary Research
- 2.4.3. Analytical Tools and Databases
- 2.4.1. Secondary Research
- 2.5. Robust Quality Control
3. MARKET DYNAMICS
- 3.1. Chapter Overview
- 3.2. Forecast Methodology
- 3.2.1. Top-down Approach
- 3.2.2. Bottom-up Approach
- 3.2.3. Hybrid Approach
- 3.3. Market Assessment Framework
- 3.3.1. Total Addressable Market (TAM)
- 3.3.2. Serviceable Addressable Market (SAM)
- 3.3.3. Serviceable Obtainable Market (SOM)
- 3.3.4. Currently Acquired Market (CAM)
- 3.4. Forecasting Tools and Techniques
- 3.4.1. Qualitative Forecasting
- 3.4.2. Correlation
- 3.4.3. Regression
- 3.4.4. Extrapolation
- 3.4.5. Convergence
- 3.4.6. Sensitivity Analysis
- 3.4.7. Scenario Planning
- 3.4.8. Data Visualization
- 3.4.9. Time Series Analysis
- 3.4.10. Forecast Error Analysis
- 3.5. Key Considerations
- 3.5.1. Demographics
- 3.5.2. Government Regulations
- 3.5.3. Reimbursement Scenarios
- 3.5.4. Market Access
- 3.5.5. Supply Chain
- 3.5.6. Industry Consolidation
- 3.5.7. Pandemic / Unforeseen Disruptions Impact
- 3.6. Limitations
4. MACRO-ECONOMIC INDICATORS
- 4.1. Chapter Overview
- 4.2. Market Dynamics
- 4.2.1. Time Period
- 4.2.1.1. Historical Trends
- 4.2.1.2. Current and Forecasted Estimates
- 4.2.2. Currency Coverage
- 4.2.2.1. Major Currencies Affecting the Market
- 4.2.2.2. Factors Affecting Currency Fluctuations
- 4.2.2.3. Impact of Currency Fluctuations on the Industry
- 4.2.3. Foreign Currency Exchange Rate
- 4.2.3.1. Impact of Foreign Exchange Rate Volatility on the Market
- 4.2.3.2. Strategies for Mitigating Foreign Exchange Risk
- 4.2.4. Recession
- 4.2.4.1. Assessment of Current Economic Conditions and Potential Impact on the Market
- 4.2.4.2. Historical Analysis of Past Recessions and Lessons Learnt
- 4.2.5. Inflation
- 4.2.5.1. Measurement and Analysis of Inflationary Pressures in the Economy
- 4.2.5.2. Potential Impact of Inflation on the Market Evolution
- 4.2.6. Interest Rates
- 4.2.6.1. Interest Rates and Their Impact on the Market
- 4.2.6.2. Strategies for Managing Interest Rate Risk
- 4.2.7. Commodity Flow Analysis
- 4.2.7.1. Type of Commodity
- 4.2.7.2. Origins and Destinations
- 4.2.7.3. Values and Weights
- 4.2.7.4. Modes of Transportation
- 4.2.8. Global Trade Dynamics
- 4.2.8.1. Import Scenario
- 4.2.8.2. Export Scenario
- 4.2.8.3. Trade Policies
- 4.2.8.4. Strategies for Mitigating the Risks Associated with Trade Barriers
- 4.2.8.5. Impact of Trade Barriers on the Market
- 4.2.9. War Impact Analysis
- 4.2.9.1. Russian-Ukraine War
- 4.2.9.2. Israel-Hamas War
- 4.2.10. COVID Impact / Related Factors
- 4.2.10.1. Global Economic Impact
- 4.2.10.2. Industry-specific Impact
- 4.2.10.3. Government Response and Stimulus Measures
- 4.2.10.4. Future Outlook and Adaptation Strategies
- 4.2.11. Other Indicators
- 4.2.11.1. Fiscal Policy
- 4.2.11.2. Consumer Spending
- 4.2.11.3. Gross Domestic Product (GDP)
- 4.2.11.4. Employment
- 4.2.11.5. Taxes
- 4.2.11.6. Stock Market Performance
- 4.2.11.7. Cross-Border Dynamics
- 4.2.1. Time Period
- 4.3. Conclusion
SECTION II: QUALITATIVE INSIGHTS
5. EXECUTIVE SUMMARY
6. INTRODUCTION
- 6.1. Overview of Revenue Management
- 6.2. Key Components
- 6.3. Need of Revenue Management Solutions and Services
- 6.4. Real-world Impact of Revenue Management Solutions
- 6.5. Future Outlook
7. REGULATORY SCENARIO
8. SUPPLY CHAIN ANALYSIS
- 8.1. Chapter Overview
- 8.2. Core Components of Supply Chain Analysis
- 8.2.1. Key Steps under Primary Activities
- 8.2.2. Key Steps under Support Activities
- 8.3. Processes and Stakeholders Involved
- 8.4. Key Challenges and Mitigation Strategies
SECTION III: MARKET OVERVIEW
9. LEADING REVENUE MANAGEMENT SOLUTION / SERVICE PROVIDERS MARKET LANDSCAPE
- 9.1. Methodology and Key Parameters
- 9.2. Analysis by Year of Establishment
- 9.3. Analysis by Company Size
- 9.4. Analysis by Location of Headquarters
- 9.5. Analysis by Type of Solutions
- 9.6. Analysis by Type of Services
- 9.7. Analysis by Deployment Mode
- 9.8. Analysis by Type of Vertical
10. COMPANY COMPETITIVENESS ANALYSIS
- 10.1. Methodology and Scoring Criteria
- 10.2. Comparison of Leading Revenue Management Solution / Service Providers
- 10.3. Leading Revenue Management Solution / Service Providers
11. STARTUP ECOSYSTEM ANALYSIS
- 11.1. Methodology and Key Parameters
- 11.2. Analysis by Year of Establishment
- 11.3. Analysis by Company Size
- 11.4. Analysis by Location of Headquarters
- 11.5. Analysis by Type of Solutions
- 11.6. Analysis by Type of Services
- 11.7. Analysis by Deployment Mode
- 11.8. Analysis by Type of Vertical
SECTION IV: COMPANY PROFILES AND KEY WINNING STRATEGIES
12. COMPANY PROFILES
- 12.1. Chapter Overview
- 12.2. Accenture
- 12.2.1. Company Details
- 12.2.2. Revenue Management Portfolio
- 12.2.3. Initiatives in the Revenue Management Market
- 12.2.4. Future Outlook
- 12.3. Amdocs
- 12.4. Cerillion
- 12.5. Ericsson
- 12.6. Fiserv
- 12.7. Huwaei
- 12.8. IdeaS
- 12.9. Infor
- 12.10. Netcracker
- 12.11. Optiva
- 12.12. Oracle
- 12.13. RIA Advisory
- 12.14. Sabre
- 12.15. SAP
- 12.16. Workday
- 12.17. Zuora
13. KEY WINNING STRATEGIES
SECTION V: MARKET TRENDS
14. MARKET TRENDS
- 14.1. Overview of Ongoing Trends
- 14.2. Insights on Emerging Trends
15. PATENT ANALYSIS
- 15.1. Scope and Methodology
- 15.2. Key Parameters
- 15.3. Revenue Management: Patent Analysis
- 15.3.1. Analysis by Application Year
- 15.3.2. Analysis by Type of Patent
- 15.3.3. Analysis by Patent Jurisdiction
- 15.3.4. Analysis by Patent Publication Year
- 15.3.5. Analysis by Type of Patent and Patent Publication Year
- 15.3.6. Analysis by Type of Applicant
- 15.3.7. Leading Players: Analysis by Number of Patents
- 15.3.8. Leading Individual Patent Assignees: Analysis by Number of Patents
- 15.3.9. Analysis by Patent Age
- 15.3.10. Patent Valuation
16. RECENT DEVELOPMENTS
- 16.1. Chapter Overview
- 16.2. Revenue Management: Recent Partnerships and Collaborations
- 16.2.1. Analysis by Month of Partnership
- 16.2.2. Analysis by Type of Partnership
- 16.2.3. Analysis by Type of Solution
- 16.2.4. Analysis by Type of Vertical Targeted
- 16.2.5. Intercontinental and Intracontinental Deals
- 16.2. Revenue Management: Recent Funding and Investments
- 16.2.1. Analysis by Funding Activity
- 16.2.2. Analysis by Type of Funding
- 16.2.3. Analysis by Purpose of Funding
- 16.2.4. Most Active Investors: Analysis by Funding Instances
SECTION VI: MARKET FORECAST AND OPPORTUNITY ANALYSIS
17. MARKET IMPACT ANALYSIS
- 17.1. Market Drivers
- 17.2. Market Restraints
- 17.3. Market Opportunities
- 17.4. Market Challenges
18. GLOBAL REVENUE MANAGEMENT MARKET
- 18.1. Key Assumptions and Methodology
- 18.2. Global Revenue Management Market, Historical Trends (Since 2021) and Forecasted Estimates (Till 2035)
- 18.2.1. Scenario Analysis
- 18.2.1.1. Conservative Scenario
- 18.2.1.2. Optimistic Scenario
- 18.2.1. Scenario Analysis
- 18.3. Key Market Segmentations
19. MARKET OPPORTUNITIES BASED ON TYPE OF COMPONENT
- 19.1. Key Assumptions and Methodology
- 19.2. Revenue Management Market, by Type of Component
- 19.2.1. Revenue Management Market for Solutions, Historical Trends (Since 2021) and Forecasted Estimates (Till 2035)
- 19.2.2. Revenue Management Market for Services, Historical Trends (Since 2021) and Forecasted Estimates (Till 2035)
20. MARKET OPPORTUNITIES BASED ON TYPE OF SOLUTION
- 20.1. Key Assumptions and Methodology
- 20.2. Revenue Management Market, by Type of Solution
- 20.2.1. Revenue Management Market for Billing and Payment, Historical Trends (Since 2021) and Forecasted Estimates (Till 2035)
- 20.2.2. Revenue Management Market for Channel Management, Historical Trends (Since 2021) and Forecasted Estimates (Till 2035)
- 20.2.3. Revenue Management Market for Price Management, Historical Trends (Since 2021) and Forecasted Estimates (Till 2035)
- 20.2.4. Revenue Management Market for Revenue Assurance and Fraud Management, Historical Trends (Since 2021) and Forecasted Estimates (Till 2035)
21. MARKET OPPORTUNITIES BASED ON TYPE OF SERVICE
- 21.1. Key Assumptions and Methodology
- 21.2. Revenue Management Market, by Type of Service
- 21.2.1. Revenue Management Market for Managed Services, Historical Trends (Since 2021) and Forecasted Estimates (Till 2035)
- 21.2.2. Revenue Management Market for Professional Services, Historical Trends (Since 2021) and Forecasted Estimates (Till 2035)
22. MARKET OPPORTUNITIES BASED ON DEPLOYMENT MODE
- 22.1. Key Assumptions and Methodology
- 22.2. Revenue Management Market, by Deployment Mode
- 22.2.1. Revenue Management Market for Cloud, Historical Trends (Since 2021) and Forecasted Estimates (Till 2035)
- 22.2.2. Revenue Management Market for On-premises, Historical Trends (Since 2021) and Forecasted Estimates (Till 2035)
23. MARKET OPPORTUNITIES BASED ON TYPE OF VERTICAL
- 23.1. Key Assumptions and Methodology
- 23.2. Revenue Management Market, by Type of Vertical
- 22.2.1. Revenue Management Market for Telecom, Historical Trends (Since 2021) and Forecasted Estimates (Till 2035)
- 23.2.2. Revenue Management Market for Hospitality, Historical Trends (Since 2021) and Forecasted Estimates (Till 2035)
- 23.2.3. Revenue Management Market for Healthcare, Historical Trends (Since 2021) and Forecasted Estimates (Till 2035)
- 23.2.4. Revenue Management Market for BFSI, Historical Trends (Since 2021) and Forecasted Estimates (Till 2035)
- 23.2.5. Revenue Management Market for Retail and E-commerce, Historical Trends (Since 2021) and Forecasted Estimates (Till 2035)
- 23.2.6. Revenue Management Market for Public, Historical Trends (Since 2021) and Forecasted Estimates (Till 2035)
- 23.2.7. Revenue Management Market for Utilities, Historical Trends (Since 2021) and Forecasted Estimates (Till 2035)
- 23.2.8. Revenue Management Market for Other Industries, Historical Trends (Since 2021) and Forecasted Estimates (Till 2035)
24. MARKET OPPORTUNITIES BASED ON GEOGRAPHICAL REGIONS
- 24.1. Key Assumptions and Methodology
- 24.2. Revenue Management Market, by Geographical Regions
- 24.2.1. Revenue Management Market in North America, Historical Trends (Since 2021) and Forecasted Estimates (Till 2035)
- 24.2.2. Revenue Management Market in Europe, Historical Trends (Since 2021) and Forecasted Estimates (Till 2035)
- 24.2.3. Revenue Management Market in Asia-Pacific, Historical Trends (Since 2021) and Forecasted Estimates (Till 2035)
- 24.2.4. Revenue Management Market in Middle East and Africa, Historical Trends (Since 2021) and Forecasted Estimates (Till 2035)
- 24.2.5. Revenue Management Market in Latin America, Historical Trends (Since 2021) and Forecasted Estimates (Till 2035)
- 24.3. Revenue Management Market, by Geographical Regions: Market Dynamics Assessment
- 24.3.1. Market Movement Analysis
- 24.3.2. Penetration Growth (P-G) Matrix
SECTION VII: MARKET OPPORTUNITY ANALYSIS WITHIN GEOGRAPHICAL REGIONS**
25. MARKET OPPORTUNITY ANALYSIS: NORTH AMERICA
- 25.1. Revenue Management Market in North America: Distribution by Type of Component
- 25.1.1. Revenue Management Market in North America for Solution, Historical Trends (Since 2021) and Forecasted Estimates (Till 2035)
- 25.1.2. Revenue Management Market in North America for Service, Historical Trends (Since 2021) and Forecasted Estimates (Till 2035)
- 25.2. Revenue Management Market in North America: Distribution by Type of Solution
- 25.2.1. Revenue Management Market in North America for Billing and Payment, Historical Trends (Since 2021) and Forecasted Estimates (Till 2035)
- 25.2.2. Revenue Management Market in North America for Channel Management, Historical Trends (Since 2021) and Forecasted Estimates (Till 2035)
- 25.2.3. Revenue Management Market in North America for Price Management, Historical Trends (Since 2021) and Forecasted Estimates (Till 2035)
- 25.2.4. Revenue Management Market in North America for Risk Assurance and Financial Management, Historical Trends (Since 2021) and Forecasted Estimates (Till 2035)
- 25.3. Revenue Management Market in North America: Distribution by Type of Service
- 25.3.1. Revenue Management Market in North America for Managed Services, Historical Trends (Since 2021) and Forecasted Estimates (Till 2035)
- 25.3.2. Revenue Management Market in North America for Professional Services, Historical Trends (Since 2021) and Forecasted Estimates (Till 2035)
- 25.4. Revenue Management Market in North America: Distribution by Deployment Mode
- 25.4.1. Revenue Management Market in North America for Cloud, Historical Trends (Since 2021) and Forecasted Estimates (Till 2035)
- 25.4.2. Revenue Management Market in North America for On-premises, Historical Trends (Since 2021) and Forecasted Estimates (Till 2035)
- 25.5. Revenue Management Market in North America: Distribution by Type of Vertical
- 25.5.1. Revenue Management Market in North America for Telecom, Historical Trends (Since 2021) and Forecasted Estimates (Till 2035)
- 25.5.2. Revenue Management Market in North America for Hospitality, Historical Trends (Since 2021) and Forecasted Estimates (Till 2035)
- 25.5.3. Revenue Management Market in North America for Healthcare, Historical Trends (Since 2021) and Forecasted Estimates (Till 2035)
- 25.5.4. Revenue Management Market in North America for BFSI, Historical Trends (Since 2021) and Forecasted Estimates (Till 2035)
- 25.5.5. Revenue Management Market in North America for Retail and E-commerce, Historical Trends (Since 2021) and Forecasted Estimates (Till 2035)
- 25.5.6. Revenue Management Market in North America for Utilities, Historical Trends (Since 2021) and Forecasted Estimates (Till 2035)
- 25.5.7. Revenue Management Market in North America for Public, Historical Trends (Since 2021) and Forecasted Estimates (Till 2035)
- 25.5.8. Revenue Management Market in North America for Other Industries, Historical Trends (Since 2021) and Forecasted Estimates (Till 2035)
26. MARKET OPPORTUNITY ANALYSIS: EUROPE
- 26.1. Revenue Management Market in Europe: Distribution by Type of Component
- 26.1.1. Revenue Management Market in Europe for Solution, Historical Trends (Since 2021) and Forecasted Estimates (Till 2035)
- 26.1.2. Revenue Management Market in Europe for Service, Historical Trends (Since 2021) and Forecasted Estimates (Till 2035)
- 26.2. Revenue Management Market in Europe: Distribution by Type of Solution
- 26.2.1. Revenue Management Market in Europe for Billing and Payment, Historical Trends (Since 2021) and Forecasted Estimates (Till 2035)
- 26.2.2. Revenue Management Market in Europe for Channel Management, Historical Trends (Since 2021) and Forecasted Estimates (Till 2035)
- 26.2.3. Revenue Management Market in Europe for Price Management, Historical Trends (Since 2021) and Forecasted Estimates (Till 2035)
- 26.2.4. Revenue Management Market in Europe for Risk Assurance and Financial Management, Historical Trends (Since 2021) and Forecasted Estimates (Till 2035)
- 26.3. Revenue Management Market in Europe: Distribution by Type of Service
- 26.3.1. Revenue Management Market in Europe for Managed Services, Historical Trends (Since 2021) and Forecasted Estimates (Till 2035)
- 26.3.2. Revenue Management Market in Europe for Professional Services, Historical Trends (Since 2021) and Forecasted Estimates (Till 2035)
- 26.4. Revenue Management Market in Europe: Distribution by Deployment Mode
- 26.4.1. Revenue Management Market in Europe for Cloud, Historical Trends (Since 2021) and Forecasted Estimates (Till 2035)
- 26.4.2. Revenue Management Market in Europe for On-premises, Historical Trends (Since 2021) and Forecasted Estimates (Till 2035)
- 26.5. Revenue Management Market in Europe: Distribution by Type of Vertical
- 26.5.1. Revenue Management Market in Europe for Telecom, Historical Trends (Since 2021) and Forecasted Estimates (Till 2035)
- 26.5.2. Revenue Management Market in Europe for Hospitality, Historical Trends (Since 2021) and Forecasted Estimates (Till 2035)
- 26.5.3. Revenue Management Market in Europe for Healthcare, Historical Trends (Since 2021) and Forecasted Estimates (Till 2035)
- 26.5.4. Revenue Management Market in Europe for BFSI, Historical Trends (Since 2021) and Forecasted Estimates (Till 2035)
- 26.5.5. Revenue Management Market in Europe for Retail and E-commerce, Historical Trends (Since 2021) and Forecasted Estimates (Till 2035)
- 26.5.6. Revenue Management Market in Europe for Utilities, Historical Trends (Since 2021) and Forecasted Estimates (Till 2035)
- 26.5.7. Revenue Management Market in Europe for Public, Historical Trends (Since 2021) and Forecasted Estimates (Till 2035)
- 26.5.8. Revenue Management Market in Europe for Other Industries, Historical Trends (Since 2021) and Forecasted Estimates (Till 2035)
27. MARKET OPPORTUNITY ANALYSIS: ASIA PACIFIC
- 27.1. Revenue Management Market in Asia Pacific: Distribution by Type of Component
- 27.1.1. Revenue Management Market in Asia Pacific for Solution, Historical Trends (Since 2021) and Forecasted Estimates (Till 2035)
- 27.1.2. Revenue Management Market in Asia Pacific for Service, Historical Trends (Since 2021) and Forecasted Estimates (Till 2035)
- 27.2. Revenue Management Market in Asia Pacific: Distribution by Type of Solution
- 27.2.1. Revenue Management Market in Asia Pacific for Billing and Payment, Historical Trends (Since 2021) and Forecasted Estimates (Till 2035)
- 27.2.2. Revenue Management Market in Asia Pacific for Channel Management, Historical Trends (Since 2021) and Forecasted Estimates (Till 2035)
- 27.2.3. Revenue Management Market in Asia Pacific for Price Management, Historical Trends (Since 2021) and Forecasted Estimates (Till 2035)
- 27.2.4. Revenue Management Market in Asia Pacific for Risk Assurance and Financial Management, Historical Trends (Since 2021) and Forecasted Estimates (Till 2035)
- 27.3. Revenue Management Market in Asia Pacific: Distribution by Type of Service
- 27.3.1. Revenue Management Market in Asia Pacific for Managed Services, Historical Trends (Since 2021) and Forecasted Estimates (Till 2035)
- 27.3.2. Revenue Management Market in Asia Pacific for Professional Services, Historical Trends (Since 2021) and Forecasted Estimates (Till 2035)
- 27.4. Revenue Management Market in Asia Pacific: Distribution by Deployment Mode
- 27.4.1. Revenue Management Market in Asia Pacific for Cloud, Historical Trends (Since 2021) and Forecasted Estimates (Till 2035)
- 27.4.2. Revenue Management Market in Asia Pacific for On-premises, Historical Trends (Since 2021) and Forecasted Estimates (Till 2035)
- 27.5. Revenue Management Market in Asia Pacific: Distribution by Type of Vertical
- 27.5.1. Revenue Management Market in Asia Pacific for Telecom, Historical Trends (Since 2021) and Forecasted Estimates (Till 2035)
- 27.5.2. Revenue Management Market in Asia Pacific for Hospitality, Historical Trends (Since 2021) and Forecasted Estimates (Till 2035)
- 27.5.3. Revenue Management Market in Asia Pacific for Healthcare, Historical Trends (Since 2021) and Forecasted Estimates (Till 2035)
- 27.5.4. Revenue Management Market in Asia Pacific for BFSI, Historical Trends (Since 2021) and Forecasted Estimates (Till 2035)
- 27.5.5. Revenue Management Market in Asia Pacific for Retail and E-commerce, Historical Trends (Since 2021) and Forecasted Estimates (Till 2035)
- 27.5.6. Revenue Management Market in Asia Pacific for Utilities, Historical Trends (Since 2021) and Forecasted Estimates (Till 2035)
- 27.5.7. Revenue Management Market in Asia Pacific for Public, Historical Trends (Since 2021) and Forecasted Estimates (Till 2035)
- 27.5.8. Revenue Management Market in Asia Pacific for Other Industries, Historical Trends (Since 2021) and Forecasted Estimates (Till 2035)
28. MARKET OPPORTUNITY ANALYSIS: MIDDLE EAST AND AFRICA
- 28.1. Revenue Management Market in Middle East and Africa: Distribution by Type of Component
- 28.1.1. Revenue Management Market in Middle East and Africa for Solution, Historical Trends (Since 2021) and Forecasted Estimates (Till 2035)
- 28.1.2. Revenue Management Market in Middle East and Africa for Service, Historical Trends (Since 2021) and Forecasted Estimates (Till 2035)
- 28.2. Revenue Management Market in Middle East and Africa: Distribution by Type of Solution
- 28.2.1. Revenue Management Market in Middle East and Africa for Billing and Payment, Historical Trends (Since 2021) and Forecasted Estimates (Till 2035)
- 28.2.2. Revenue Management Market in Middle East and Africa for Channel Management, Historical Trends (Since 2021) and Forecasted Estimates (Till 2035)
- 28.2.3. Revenue Management Market in Middle East and Africa for Price Management, Historical Trends (Since 2021) and Forecasted Estimates (Till 2035)
- 28.2.4. Revenue Management Market in Middle East and Africa for Risk Assurance and Financial Management, Historical Trends (Since 2021) and Forecasted Estimates (Till 2035)
- 28.3. Revenue Management Market in Middle East and Africa: Distribution by Type of Service
- 28.3.1. Revenue Management Market in Middle East and Africa for Managed Services, Historical Trends (Since 2021) and Forecasted Estimates (Till 2035)
- 28.3.2. Revenue Management Market in Middle East and Africa for Professional Services, Historical Trends (Since 2021) and Forecasted Estimates (Till 2035)
- 28.4. Revenue Management Market in Middle East and Africa: Distribution by Deployment Mode
- 28.4.1. Revenue Management Market in Middle East and Africa for Cloud, Historical Trends (Since 2021) and Forecasted Estimates (Till 2035)
- 28.4.2. Revenue Management Market in Middle East and Africa for On-premises, Historical Trends (Since 2021) and Forecasted Estimates (Till 2035)
- 28.5. Revenue Management Market in Middle East and Africa: Distribution by Type of Vertical
- 28.5.1. Revenue Management Market in Middle East and Africa for Telecom, Historical Trends (Since 2021) and Forecasted Estimates (Till 2035)
- 28.5.2. Revenue Management Market in Middle East and Africa for Hospitality, Historical Trends (Since 2021) and Forecasted Estimates (Till 2035)
- 28.5.3. Revenue Management Market in Middle East and Africa for Healthcare, Historical Trends (Since 2021) and Forecasted Estimates (Till 2035)
- 28.5.4. Revenue Management Market in Middle East and Africa for BFSI, Historical Trends (Since 2021) and Forecasted Estimates (Till 2035)
- 28.5.5. Revenue Management Market in Middle East and Africa for Retail and E-commerce, Historical Trends (Since 2021) and Forecasted Estimates (Till 2035)
- 28.5.6. Revenue Management Market in Middle East and Africa for Utilities, Historical Trends (Since 2021) and Forecasted Estimates (Till 2035)
- 28.5.7. Revenue Management Market in Middle East and Africa for Public, Historical Trends (Since 2021) and Forecasted Estimates (Till 2035)
- 28.5.8. Revenue Management Market in Middle East and Africa for Other Industries, Historical Trends (Since 2021) and Forecasted Estimates (Till 2035)
29. MARKET OPPORTUNITY ANALYSIS: LATIN AMERICA
- 29.1. Revenue Management Market in Latin America: Distribution by Type of Component
- 29.1.1. Revenue Management Market in Latin America for Solution, Historical Trends (Since 2021) and Forecasted Estimates (Till 2035)
- 29.1.2. Revenue Management Market in Latin America for Service, Historical Trends (Since 2021) and Forecasted Estimates (Till 2035)
- 29.2. Revenue Management Market in Latin America: Distribution by Type of Solution
- 29.2.1. Revenue Management Market in Latin America for Billing and Payment, Historical Trends (Since 2021) and Forecasted Estimates (Till 2035)
- 29.2.2. Revenue Management Market in Latin America for Channel Management, Historical Trends (Since 2021) and Forecasted Estimates (Till 2035)
- 29.2.3. Revenue Management Market in Latin America for Price Management, Historical Trends (Since 2021) and Forecasted Estimates (Till 2035)
- 29.2.4. Revenue Management Market in Latin America for Risk Assurance and Financial Management, Historical Trends (Since 2021) and Forecasted Estimates (Till 2035)
- 29.3. Revenue Management Market in Latin America: Distribution by Type of Service
- 29.3.1. Revenue Management Market in Latin America for Managed Services, Historical Trends (Since 2021) and Forecasted Estimates (Till 2035)
- 29.3.2. Revenue Management Market in Latin America for Professional Services, Historical Trends (Since 2021) and Forecasted Estimates (Till 2035)
- 29.4. Revenue Management Market in Latin America: Distribution by Deployment Mode
- 29.4.1. Revenue Management Market in Latin America for Cloud, Historical Trends (Since 2021) and Forecasted Estimates (Till 2035)
- 29.4.2. Revenue Management Market in Latin America for On-premises, Historical Trends (Since 2021) and Forecasted Estimates (Till 2035)
- 29.5. Revenue Management Market in Latin America: Distribution by Type of Vertical
- 29.5.1. Revenue Management Market in Latin America for Telecom, Historical Trends (Since 2021) and Forecasted Estimates (Till 2035)
- 29.5.2. Revenue Management Market in Latin America for Hospitality, Historical Trends (Since 2021) and Forecasted Estimates (Till 2035)
- 29.5.3. Revenue Management Market in Latin America for Healthcare, Historical Trends (Since 2021) and Forecasted Estimates (Till 2035)
- 29.5.4. Revenue Management Market in Latin America for BFSI, Historical Trends (Since 2021) and Forecasted Estimates (Till 2035)
- 29.5.5. Revenue Management Market in Latin America for Retail and E-commerce, Historical Trends (Since 2021) and Forecasted Estimates (Till 2035)
- 29.5.6. Revenue Management Market in Latin America for Utilities, Historical Trends (Since 2021) and Forecasted Estimates (Till 2035)
- 29.5.7. Revenue Management Market in Latin America for Public, Historical Trends (Since 2021) and Forecasted Estimates (Till 2035)
- 29.5.8. Revenue Management Market in Latin America for Other Industries, Historical Trends (Since 2021) and Forecasted Estimates (Till 2035)
- *Detailed information on Section VII is available in the Excel Data Packs shared along with the report**
SECTION VIII: STRATEGIC TOOLS
30. PORTER'S FIVE FORCES ANALYSIS
- 30.1. Chapter Overview
- 30.2. Significance of Porter's Five Forces Analysis
- 30.3. Porter's Five Forces
- 30.3.1. Methodology
- 30.3.2. Threats to New Entrants
- 30.3.3. Bargaining Power of Buyers
- 30.3.4. Bargaining Power of RMS Solution Providers
- 30.3.5. Threat of Substitute Products
- 30.3.6. Rivalry among Existing Competitors
- 30.3.7. Harvey Ball Analysis
31. CASE STUDY: REVENUE MANAGEMENT REINVENTED: FOCUS ON UNMET NEEDS AND KEY MITIGATION STRATEGIES
- 31.1. Evolution of Revenue Management
- 31.2. Key Historical Events in the Revenue Management Market
- 31.3. Key Verticals Targeted by Revenue Management Solution / Service Providers
- 31.4. Current Revenue Management Practices across Key Industries
- 31.4.1. BFSI Industry
- 31.4.2. Healthcare Industry
- 31.4.3. Hospitality Industry
- 31.4.4. Retail and E-commerce Industry
- 31.4.5. Public Industry
- 31.4.6. Utilities Industry
- 31.4.7. Logistics and Transportation Industry
- 31.4.8. IT and Tele-communication Industry