
|
시장보고서
상품코드
1883081
Bluetooth Low Energy(BLE) 시장(-2035년) : 네트워크 토폴로지, Bluetooth 유형, 제품 유형, 모드, 컴포넌트, 적용 분야, 최종사용자, 기업 규모, 지역별Bluetooth Low Energy Market Till 2035: Distribution by Type of Network Topology, Bluetooth, Product, Mode, Component, Application, Type of End-User, Company Size, and Key Geographical Regions: Industry Trends and Global Forecasts. |
||||||
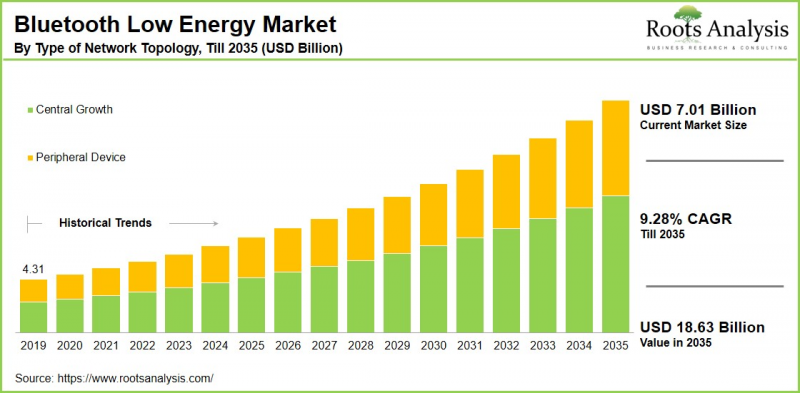
Roots Analysis의 조사에 따르면 세계의 Bluetooth Low Energy(BLE) 시장 규모는 2035년까지 현재 70억 1,000만 달러에서 186억 3,000만 달러로 성장해 예측 기간 동안 CAGR은 9.28%로 추정됩니다.
Bluetooth Low Energy 시장 기회 분류
네트워크 토폴로지
- 중앙 디바이스
- 주변기기
Bluetooth 유형
- Bluetooth 4.0
- Bluetooth 4.x
- Bluetooth 5.x
제품 유형
- 칩셋
- 모듈
모드
- 듀얼 모드
- 싱글 모드
구성요소
- 하드웨어
- 서비스
- 소프트웨어
적용 분야
- 자동차
- CE 제품
- 의료
- 산업용 자동화
- 스마트 홈
- 기타
최종 사용자
- BFSI
- 제조
- IT 및 통신
- 소매
- 기타
기업 규모
- 대기업
- 중소기업
지역
- 북미
- 미국
- 캐나다
- 멕시코
- 기타 북미 국가
- 유럽
- 오스트리아
- 벨기에
- 덴마크
- 프랑스
- 독일
- 아일랜드
- 이탈리아
- 네덜란드
- 노르웨이
- 러시아
- 스페인
- 스웨덴
- 스위스
- 영국
- 기타 유럽 국가
- 아시아
- 중국
- 인도
- 일본
- 싱가포르
- 한국
- 기타 아시아 국가
- 라틴아메리카
- 브라질
- 칠레
- 콜롬비아
- 베네수엘라
- 기타 라틴아메리카 국가
- 중동 및 북아프리카
- 이집트
- 이란
- 이라크
- 이스라엘
- 쿠웨이트
- 사우디아라비아
- 아랍에미리트(UAE)
- 기타 중동 및 북아프리카 국가
- 기타 지역
- 호주
- 뉴질랜드
- 기타 국가들
Bluetooth Low Energy(BLE) 시장 : 성장과 동향
Bluetooth Low Energy(BLE) 기술은 기존의 Bluetooth 모델에서 진화한 것으로, 특히 낮은 데이터 스트리밍이 필요한 용도를 위해 설계되었습니다. BLE 모듈은 대량의 스트리밍이 필요하지 않은 상황에 특히 적합하며, IoT 네트워크 내에서 통신을 가능하게 하면서 전력 소비를 억제할 수 있습니다. BLE는 오픈소스 소프트웨어 솔루션으로 작동하며 최소한의 전력 사용에 최적화되어 있기 때문에 유지 보수가 거의 필요없는 배터리 구동 장치에 이상적입니다.
Bluetooth Low Energy 시장은 모바일 디바이스에 대한 세계 수요 증가로 성장할 것으로 예측됩니다. 이러한 추세는 무선 센싱 기술에 대한 관심 증가와 IoT 솔루션의 진보로 더욱 강화되고 있습니다. 게다가 지속적인 R&D는 BLE의 기능을 향상시키고 있는 반면, 혁신적인 기술과 현대적인 생산 방법이 새로운 시장의 잠재력을 열고 있습니다. 또한 개발도상국은 연결성 요건을 충족하기 위해 BLE 용도를 채택하여 이러한 성장에 기여하고 있습니다. 종합적으로 볼 때, 이러한 복합적인 요소들이 결합되어 Bluetooth Low Energy는 무선 통신 기술의 변화하는 환경에서 필수적인 요소로 확립되었습니다.
본 보고서에서는 세계의 Bluetooth Low Energy 시장을 조사했으며, 시장 개요, 배경, 시장 영향요인 분석, 시장 규모 추이와 예측, 각종 구분, 지역별 상세 분석, 경쟁 구도, 주요 기업 프로파일 등을 정리했습니다.
목차
섹션 I : 보고서 개요
제1장 서문
제2장 조사 방법
제3장 시장 역학
제4장 거시경제지표
섹션 II : 정성적 통찰
제5장 주요 요약
제6장 소개
제7장 규제 시나리오
섹션 III : 시장 개요
제8장 주요 기업의 종합적 데이터베이스
제9장 경쟁 구도
제10장 화이트 스페이스 분석
제11장 기업의 경쟁력 분석
제12장 Bluetooth Low Energy 시장의 스타트업 생태계
섹션 IV : 기업 프로파일
제13장 기업 프로파일
- 장의 개요
- Apple
- Broadcom
- Bluegiga Technologies
- Cypress Semiconductor
- Dialog Semiconductor
- Ellisys
- Ericsson Technology
- Infineon Technologies
- Intel
- LG
- Mediatek
- Microchip Technology
- Murata Manufacturing
- NXP Semiconductors
- Nordic Semiconductors
- Panasonic
- Qualcomm
- Renesas Electronics
섹션 V : 시장 동향
제14장 메가트렌드 분석
제15장 미충족 요구의 분석
제16장 특허 분석
제17장 최근 동향
섹션 VI : 시장 기회 분석
제18장 세계의 Bluetooth Low Energy 시장
제19장 네트워크 토폴로지별 시장 기회
제20장 Bluetooth 유형별 시장 기회
제21장 제품 유형별 시장 기회
제22장 모드별 시장 기회
제23장 컴포넌트별 시장 기회
제24장 적용 분야별 시장 기회
제25장 최종 사용자별 시장 기회
제26장 기업 규모별 시장 기회
제27장 북미의 Bluetooth Low Energy 시장 기회
제28장 유럽에서 Bluetooth Low Energy 시장 기회
제29장 아시아에서 Bluetooth Low Energy 시장 기회
제30장 중동 및 북아프리카에서의 Bluetooth Low Energy 시장 기회
제31장 라틴아메리카에서 Bluetooth Low Energy 시장 기회
제32장 기타 지역에서 Bluetooth Low Energy 시장 기회
제33장 시장 집중 분석 : 주요 기업별 분포
제34장 인접 시장 분석
섹션 VII : 전략 도구
제35장 승리의 열쇠가 되는 전략
제36장 Porter's Five Forces 분석
제37장 SWOT 분석
제38장 밸류체인 분석
제39장 ROOTS에 의한 전략 제안
섹션 VIII : 기타 독점적 통찰
제40장 1차 조사로부터의 통찰
제41장 보고서의 결론
섹션 IX : 부록
제42장 표 형식 데이터
제43장 기업 및 단체 일람
제44장 커스터마이즈 기회
제45장 ROOTS 구독 서비스
제46장 저자 상세
JHS 25.12.15Bluetooth Low Energy Market Overview
As per Roots Analysis, the global Bluetooth low energy market size is estimated to grow from USD 7.01 billion in the current year USD 18.63 billion by 2035, at a CAGR of 9.28% during the forecast period, till 2035.

The opportunity for Bluetooth low energy market has been distributed across the following segments:
Type of Network Topology
- Central Device
- Peripheral Device
Type of Bluetooth
- Bluetooth 4.0
- Bluetooth 4.x
- Bluetooth 5.x
Type of Product
- Chipset
- Module
Type of Mode
- Dual Mode
- Single Mode
Type of Component
- Hardware
- Services
- Software
Areas of Application
- Automotive
- Consumer Electronics
- Healthcare
- Industrial Automation
- Smart Home
- Others
Type of End-User
- BFSI
- Manufacturing
- IT and Telecommunications
- Retail
- Others
Company Size
- Large Enterprises
- Small and Medium Enterprises
Geographical Regions
- North America
- US
- Canada
- Mexico
- Other North American countries
- Europe
- Austria
- Belgium
- Denmark
- France
- Germany
- Ireland
- Italy
- Netherlands
- Norway
- Russia
- Spain
- Sweden
- Switzerland
- UK
- Other European countries
- Asia
- China
- India
- Japan
- Singapore
- South Korea
- Other Asian countries
- Latin America
- Brazil
- Chile
- Colombia
- Venezuela
- Other Latin American countries
- Middle East and North Africa
- Egypt
- Iran
- Iraq
- Israel
- Kuwait
- Saudi Arabia
- UAE
- Other MENA countries
- Rest of the World
- Australia
- New Zealand
- Other countries
Bluetooth Low Energy Market: Growth and Trends
Bluetooth Low Energy (BLE) technology marks progression from the conventional Bluetooth model, specifically crafted for applications that require low data streaming. BLE modules are particularly ideal for situations where extensive streaming is not essential, enabling them to conserve power while allowing communication in Internet of Things (IoT) networks. BLE functions as an open-source software solution, optimized for minimal power usage, which makes it perfect for battery-powered devices that need little maintenance.
The Bluetooth low energy market is expected to grow due to the increasing global demand for mobile devices. This trend is further bolstered by a rising interest in wireless sensing technologies and advancements in IoT solutions. Moreover, continuous research and development are improving BLE's capabilities, while innovative technologies and modern production methods are opening up new market possibilities. Additionally, developing nations are playing a role in this growth by adopting BLE applications to satisfy their connectivity requirements. Overall, these combined factors establish Bluetooth low energy as an essential element in the changing landscape of wireless communication technologies.
Bluetooth Low Energy Market: Key Segments
Market Share by Type of Network Topology
Based on type of network topology, the global Bluetooth low energy market is segmented into central device and peripheral device. According to our estimates, currently, the central device segment captures the majority of the market share. This trend can be linked to its vital function in overseeing connections and data transmission among various peripheral devices, which is crucial for applications across sectors such as healthcare, smart home technology, and industrial automation.
Conversely, the peripheral device segment is expected to grow at a higher CAGR during the forecast period. This is driven by the rising adoption of wearable technology, smart home products, and IoT solutions that demand low energy usage and effective communication capabilities.
Market Share by Type of Bluetooth
Based on type of Bluetooth, the global Bluetooth low energy market is segmented into Bluetooth 4.0, Bluetooth 4.x, and Bluetooth 5.x. According to our estimates, currently, the Bluetooth 5.x segment captures the majority of the market share. Additionally, it is important to note that this segment is anticipated to experience higher growth rate throughout the forecast period. This trend can be linked to its advanced features, which include an extended range, faster data transfer rates, and enhanced broadcasting capacity relative to earlier versions.
Market Share by Type of Product
Based on type of product, the global Bluetooth low energy market is segmented into chipset and module. According to our estimates, currently, the chipset segment captures the majority of the market share. This can be attributed to its incorporation of key features such as radio frequency transceivers and digital signal processors, facilitating effective Bluetooth connectivity.
However, the module category is projected to experience the highest compound annual growth rate (CAGR) throughout the forecast period. This increase is fueled by the rising demand for ready-to-use solutions that facilitate the integration of BLE technology into a variety of devices.
Market Share by Type of Mode
Based on type of mode, the global Bluetooth low energy market is segmented into dual mode and single mode. According to our estimates, currently, the dual mode segment captures the majority of the market share. This is due to its capability of supporting both Bluetooth Classic and Bluetooth Low Energy functions. This flexibility enables devices to cater to a broader spectrum of applications, ranging from high-throughput audio streaming to low-power IoT communications, which makes dual mode especially attractive to both manufacturers and consumers.
On the other hand, the single mode category is projected to grow at a higher CAGR during the forecast period. This growth is fueled by the rising demand for low-power, battery-operated devices that need effective connectivity without requiring extensive data transfer capabilities.
Market Share by Type of Component
Based on type of component, the global Bluetooth low energy market is segmented into hardware, services and software. According to our estimates, currently, the hardware segment captures the majority of the market share. This increase is driven by the rising demand for devices equipped with BLE technology, such as smartphones, wearables, and smart home products.
On the other hand, the services segment is projected to grow at a higher CAGR during the forecast period. This growth is linked to the growing necessity for integration, maintenance, and support services related to BLE technology across various applications.
Market Share by Areas of Application
Based on areas of application, the global Bluetooth low energy market is segmented into automotive, consumer electronics, healthcare, industrial automation, smart home, and others. According to our estimates, currently, the healthcare applications captures the majority of the market share. This increase is attributed to the growing implementation of BLE technology in medical devices for remote patient monitoring, telehealth services, and wearable health devices.
On the other hand, the smart home segment is projected to grow at a higher CAGR during the forecast period. This growth is driven by the increasing consumer interest in automation, energy efficiency, and interconnected devices for home use.
Market Share by Type of End-User
Based on type of end-user, the global Bluetooth low energy market is segmented into BFSI, manufacturing, IT and telecommunication, retail, and others. According to our estimates, currently, the BFSI segment captures the majority of the market share. This increase can be attributed to the growing use of BLE technology to enhance customer interaction, streamline operations, and improve service delivery through applications such as virtual assistants and secure mobile payments.
On the other hand, the retail segment is projected to grow at a higher CAGR during the forecast period. This growth is fueled by the rising demand for BLE-enabled solutions, such as beacons, for proximity marketing, inventory management, and customer engagement initiatives.
Market Share by Company Size
Based on company size, the global Bluetooth low energy market is segmented into large and small and medium enterprise. According to our estimates, currently, the large enterprise segment captures the majority of the market share. On the other hand, the small and medium enterprises are projected to grow at a higher CAGR during the forecast period. This can be attributed to their agility, innovation, focus on niche markets, and capacity to adapt to shifting customer preferences and market conditions.
Market Share by Geographical Regions
Based on geographical regions, the Bluetooth low energy market is segmented into North America, Europe, Asia, Latin America, Middle East and North Africa, and the rest of the world. According to our estimates, currently North America captures the majority share of the market. This increase can be attributed to the presence of key technology firms, widespread smartphone adoption, and a strong demand for Internet of Things (IoT) solutions. The United States, in particular, has a significant influence on this growth, driven by considerable investments in sectors such as healthcare, smart home innovations, wearables, and industrial automation.
Example Players in Bluetooth Low Energy Market
- Apple
- Broadcom
- Bluegiga Technologies
- Cypress Semiconductor
- Dialog Semiconductor
- Ellisys
- Ericsson Technology
- Infineon Technologies
- Intel
- LG
- Mediatek
- Microchip Technology
- Murata Manufacturing
- NXP Semiconductors
- Nordic Semiconductors
- Panasonic
- Qualcomm
- Renesas Electronics
- Samsung
- Silicon Laboratories
- STMicroelectronics
- Toshiba
Bluetooth Low Energy Market: Research Coverage
The report on the Bluetooth low energy market features insights on various sections, including:
- Market Sizing and Opportunity Analysis: An in-depth analysis of the Bluetooth low energy market, focusing on key market segments, including [A] type of network topology, [B] type of Bluetooth, [C] type of product, [D] type of mode, [E] type of component, [F] areas of application, [G] type of end-user, [H] company size, and [I] key geographical regions.
- Competitive Landscape: A comprehensive analysis of the companies engaged in the Bluetooth low energy market, based on several relevant parameters, such as [A] year of establishment, [B] company size, [C] location of headquarters and [D] ownership structure.
- Company Profiles: Elaborate profiles of prominent players engaged in the Bluetooth low energy market, providing details on [A] location of headquarters, [B] company size, [C] company mission, [D] company footprint, [E] management team, [F] contact details, [G] financial information, [H] operating business segments, [I] portfolio, [J] moat analysis, [K] recent developments, and an informed future outlook.
- Megatrends: An evaluation of ongoing megatrends in the Bluetooth low energy industry.
- Patent Analysis: An insightful analysis of patents filed / granted in the Bluetooth low energy domain, based on relevant parameters, including [A] type of patent, [B] patent publication year, [C] patent age and [D] leading players.
- Recent Developments: An overview of the recent developments made in the Bluetooth low energy market, along with analysis based on relevant parameters, including [A] year of initiative, [B] type of initiative, [C] geographical distribution and [D] most active players.
- Porter's Five Forces Analysis: An analysis of five competitive forces prevailing in the Bluetooth low energy market, including threats of new entrants, bargaining power of buyers, bargaining power of suppliers, threats of substitute products and rivalry among existing competitors.
- SWOT Analysis: An insightful SWOT framework, highlighting the strengths, weaknesses, opportunities and threats in the domain. Additionally, it provides Harvey ball analysis, highlighting the relative impact of each SWOT parameter.
- Value Chain Analysis: A comprehensive analysis of the value chain, providing information on the different phases and stakeholders involved in the Bluetooth low energy market.
Key Questions Answered in this Report
- How many companies are currently engaged in Bluetooth low energy market?
- Which are the leading companies in this market?
- What factors are likely to influence the evolution of this market?
- What is the current and future market size?
- What is the CAGR of this market?
- How is the current and future market opportunity likely to be distributed across key market segments?
Reasons to Buy this Report
- The report provides a comprehensive market analysis, offering detailed revenue projections of the overall market and its specific sub-segments. This information is valuable to both established market leaders and emerging entrants.
- Stakeholders can leverage the report to gain a deeper understanding of the competitive dynamics within the market. By analyzing the competitive landscape, businesses can make informed decisions to optimize their market positioning and develop effective go-to-market strategies.
- The report offers stakeholders a comprehensive overview of the market, including key drivers, barriers, opportunities, and challenges. This information empowers stakeholders to stay abreast of market trends and make data-driven decisions to capitalize on growth prospects.
Additional Benefits
- Complimentary Excel Data Packs for all Analytical Modules in the Report
- 15% Free Content Customization
- Detailed Report Walkthrough Session with Research Team
- Free Updated report if the report is 6-12 months old or older
TABLE OF CONTENTS
SECTION I: REPORT OVERVIEW
1. PREFACE
- 1.1. Introduction
- 1.2. Market Share Insights
- 1.3. Key Market Insights
- 1.4. Report Coverage
- 1.5. Key Questions Answered
- 1.6. Chapter Outlines
2. RESEARCH METHODOLOGY
- 2.1. Chapter Overview
- 2.2. Research Assumptions
- 2.3. Database Building
- 2.3.1. Data Collection
- 2.3.2. Data Validation
- 2.3.3. Data Analysis
- 2.4. Project Methodology
- 2.4.1. Secondary Research
- 2.4.1.1. Annual Reports
- 2.4.1.2. Academic Research Papers
- 2.4.1.3. Company Websites
- 2.4.1.4. Investor Presentations
- 2.4.1.5. Regulatory Filings
- 2.4.1.6. White Papers
- 2.4.1.7. Industry Publications
- 2.4.1.8. Conferences and Seminars
- 2.4.1.9. Government Portals
- 2.4.1.10. Media and Press Releases
- 2.4.1.11. Newsletters
- 2.4.1.12. Industry Databases
- 2.4.1.13. Roots Proprietary Databases
- 2.4.1.14. Paid Databases and Sources
- 2.4.1.15. Social Media Portals
- 2.4.1.16. Other Secondary Sources
- 2.4.2. Primary Research
- 2.4.2.1. Introduction
- 2.4.2.2. Types
- 2.4.2.2.1. Qualitative
- 2.4.2.2.2. Quantitative
- 2.4.2.3. Advantages
- 2.4.2.4. Techniques
- 2.4.2.4.1. Interviews
- 2.4.2.4.2. Surveys
- 2.4.2.4.3. Focus Groups
- 2.4.2.4.4. Observational Research
- 2.4.2.4.5. Social Media Interactions
- 2.4.2.5. Stakeholders
- 2.4.2.5.1. Company Executives (CXOs)
- 2.4.2.5.2. Board of Directors
- 2.4.2.5.3. Company Presidents and Vice Presidents
- 2.4.2.5.4. Key Opinion Leaders
- 2.4.2.5.5. Research and Development Heads
- 2.4.2.5.6. Technical Experts
- 2.4.2.5.7. Subject Matter Experts
- 2.4.2.5.8. Scientists
- 2.4.2.5.9. Doctors and Other Healthcare Providers
- 2.4.2.6. Ethics and Integrity
- 2.4.2.6.1. Research Ethics
- 2.4.2.6.2. Data Integrity
- 2.4.3. Analytical Tools and Databases
- 2.4.1. Secondary Research
3. MARKET DYNAMICS
- 3.1. Forecast Methodology
- 3.1.1. Top-Down Approach
- 3.1.2. Bottom-Up Approach
- 3.1.3. Hybrid Approach
- 3.2. Market Assessment Framework
- 3.2.1. Total Addressable Market (TAM)
- 3.2.2. Serviceable Addressable Market (SAM)
- 3.2.3. Serviceable Obtainable Market (SOM)
- 3.2.4. Currently Acquired Market (CAM)
- 3.3. Forecasting Tools and Techniques
- 3.3.1. Qualitative Forecasting
- 3.3.2. Correlation
- 3.3.3. Regression
- 3.3.4. Time Series Analysis
- 3.3.5. Extrapolation
- 3.3.6. Convergence
- 3.3.7. Forecast Error Analysis
- 3.3.8. Data Visualization
- 3.3.9. Scenario Planning
- 3.3.10. Sensitivity Analysis
- 3.4. Key Considerations
- 3.4.1. Demographics
- 3.4.2. Market Access
- 3.4.3. Reimbursement Scenarios
- 3.4.4. Industry Consolidation
- 3.5. Robust Quality Control
- 3.6. Key Market Segmentations
- 3.7. Limitations
4. MACRO-ECONOMIC INDICATORS
- 4.1. Chapter Overview
- 4.2. Market Dynamics
- 4.2.1. Time Period
- 4.2.1.1. Historical Trends
- 4.2.1.2. Current and Forecasted Estimates
- 4.2.2. Currency Coverage
- 4.2.2.1. Overview of Major Currencies Affecting the Market
- 4.2.2.2. Impact of Currency Fluctuations on the Industry
- 4.2.3. Foreign Exchange Impact
- 4.2.3.1. Evaluation of Foreign Exchange Rates and Their Impact on Market
- 4.2.3.2. Strategies for Mitigating Foreign Exchange Risk
- 4.2.4. Recession
- 4.2.4.1. Historical Analysis of Past Recessions and Lessons Learnt
- 4.2.4.2. Assessment of Current Economic Conditions and Potential Impact on the Market
- 4.2.5. Inflation
- 4.2.5.1. Measurement and Analysis of Inflationary Pressures in the Economy
- 4.2.5.2. Potential Impact of Inflation on the Market Evolution
- 4.2.6. Interest Rates
- 4.2.6.1. Overview of Interest Rates and Their Impact on the Market
- 4.2.6.2. Strategies for Managing Interest Rate Risk
- 4.2.7. Commodity Flow Analysis
- 4.2.7.1. Type of Commodity
- 4.2.7.2. Origins and Destinations
- 4.2.7.3. Values and Weights
- 4.2.7.4. Modes of Transportation
- 4.2.8. Global Trade Dynamics
- 4.2.8.1. Import Scenario
- 4.2.8.2. Export Scenario
- 4.2.9. War Impact Analysis
- 4.2.9.1. Russian-Ukraine War
- 4.2.9.2. Israel-Hamas War
- 4.2.10. COVID Impact / Related Factors
- 4.2.10.1. Global Economic Impact
- 4.2.10.2. Industry-specific Impact
- 4.2.10.3. Government Response and Stimulus Measures
- 4.2.10.4. Future Outlook and Adaptation Strategies
- 4.2.11. Other Indicators
- 4.2.11.1. Fiscal Policy
- 4.2.11.2. Consumer Spending
- 4.2.11.3. Gross Domestic Product (GDP)
- 4.2.11.4. Employment
- 4.2.11.5. Taxes
- 4.2.11.6. R&D Innovation
- 4.2.11.7. Stock Market Performance
- 4.2.11.8. Supply Chain
- 4.2.11.9. Cross-Border Dynamics
- 4.2.1. Time Period
SECTION II: QUALITATIVE INSIGHTS
5. EXECUTIVE SUMMARY
6. INTRODUCTION
- 6.1. Chapter Overview
- 6.2. Overview of Bluetooth Low Energy Market
- 6.2.1. Type of Management
- 6.2.2. Type of Services
- 6.2.3. Type of Water Meter
- 6.2.4. Type of Offering
- 6.2.5. Areas of Application
- 6.2.6. Type of End-Users
- 6.3. Future Perspective
7. REGULATORY SCENARIO
SECTION III: MARKET OVERVIEW
8. COMPREHENSIVE DATABASE OF LEADING PLAYERS
9. COMPETITIVE LANDSCAPE
- 9.1. Chapter Overview
- 9.2. Bluetooth Low Energy: Overall Market Landscape
- 9.2.1. Analysis by Year of Establishment
- 9.2.2. Analysis by Company Size
- 9.2.3. Analysis by Location of Headquarters
- 9.2.4. Analysis by Ownership Structure
10. WHITE SPACE ANALYSIS
11. COMPANY COMPETITIVENESS ANALYSIS
12. STARTUP ECOSYSTEM IN THE BLUETOOTH LOW ENERGY MARKET
- 12.1. Bluetooth Low Energy Market: Market Landscape of Startups
- 12.1.1. Analysis by Year of Establishment
- 12.1.2. Analysis by Company Size
- 12.1.3. Analysis by Company Size and Year of Establishment
- 12.1.4. Analysis by Location of Headquarters
- 12.1.5. Analysis by Company Size and Location of Headquarters
- 12.1.6. Analysis by Ownership Structure
- 12.2. Key Findings
SECTION IV: COMPANY PROFILES
13. COMPANY PROFILES
- 13.1. Chapter Overview
- 13.2. Apple*
- 13.2.1. Company Overview
- 13.2.2. Company Mission
- 13.2.3. Company Footprint
- 13.2.4. Management Team
- 13.2.5. Contact Details
- 13.2.6. Financial Performance
- 13.2.7. Operating Business Segments
- 13.2.8. Service / Product Portfolio (project specific)
- 13.2.9. MOAT Analysis
- 13.2.10. Recent Developments and Future Outlook
- 13.3. Broadcom
- 13.4. Bluegiga Technologies
- 13.5. Cypress Semiconductor
- 13.6. Dialog Semiconductor
- 13.7. Ellisys
- 13.8. Ericsson Technology
- 13.9. Infineon Technologies
- 13.10. Intel
- 13.11. LG
- 13.12. Mediatek
- 13.13. Microchip Technology
- 13.14. Murata Manufacturing
- 13.15. NXP Semiconductors
- 13.16. Nordic Semiconductors
- 13.17. Panasonic
- 13.18. Qualcomm
- 13.19. Renesas Electronics
SECTION V: MARKET TRENDS
14. MEGA TRENDS ANALYSIS
15. UNMEET NEED ANALYSIS
16. PATENT ANALYSIS
17. RECENT DEVELOPMENTS
- 17.1. Chapter Overview
- 17.2. Recent Funding
- 17.3. Recent Partnerships
- 17.4. Other Recent Initiatives
SECTION VI: MARKET OPPORTUNITY ANALYSIS
18. GLOBAL BLUETOOTH LOW ENERGY MARKET
- 18.1. Chapter Overview
- 18.2. Key Assumptions and Methodology
- 18.3. Trends Disruption Impacting Market
- 18.4. Demand Side Trends
- 18.5. Supply Side Trends
- 18.6. Global Bluetooth Low Energy Market, Historical Trends (Since 2019) and Forecasted Estimates (Till 2035)
- 18.7. Multivariate Scenario Analysis
- 18.7.1. Conservative Scenario
- 18.7.2. Optimistic Scenario
- 18.8. Investment Feasibility Index
- 18.9. Key Market Segmentations
19. MARKET OPPORTUNITIES BASED ON TYPE OF NETWORK TOPOLOGY
- 19.1. Chapter Overview
- 19.2. Key Assumptions and Methodology
- 19.3. Revenue Shift Analysis
- 19.4. Market Movement Analysis
- 19.5. Penetration-Growth (P-G) Matrix
- 19.6. Bluetooth Low Energy Market for Central Device: Historical Trends (Since 2019) and Forecasted Estimates (Till 2035)
- 19.7. Bluetooth Low Energy Market for Peripheral Device: Historical Trends (Since 2019) and Forecasted Estimates (Till 2035)
- 19.8. Data Triangulation and Validation
- 19.8.1. Secondary Sources
- 19.8.2. Primary Sources
- 19.8.3. Statistical Modeling
20. MARKET OPPORTUNITIES BASED ON TYPE OF BLUETOOTH
- 20.1. Chapter Overview
- 20.2. Key Assumptions and Methodology
- 20.3. Revenue Shift Analysis
- 20.4. Market Movement Analysis
- 20.5. Penetration-Growth (P-G) Matrix
- 20.6. Bluetooth Low Energy Market for Bluetooth 4.0: Historical Trends (Since 2019) and Forecasted Estimates (Till 2035)
- 20.7. Bluetooth Low Energy Market for Bluetooth 4.x: Historical Trends (Since 2019) and Forecasted Estimates (Till 2035)
- 20.8. Bluetooth Low Energy Market for Bluetooth 5.x: Historical Trends (Since 2019) and Forecasted Estimates (Till 2035)
- 20.9. Data Triangulation and Validation
- 20.9.1. Secondary Sources
- 20.9.2. Primary Sources
- 20.9.3. Statistical Modeling
21. MARKET OPPORTUNITIES BASED ON TYPE OF PRODUCT
- 21.1. Chapter Overview
- 21.2. Key Assumptions and Methodology
- 21.3. Revenue Shift Analysis
- 21.4. Market Movement Analysis
- 21.5. Penetration-Growth (P-G) Matrix
- 21.6. Bluetooth Low Energy Market for Chipset: Historical Trends (Since 2019) and Forecasted Estimates (Till 2035)
- 21.7. Bluetooth Low Energy Market for Module: Historical Trends (Since 2019) and Forecasted Estimates (Till 2035)
- 21.8. Data Triangulation and Validation
- 21.8.1. Secondary Sources
- 21.8.2. Primary Sources
- 21.8.3. Statistical Modeling
22. MARKET OPPORTUNITIES BASED ON TYPE OF MODE
- 22.1. Chapter Overview
- 22.2. Key Assumptions and Methodology
- 22.3. Revenue Shift Analysis
- 22.4. Market Movement Analysis
- 22.5. Penetration-Growth (P-G) Matrix
- 22.6. Bluetooth Low Energy Market for Dual Mode: Historical Trends (Since 2019) and Forecasted Estimates (Till 2035)
- 22.7. Bluetooth Low Energy Market for Single Mode: Historical Trends (Since 2019) and Forecasted Estimates (Till 2035)
- 22.8. Data Triangulation and Validation
- 22.8.1. Secondary Sources
- 22.8.2. Primary Sources
- 22.8.3. Statistical Modeling
23. MARKET OPPORTUNITIES BASED ON TYPE OF COMPONENT
- 23.1. Chapter Overview
- 23.2. Key Assumptions and Methodology
- 23.3. Revenue Shift Analysis
- 23.4. Market Movement Analysis
- 23.5. Penetration-Growth (P-G) Matrix
- 23.6. Bluetooth Low Energy Market for Hardware: Historical Trends (Since 2019) and Forecasted Estimates (Till 2035)
- 23.7. Bluetooth Low Energy Market for Services: Historical Trends (Since 2019) and Forecasted Estimates (Till 2035)
- 23.8. Bluetooth Low Energy Market for Software: Historical Trends (Since 2019) and Forecasted Estimates (Till 2035)
- 23.9. Data Triangulation and Validation
- 23.9.1. Secondary Sources
- 23.9.2. Primary Sources
- 23.9.3. Statistical Modeling
24. MARKET OPPORTUNITIES BASED ON AREAS OF APPLICATION
- 24.1. Chapter Overview
- 24.2. Key Assumptions and Methodology
- 24.3. Revenue Shift Analysis
- 24.4. Market Movement Analysis
- 24.5. Penetration-Growth (P-G) Matrix
- 24.6. Bluetooth Low Energy Market for Automotive: Historical Trends (Since 2019) and Forecasted Estimates (Till 2035)
- 24.7. Bluetooth Low Energy Market for Consumer Electronics: Historical Trends (Since 2019) and Forecasted Estimates (Till 2035)
- 24.8. Bluetooth Low Energy Market for Healthcare: Historical Trends (Since 2019) and Forecasted Estimates (Till 2035)
- 24.9. Bluetooth Low Energy Market for Industrial Automation: Historical Trends (Since 2019) and Forecasted Estimates (Till 2035)
- 24.10. Bluetooth Low Energy Market for Smart Home: Historical Trends (Since 2019) and Forecasted Estimates (Till 2035)
- 24.11. Bluetooth Low Energy Market for Others: Historical Trends (Since 2019) and Forecasted Estimates (Till 2035)
- 24.12. Data Triangulation and Validation
- 24.12.1. Secondary Sources
- 24.12.2. Primary Sources
- 24.12.3. Statistical Modeling
25. MARKET OPPORTUNITIES BASED ON TYPE OF END USER
- 25.1. Chapter Overview
- 25.2. Key Assumptions and Methodology
- 25.3. Revenue Shift Analysis
- 25.4. Market Movement Analysis
- 25.5. Penetration-Growth (P-G) Matrix
- 25.6. Bluetooth Low Energy Market for BFSI: Historical Trends (Since 2019) and Forecasted Estimates (Till 2035)
- 25.7. Bluetooth Low Energy Market for Manufacturing: Historical Trends (Since 2019) and Forecasted Estimates (Till 2035)
- 25.8. Bluetooth Low Energy Market for IT & Telecommunications: Historical Trends (Since 2019) and Forecasted Estimates (Till 2035)
- 25.9. Bluetooth Low Energy Market for Retail: Historical Trends (Since 2019) and Forecasted Estimates (Till 2035)
- 25.10. Bluetooth Low Energy Market for Others: Historical Trends (Since 2019) and Forecasted Estimates (Till 2035)
- 25.11. Data Triangulation and Validation
- 25.11.1. Secondary Sources
- 25.11.2. Primary Sources
- 25.11.3. Statistical Modeling
26. MARKET OPPORTUNITIES BASED ON COMPANY SIZE
- 26.1. Chapter Overview
- 26.2. Key Assumptions and Methodology
- 26.3. Revenue Shift Analysis
- 26.4. Market Movement Analysis
- 26.5. Penetration-Growth (P-G) Matrix
- 26.6. Bluetooth Low Energy Market for Large Enterprises: Historical Trends (Since 2019) and Forecasted Estimates (Till 2035)
- 26.7. Bluetooth Low Energy Market for Small and Medium Enterprises: Historical Trends (Since 2019) and Forecasted Estimates (Till 2035)
- 26.8. Data Triangulation and Validation
- 26.8.1. Secondary Sources
- 26.8.2. Primary Sources
- 26.8.3. Statistical Modeling
27. MARKET OPPORTUNITIES FOR BLUETOOTH LOW ENERGY IN NORTH AMERICA
- 27.1. Chapter Overview
- 27.2. Key Assumptions and Methodology
- 27.3. Revenue Shift Analysis
- 27.4. Market Movement Analysis
- 27.5. Penetration-Growth (P-G) Matrix
- 27.6. Bluetooth Low Energy Market in North America: Historical Trends (Since 2019) and Forecasted Estimates (Till 2035)
- 27.6.1. Bluetooth Low Energy Market in the US: Historical Trends (Since 2019) and Forecasted Estimates (Till 2035)
- 27.6.2. Bluetooth Low Energy Market in Canada: Historical Trends (Since 2019) and Forecasted Estimates (Till 2035)
- 27.6.3. Bluetooth Low Energy Market in Mexico: Historical Trends (Since 2019) and Forecasted Estimates (Till 2035)
- 27.6.4. Bluetooth Low Energy Market in Other North American Countries: Historical Trends (Since 2019) and Forecasted Estimates (Till 2035)
- 27.7. Data Triangulation and Validation
28. MARKET OPPORTUNITIES FOR BLUETOOTH LOW ENERGY IN EUROPE
- 28.1. Chapter Overview
- 28.2. Key Assumptions and Methodology
- 28.3. Revenue Shift Analysis
- 28.4. Market Movement Analysis
- 28.5. Penetration-Growth (P-G) Matrix
- 28.6. Bluetooth Low Energy Market in Europe: Historical Trends (Since 2019) and Forecasted Estimates (Till 2035)
- 28.6.1. Bluetooth Low Energy Market in Austria: Historical Trends (Since 2019) and Forecasted Estimates (Till 2035)
- 28.6.2. Bluetooth Low Energy Market in Belgium: Historical Trends (Since 2019) and Forecasted Estimates (Till 2035)
- 28.6.3. Bluetooth Low Energy Market in Denmark: Historical Trends (Since 2019) and Forecasted Estimates (Till 2035)
- 28.6.4. Bluetooth Low Energy Market in France: Historical Trends (Since 2019) and Forecasted Estimates (Till 2035)
- 28.6.5. Bluetooth Low Energy Market in Germany: Historical Trends (Since 2019) and Forecasted Estimates (Till 2035)
- 28.6.6. Bluetooth Low Energy Market in Ireland: Historical Trends (Since 2019) and Forecasted Estimates (Till 2035)
- 28.6.7. Bluetooth Low Energy Market in Italy: Historical Trends (Since 2019) and Forecasted Estimates (Till 2035)
- 28.6.8. Bluetooth Low Energy Market in Netherlands: Historical Trends (Since 2019) and Forecasted Estimates (Till 2035)
- 28.6.9. Bluetooth Low Energy Market in Norway: Historical Trends (Since 2019) and Forecasted Estimates (Till 2035)
- 28.6.10. Bluetooth Low Energy Market in Russia: Historical Trends (Since 2019) and Forecasted Estimates (Till 2035)
- 28.6.11. Bluetooth Low Energy Market in Spain: Historical Trends (Since 2019) and Forecasted Estimates (Till 2035)
- 28.6.12. Bluetooth Low Energy Market in Sweden: Historical Trends (Since 2019) and Forecasted Estimates (Till 2035)
- 28.6.13. Bluetooth Low Energy Market in Switzerland: Historical Trends (Since 2019) and Forecasted Estimates (Till 2035)
- 28.6.14. Bluetooth Low Energy Market in the UK: Historical Trends (Since 2019) and Forecasted Estimates (Till 2035)
- 28.6.15. Bluetooth Low Energy Market in Other European Countries: Historical Trends (Since 2019) and Forecasted Estimates (Till 2035)
- 28.7. Data Triangulation and Validation
29. MARKET OPPORTUNITIES FOR BLUETOOTH LOW ENERGY IN ASIA
- 29.1. Chapter Overview
- 29.2. Key Assumptions and Methodology
- 29.3. Revenue Shift Analysis
- 29.4. Market Movement Analysis
- 29.5. Penetration-Growth (P-G) Matrix
- 29.6. Bluetooth Low Energy Market in Asia: Historical Trends (Since 2019) and Forecasted Estimates (Till 2035)
- 29.6.1. Bluetooth Low Energy Market in China: Historical Trends (Since 2019) and Forecasted Estimates (Till 2035)
- 29.6.2. Bluetooth Low Energy Market in India: Historical Trends (Since 2019) and Forecasted Estimates (Till 2035)
- 29.6.3. Bluetooth Low Energy Market in Japan: Historical Trends (Since 2019) and Forecasted Estimates (Till 2035)
- 29.6.4. Bluetooth Low Energy Market in Singapore: Historical Trends (Since 2019) and Forecasted Estimates (Till 2035)
- 29.6.5. Bluetooth Low Energy Market in South Korea: Historical Trends (Since 2019) and Forecasted Estimates (Till 2035)
- 29.6.6. Bluetooth Low Energy Market in Other Asian Countries: Historical Trends (Since 2019) and Forecasted Estimates (Till 2035)
- 29.7. Data Triangulation and Validation
30. MARKET OPPORTUNITIES FOR BLUETOOTH LOW ENERGY IN MIDDLE EAST AND NORTH AFRICA (MENA)
- 30.1. Chapter Overview
- 30.2. Key Assumptions and Methodology
- 30.3. Revenue Shift Analysis
- 30.4. Market Movement Analysis
- 30.5. Penetration-Growth (P-G) Matrix
- 30.6. Bluetooth Low Energy Market in Middle East and North Africa (MENA): Historical Trends (Since 2019) and Forecasted Estimates (Till 2035)
- 30.6.1. Bluetooth Low Energy Market in Egypt: Historical Trends (Since 2019) and Forecasted Estimates (Till 205)
- 30.6.2. Bluetooth Low Energy Market in Iran: Historical Trends (Since 2019) and Forecasted Estimates (Till 2035)
- 30.6.3. Bluetooth Low Energy Market in Iraq: Historical Trends (Since 2019) and Forecasted Estimates (Till 2035)
- 30.6.4. Bluetooth Low Energy Market in Israel: Historical Trends (Since 2019) and Forecasted Estimates (Till 2035)
- 30.6.5. Bluetooth Low Energy Market in Kuwait: Historical Trends (Since 2019) and Forecasted Estimates (Till 2035)
- 30.6.6. Bluetooth Low Energy Market in Saudi Arabia: Historical Trends (Since 2019) and Forecasted Estimates (Till 2035)
- 30.6.7. Bluetooth Low Energy Market in United Arab Emirates (UAE): Historical Trends (Since 2019) and Forecasted Estimates (Till 2035)
- 30.6.8. Bluetooth Low Energy Market in Other MENA Countries: Historical Trends (Since 2019) and Forecasted Estimates (Till 2035)
- 30.7. Data Triangulation and Validation
31. MARKET OPPORTUNITIES FOR BLUETOOTH LOW ENERGY IN LATIN AMERICA
- 31.1. Chapter Overview
- 31.2. Key Assumptions and Methodology
- 31.3. Revenue Shift Analysis
- 31.4. Market Movement Analysis
- 31.5. Penetration-Growth (P-G) Matrix
- 31.6. Bluetooth Low Energy Market in Latin America: Historical Trends (Since 2019) and Forecasted Estimates (Till 2035)
- 31.6.1. Bluetooth Low Energy Market in Argentina: Historical Trends (Since 2019) and Forecasted Estimates (Till 2035)
- 31.6.2. Bluetooth Low Energy Market in Brazil: Historical Trends (Since 2019) and Forecasted Estimates (Till 2035)
- 31.6.3. Bluetooth Low Energy Market in Chile: Historical Trends (Since 2019) and Forecasted Estimates (Till 2035)
- 31.6.4. Bluetooth Low Energy Market in Colombia Historical Trends (Since 2019) and Forecasted Estimates (Till 2035)
- 31.6.5. Bluetooth Low Energy Market in Venezuela: Historical Trends (Since 2019) and Forecasted Estimates (Till 2035)
- 31.6.6. Bluetooth Low Energy Market in Other Latin American Countries: Historical Trends (Since 2019) and Forecasted Estimates (Till 2035)
- 31.7. Data Triangulation and Validation
32. MARKET OPPORTUNITIES FOR BLUETOOTH LOW ENERGY IN REST OF THE WORLD
- 32.1. Chapter Overview
- 32.2. Key Assumptions and Methodology
- 32.3. Revenue Shift Analysis
- 32.4. Market Movement Analysis
- 32.5. Penetration-Growth (P-G) Matrix
- 32.6. Bluetooth Low Energy Market in Rest of the World: Historical Trends (Since 2019) and Forecasted Estimates (Till 2035)
- 32.6.1. Bluetooth Low Energy Market in Australia: Historical Trends (Since 2019) and Forecasted Estimates (Till 2035)
- 32.6.2. Bluetooth Low Energy Market in New Zealand: Historical Trends (Since 2019) and Forecasted Estimates (Till 2035)
- 32.6.3. Bluetooth Low Energy Market in Other Countries
- 32.7. Data Triangulation and Validation
33. MARKET CONCENTRATION ANALYSIS: DISTRIBUTION BY LEADING PLAYERS
- 33.1. Leading Player 1
- 33.2. Leading Player 2
- 33.3. Leading Player 3
- 33.4. Leading Player 4
- 33.5. Leading Player 5
- 33.6. Leading Player 6
- 33.7. Leading Player 7
- 33.8. Leading Player 8
34. ADJACENT MARKET ANALYSIS
SECTION VII: STRATEGIC TOOLS
35. KEY WINNING STRATEGIES
36. PORTER'S FIVE FORCES ANALYSIS
37. SWOT ANALYSIS
38. VALUE CHAIN ANALYSIS
39. ROOTS STRATEGIC RECOMMENDATIONS
- 39.1. Chapter Overview
- 39.2. Key Business-related Strategies
- 39.2.1. Research & Development
- 39.2.2. Product Manufacturing
- 39.2.3. Commercialization / Go-to-Market
- 39.2.4. Sales and Marketing
- 39.3. Key Operations-related Strategies
- 39.3.1. Risk Management
- 39.3.2. Workforce
- 39.3.3. Finance
- 39.3.4. Others
