

|
시장보고서
상품코드
2029028
삼투압 에너지 시장 : 기술, 용도, 최종사용자, 지역, 주요 기업별 : 산업 동향 및 세계 시장 예측(-2040년)Osmotic Energy Market, Till 2040: Distribution by Technology, Application, End User, Geographical Regions, and Key Players: Industry Trends and Global Forecasts |
||||||

삼투압 에너지 시장 전망
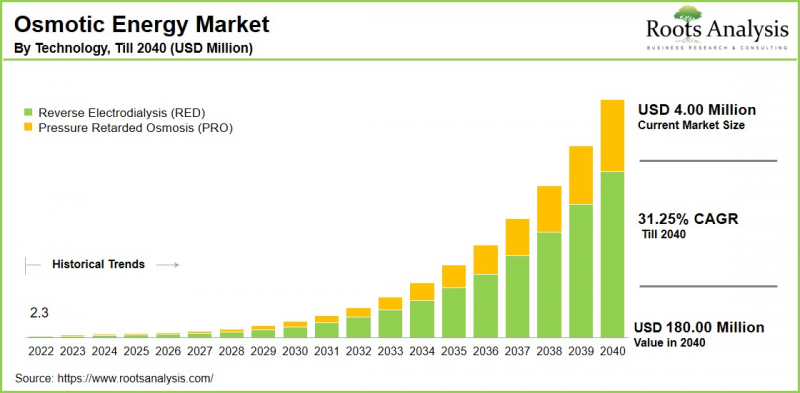
Roots Analysis의 조사에 따르면, 세계의 삼투압 에너지 시장 규모는 2040년까지 예측 기간 동안 CAGR 31.25%로 확대되어 현재 400만 달러에서 2040년에는 1억 8,000만 달러에 달할 것으로 추정됩니다.
삼투압 에너지 시장은 일반적으로 블루에너지라고 불리는 염분 농도 구배에 의해 발생하는 화학적 잠재력을 이용하여 발전하는 기술 및 관련 서비스를 포함합니다. 이 기술은 압력 지연 침투(PRO)와 역전기 투석(RED)을 이용하여 바닷물과 담수 사이의 자연적 차이를 사용 가능한 전력으로 변환합니다.
특히, 시장의 성장은 안정적이고 간헐적이지 않은 재생에너지원에 대한 수요 증가와 함께 산업용 수류로부터의 에너지 회수에 대한 관심 증가에 의해 주도되고 있습니다. 간헐적인 재생에너지와 달리 삼투압 에너지는 지속적인 전력 출력을 제공하기 때문에 태양광 및 풍력발전 시스템을 보완하는 데 매우 유용합니다. 주요 용도는 강 하구 지역의 발전, 수처리 인프라에의 통합 등을 들 수 있습니다. 전반적으로 삼투압 에너지 시장의 장기적인 성장은 지속적인 기술 발전과 경제적으로 지속가능한 솔루션을 제공할 수 있는 능력에 달려 있습니다.
삼투압 에너지 시장의 성장을 주도하는 주요 시장 촉진요인은 무엇인가?
삼투압 에너지 시장은 현대 에너지 시스템에서 신뢰할 수 있고 지속가능한 솔루션으로 성장하고 있습니다. 주요 장점 중 하나는 지속적이고 예측 가능한 기저부하 전력을 지속적으로 공급할 수 있어 태양광이나 풍력발전의 간헐성을 피할 수 있다는 점입니다. 이러한 특성은 특히 재생에너지 포트폴리오의 균형 조정이 필수적인 아시아태평양에서 송전망 안정화 및 24시간 전력 공급을 실현하기 위한 전략적 선택이 될 수 있습니다.
또한, 데이터센터 및 수소 제조 시설을 포함한 에너지 집약적 산업에서 엄격한 환경, 사회, 지배구조(ESG) 목표를 달성하기 위해 중단 없는 무탄소 전력에 대한 수요가 증가하고 있습니다. 또한, 고성능 소재 개발을 포함한 멤브레인 기술의 발전으로 출력 밀도가 향상되고 설치 공간의 요구 사항이 줄어들고 있습니다. 이러한 혁신은 높은 초기 투자 비용을 상쇄하고 주요 개발 지역에서 상업적 실현으로 가는 길을 가속화하고 있습니다.
삼투압 에너지 시장 : 기업의 경쟁 상황
삼투압 에너지 시장의 경쟁 구도는 DuPont, Eco Wave Power, Gradiant, Minesto, SUEZ, Statkraft, Sweetch Energy와 같은 주요 기업들 외에도 수많은 신생 혁신가들이 존재한다는 특징이 있습니다. 이들 기업은 다양한 기술 포트폴리오와 세계 진출을 통해 탄탄한 시장 지위를 유지하고 있습니다. 업계 관계자들은 혁신 가속화, 시장 침투력 강화, 확장성 향상을 위해 제휴, 파트너십, 사업 확장 노력에 점점 더 집중하고 있습니다. 예를 들어, Aquastill은 멤브레인 기술을 이용한 지속가능한 수처리 및 발전 추진을 위한 공동 프로젝트를 진행하고 있습니다. 또한, SaltPower는 Innovation Fund Denmark로부터 압력 지연 침투(PRO) 기술의 추가 개발 및 규모 확장을 위한 자금 지원을 받았습니다. 이러한 노력은 상업화를 촉진하고 삼투압 에너지 솔루션을 보다 광범위한 다중 자원 및 지속가능한 인프라 플랫폼에 통합하는 데 도움이 될 것으로 기대됩니다.
삼투압 에너지 시장은 유럽이 주도
현재 유럽이 세계 시장에서 가장 큰 점유율을 차지하고 있습니다. 이러한 우위는 집중적인 연구개발 활동, 지속적인 공적 자금 투입, 풍부한 파일럿 프로젝트 실적이 뒷받침하고 있습니다. 한편, 아시아태평양 시장은 광활한 해안선과 강 삼각주와 같은 유리한 조건, 증가하는 산업 에너지 수요, 발전하는 재생에너지 정책에 힘입어 CAGR로 성장할 것으로 예상됩니다.
삼투압 에너지 시장 : 주요 시장 세분화
기술별 시장 점유율
- 압력 지연 침투(PRO)
- 역전기투석(RED)
용도별 시장 점유율
- 발전
- 수처리 및 담수화
최종사용자별 시장 점유율
- 상업
- 산업
- 주택
지역별 시장 점유율
- 북미
- 미국
- 캐나다
- 멕시코
- 북미 기타
- 유럽
- 오스트리아
- 벨기에
- 덴마크
- 프랑스
- 독일
- 아일랜드
- 이탈리아
- 네덜란드
- 노르웨이
- 러시아
- 스페인
- 스웨덴
- 스위스
- 영국
- 기타 유럽 국가
- 아시아태평양
- 호주
- 중국
- 인도
- 일본
- 뉴질랜드
- 싱가포르
- 한국
- 기타 아시아태평양
- 라틴아메리카
- 브라질
- 칠레
- 콜롬비아
- 베네수엘라
- 기타 라틴아메리카
- 중동 및 아프리카
- 이집트
- 이란
- 이라크
- 이스라엘
- 쿠웨이트
- 사우디아라비아
- 아랍에미리트
- 기타 중동 및 아프리카
세계의 삼투압 에너지 시장을 조사했으며, 시장 개요와 배경, 시장 영향요인 분석, 시장 규모 추정 및 예측, 각종 부문별 상세 분석, 경쟁 상황, 주요 기업 개요 등의 정보를 정리하여 전해드립니다.
목차
제1장 프로젝트 개요
제2장 조사 방법
제3장 시장 역학
제4장 거시경제 지표
제5장 주요 요약
제6장 소개
제7장 규제 시나리오
제8장 주요 기업의 종합적 데이터베이스
제9장 경쟁 구도
제10장 화이트 스페이스 분석
제11장 기업 경쟁력 분석
제12장 스타트업 생태계
제13장 기업 개요
제14장 메가트렌드 분석
제15장 미충족 수요 분석
제16장 특허 분석
제17장 최근 동향
제18장 세계의 삼투압 에너지 시장
제19장 기술별 시장 기회
제20장 용도별 시장 기회
제21장 최종사용자별 시장 기회
제22장 북미의 삼투압 에너지 시장 기회
제23장 유럽의 삼투압 에너지 시장 기회
제24장 아시아태평양의 삼투압 에너지 시장 기회
제25장 라틴아메리카의 삼투압 에너지 시장 기회
제26장 중동 및 아프리카의 삼투압 에너지 시장 기회
제27장 시장 집중도 분석 : 주요 기업 분포
제28장 인접 시장 분석
제29장 승리를 위한 중요한 전략
제30장 Porter's Five Forces 분석
제31장 SWOT 분석
제32장 밸류체인 분석
제33장 ROOTS에 의한 전략 제안
제34장 1차 조사로부터의 인사이트
제35장 보고서 결론
제36장 표형식 데이터
제37장 기업 및 조직 리스트
KSM 26.05.21Osmotic Energy Market Outlook
As per Roots Analysis, the global osmotic energy market size is estimated to grow from USD 4.00 million in current year to USD 180 million by 2040, at a CAGR of 31.25%, during the forecast period, till 2040.
The osmotic energy market encompasses technologies and associated services that generate electricity by harnessing the chemical potential created by salinity gradients, commonly referred to as "blue energy." This approach utilizes pressure-retarded osmosis (PRO) and reverse electrodialysis (RED) to convert the natural difference between saltwater and freshwater into usable power.
Notably, the market growth is being driven by the increasing demand for stable, non-intermittent renewable energy sources, along with rising interest in recovering energy from industrial water streams. Unlike intermittent renewables, osmotic energy provides a continuous power output, positioning it as a valuable complement to solar and wind energy systems. Key applications include power generation in coastal estuaries and integration into water treatment infrastructure. Overall, the long-term growth of the osmotic energy market will depend on continued technological progress and the ability to deliver economically sustainable solutions.
Strategic Insights for Senior Leaders
Key Drivers Propelling Growth of Osmotic Energy Market
The osmotic energy market is gaining momentum as a reliable and sustainable solution for modern energy systems. One of its key advantages lies in its ability to provide continuous, predictable baseload power, thereby avoiding the intermittency associated with solar and wind energy. This makes it a strategic option for grid stabilization and round-the-clock power supply, particularly in regions such as Asia-Pacific where balancing renewable energy portfolios is critical.
Additionally, there is a growing demand from energy-intensive industries, including data centers and hydrogen production facilities, for uninterrupted, carbon-free electricity to meet stringent environmental, social, and governance (ESG) objectives. Furthermore, advancements in membrane technologies, including the development of high-performance materials, are improving power density and reducing space requirements. These innovations are helping to offset high initial capital costs and are accelerating the pathway towards commercial viability in key development regions.
Osmotic Energy Market: Competitive Landscape of Companies in this Industry
The competitive landscape of the osmotic energy market is defined by the presence of key players such as DuPont, Eco Wave Power, Gradiant, Minesto, SUEZ, Statkraft, and Sweetch Energy, alongside several emerging innovators. These companies maintain strong market positions through diverse technology portfolios and global presence. Industry participants are increasingly focusing on collaborations, partnerships, and expansion initiatives to accelerate innovation, enhance market penetration, and improve scalability. For instance, Aquastill has engaged in collaborative projects aimed at advancing sustainable water treatment and energy generation using membrane-based technologies. Similarly, SaltPower has secured funding support from Innovation Fund Denmark to further develop and scale its pressure-retarded osmosis (PRO) technology. Such initiatives are expected to drive commercialization efforts and facilitate the integration of osmotic energy solutions into broader multi-resource and sustainable infrastructure platforms.
Europe Dominates the Osmotic Energy Market
According to our analysis, in the current year, Europe captures the highest share of the global osmotic energy market. This dominance is primarily driven by concentrated research and development activities, consistent public funding, and a strong presence of operational pilot projects. In contrast, the Asia-Pacific market is anticipated to grow at a CAGR, driven by favorable geographic conditions including extensive coastlines and river deltas, increasing industrial energy demand, and evolving renewable energy policies.
Key Challenges in the Osmotic Energy Market
The osmotic energy market faces several significant challenges that may limit its large-scale adoption and commercial viability. One of the primary constraints is the high levelized cost of energy (LCOE), driven by substantial capital expenditure requirements for specialized membranes and extensive infrastructure. This makes it less cost-competitive compared to mature renewable technologies such as solar and wind.
Additionally, operational issues such as membrane fouling and mineral scaling pose persistent challenges, leading to increased maintenance needs, reduced system efficiency over time, and higher operating costs. This impacts the long-term reliability of pressure-retarded osmosis (PRO) and reverse electrodialysis (RED) systems. Furthermore, the industry is hindered by an underdeveloped supply chain and a lack of standardized components, particularly for large-scale membranes and salinity management equipment. This results in higher procurement costs, extended lead times, and elevated project execution risks, further constraining the growth potential of the osmotic energy sector.
Osmotic Energy Market: Key Market Segmentation
Market Share by Technology
- Pressure Retarded Osmosis (PRO)
- Reverse Electrodialysis (RED)
Market Share by Application
- Power Generation
- Water Treatment and Desalination
Market Share by End User
- Commercial
- Industrial
- Residential
Market Share by Geographical Regions
- North America
- US
- Canada
- Mexico
- Rest of North America
- Europe
- Austria
- Belgium
- Denmark
- France
- Germany
- Ireland
- Italy
- Netherlands
- Norway
- Russia
- Spain
- Sweden
- Switzerland
- UK
- Rest of Europe
- Asia-Pacific
- Australia
- China
- India
- Japan
- New-Zealand
- Singapore
- South Korea
- Rest of Asia-Pacific
- Latin America
- Brazil
- Chile
- Colombia
- Venezuela
- Rest of Latin America
- Middle East and Africa (MEA)
- Egypt
- Iran
- Iraq
- Israel
- Kuwait
- Saudi Arabia
- UAE
- Rest of MEA
Example Players in Osmotic Energy Market
- Aqua Battery
- Aquastill
- DuPont
- Eco Wave Power
- Gradiant
- Minesto
- Ocean Grazer
- Pani
- REDstack
- REGENERATE
- Renergen
- Salinity Solutions
- SaltPower
- Sea6 Energy
- Statkraft
- SUEZ
- Sweetch Energy
Osmotic Energy Market: Report Coverage
The report on the osmotic energy market features insights on various sections, including:
- Market Sizing and Opportunity Analysis: An in-depth analysis of the osmotic energy market, focusing on key market segments, including [A] technology, [B] application, [C] end user, [D] geographical regions, and [E] key players.
- Competitive Landscape: A comprehensive analysis of the companies engaged in the osmotic energy market, based on several relevant parameters, such as [A] year of establishment, [B] company size, [C] location of headquarters and [D] ownership structure.
- Company Profiles: Elaborate profiles of prominent players engaged in the osmotic energy market, providing details on [A] location of headquarters, [B] company size, [C] company mission, [D] company footprint, [E] management team, [F] contact details, [G] financial information, [H] operating business segments, [I] product / technology portfolio, [J] recent developments, and an informed future outlook.
- Megatrends: An evaluation of ongoing megatrends in the osmotic energy industry.
- Patent Analysis: An insightful analysis of patents filed / granted in the osmotic energy domain, based on relevant parameters, including [A] type of patent, [B] patent publication year, [C] patent age and [D] leading players.
- Recent Developments: An overview of the recent developments made in the osmotic energy market, along with analysis based on relevant parameters, including [A] year of initiative, [B] type of initiative, [C] geographical distribution and [D] most active players.
- Porter's Five Forces Analysis: An analysis of five competitive forces prevailing in the osmotic energy market, including threats of new entrants, bargaining power of buyers, bargaining power of suppliers, threats of substitute products and rivalry among existing competitors.
- SWOT Analysis: An insightful SWOT framework, highlighting the strengths, weaknesses, opportunities and threats in the domain. Additionally, it provides Harvey ball analysis, highlighting the relative impact of each SWOT parameter.
Key Questions Answered in this Report
- What is the current and future market size?
- Who are the leading companies in this market?
- What are the growth drivers that are likely to influence the evolution of this market?
- What are the key partnership and funding trends shaping this industry?
- Which region is likely to grow at higher CAGR till 2040?
- How is the current and future market opportunity likely to be distributed across key market segments?
Reasons to Buy this Report
- Detailed Market Analysis: The report provides a comprehensive market analysis, offering detailed revenue projections of the overall market and its specific sub-segments. This information is valuable to both established market leaders and emerging entrants.
- In-depth Analysis of Trends: Stakeholders can leverage the report to gain a deeper understanding of the competitive dynamics within the market. Each report maps ecosystem activity across partnerships, funding, and patent landscapes to reveal growth hotspots and white spaces in the industry.
- Opinion of Industry Experts: The report features extensive interviews and surveys with key opinion leaders and industry experts to validate market trends mentioned in the report.
- Decision-ready Deliverables: The report offers stakeholders with strategic frameworks (Porter's Five Forces, value chain, SWOT), and complimentary Excel / slide packs with customization support.
Additional Benefits
- Complimentary Dynamic Excel Dashboards for Analytical Modules
- Exclusive 15% Free Content Customization
- Personalized Interactive Report Walkthrough with Our Expert Research Team
- Free Report Updates for Versions Older than 6-12 Months
TABLE OF CONTENTS
1. PROJECT OVERVIEW
- 1.1. Context
- 1.2. Project Objectives
2. RESEARCH METHODOLOGY
- 2.1. Chapter Overview
- 2.2. Research Assumptions
- 2.3. Database Building
- 2.3.1. Data Collection
- 2.3.2. Data Validation
- 2.3.3. Data Analysis
- 2.4. Project Methodology
- 2.4.1. Secondary Research
- 2.4.1.1. Annual Reports
- 2.4.1.2. Academic Research Papers
- 2.4.1.3. Company Websites
- 2.4.1.4. Investor Presentations
- 2.4.1.5. Regulatory Filings
- 2.4.1.6. White Papers
- 2.4.1.7. Industry Publications
- 2.4.1.8. Conferences and Seminars
- 2.4.1.9. Government Portals
- 2.4.1.10. Media and Press Releases
- 2.4.1.11. Newsletters
- 2.4.1.12. Industry Databases
- 2.4.1.13. Roots Proprietary Databases
- 2.4.1.14. Paid Databases and Sources
- 2.4.1.15. Social Media Portals
- 2.4.1.16. Other Secondary Sources
- 2.4.2. Primary Research
- 2.4.2.1. Introduction
- 2.4.2.2. Types
- 2.4.2.2.1. Qualitative
- 2.4.2.2.2. Quantitative
- 2.4.2.3. Advantages
- 2.4.2.4. Techniques
- 2.4.2.4.1. Interviews
- 2.4.2.4.2. Surveys
- 2.4.2.4.3. Focus Groups
- 2.4.2.4.4. Observational Research
- 2.4.2.4.5. Social Media Interactions
- 2.4.2.5. Stakeholders
- 2.4.2.5.1. Company Executives (CXOs)
- 2.4.2.5.2. Board of Directors
- 2.4.2.5.3. Company Presidents and Vice Presidents
- 2.4.2.5.4. Key Opinion Leaders
- 2.4.2.5.5. Research and Development Heads
- 2.4.2.5.6. Technical Experts
- 2.4.2.5.7. Subject Matter Experts
- 2.4.2.5.8. Scientists
- 2.4.2.5.9. Doctors and Other Healthcare Providers
- 2.4.2.6. Ethics and Integrity
- 2.4.2.6.1. Research Ethics
- 2.4.2.6.2. Data Integrity
- 2.4.3. Analytical Tools and Databases
- 2.4.1. Secondary Research
3. MARKET DYNAMICS
- 3.1. Forecast Methodology
- 3.1.1. Top-Down Approach
- 3.1.2. Bottom-Up Approach
- 3.1.3. Hybrid Approach
- 3.2. Market Assessment Framework
- 3.2.1. Total Addressable Market (TAM)
- 3.2.2. Serviceable Addressable Market (SAM)
- 3.2.3. Serviceable Obtainable Market (SOM)
- 3.2.4. Currently Acquired Market (CAM)
- 3.3. Forecasting Tools and Techniques
- 3.3.1. Qualitative Forecasting
- 3.3.2. Correlation
- 3.3.3. Regression
- 3.3.4. Time Series Analysis
- 3.3.5. Extrapolation
- 3.3.6. Convergence
- 3.3.7. Forecast Error Analysis
- 3.3.8. Data Visualization
- 3.3.9. Scenario Planning
- 3.3.10. Sensitivity Analysis
- 3.4. Key Considerations
- 3.4.1. Demographics
- 3.4.2. Market Access
- 3.4.3. Reimbursement Scenarios
- 3.4.4. Industry Consolidation
- 3.5. Robust Quality Control
- 3.6. Key Market Segmentations
- 3.7. Limitations
4. MACRO-ECONOMIC INDICATORS
- 4.1. Chapter Overview
- 4.2. Market Dynamics
- 4.2.1. Time Period
- 4.2.1.1. Historical Trends
- 4.2.1.2. Current and Forecasted Estimates
- 4.2.2. Currency Coverage
- 4.2.2.1. Overview of Major Currencies Affecting the Market
- 4.2.2.2. Impact of Currency Fluctuations on the Industry
- 4.2.3. Foreign Exchange Impact
- 4.2.3.1. Evaluation of Foreign Exchange Rates and Their Impact on Market
- 4.2.3.2. Strategies for Mitigating Foreign Exchange Risk
- 4.2.4. Recession
- 4.2.4.1. Historical Analysis of Past Recessions and Lessons Learnt
- 4.2.4.2. Assessment of Current Economic Conditions and Potential Impact on the Market
- 4.2.5. Inflation
- 4.2.5.1. Measurement and Analysis of Inflationary Pressures in the Economy
- 4.2.5.2. Potential Impact of Inflation on the Market Evolution
- 4.2.6. Interest Rates
- 4.2.6.1. Overview of Interest Rates and Their Impact on the Market
- 4.2.6.2. Strategies for Managing Interest Rate Risk
- 4.2.7. Commodity Flow Analysis
- 4.2.7.1. Type of Commodity
- 4.2.7.2. Origins and Destinations
- 4.2.7.3. Values and Weights
- 4.2.7.4. Modes of Transportation
- 4.2.8. Global Trade Dynamics
- 4.2.8.1. Import Scenario
- 4.2.8.2. Export Scenario
- 4.2.9. War Impact Analysis
- 4.2.9.1. Russian-Ukraine War
- 4.2.9.2. Israel-Hamas War
- 4.2.10. COVID Impact / Related Factors
- 4.2.10.1. Global Economic Impact
- 4.2.10.2. Industry-specific Impact
- 4.2.10.3. Government Response and Stimulus Measures
- 4.2.10.4. Future Outlook and Adaptation Strategies
- 4.2.11. Other Indicators
- 4.2.11.1. Fiscal Policy
- 4.2.11.2. Consumer Spending
- 4.2.11.3. Gross Domestic Product (GDP)
- 4.2.11.4. Employment
- 4.2.11.5. Taxes
- 4.2.11.6. R&D Innovation
- 4.2.11.7. Stock Market Performance
- 4.2.11.8. Supply Chain
- 4.2.11.9. Cross-Border Dynamics
- 4.2.1. Time Period
- 4.3. Concluding Remarks
5. EXECUTIVE SUMMARY
6. INTRODUCTION
- 6.1. Overview of Osmotic Energy Market
- 6.2. Application of Osmotic Energy
- 6.3. Advantages of Osmotic Energy
- 6.4. Challenges Associated with Polyols
- 6.5. Future Perspective
7. REGULATORY SCENARIO
8. COMPREHENSIVE DATABASE OF LEADING PLAYERS
9. COMPETITIVE LANDSCAPE
- 9.1. Chapter Overview
- 9.2. Osmotic Energy Market: Overall Market Landscape
- 9.2.1. Analysis by Year of Establishment
- 9.2.2. Analysis by Company Size
- 9.2.3. Analysis by Location of Headquarters
- 9.2.4. Analysis by Type of Company
- 9.2.5. Analysis by Technology
- 9.2.6. Analysis by End Use Industry
- 9.3. Key Findings
10. WHITE SPACE ANALYSIS
11. COMPANY COMPETITIVENESS ANALYSIS
12. STARTUP ECOSYSTEM ANALYSIS
- 12.1. Osmotic Energy Market: Startup Ecosystem Analysis
- 12.1.1. Analysis by Year of Establishment
- 12.1.2. Analysis by Company Size
- 12.1.3. Analysis by Location of Headquarters
- 12.1.4. Analysis by Ownership Type
- 12.1.5. Analysis by Technology
- 12.1.6. Analysis by End Use Industry
- 12.2. Key Findings
13. COMPANY PROFILES
- 13.1. Chapter Overview
- 13.2. Aqua Battery *
- 13.2.1. Company Overview
- 13.2.2. Company Mission
- 13.2.3. Company Footprint
- 13.2.4. Management Team
- 13.2.5. Contact Details
- 13.2.6. Financial Performance
- 13.2.7. Operating Business Segments
- 13.2.8. Service / Product Portfolio (project specific)
- 13.2.9. MOAT Analysis
- 13.2.10. Recent Developments and Future Outlook
- Similar details are presented for other companies mentioned below (based on information in the public domain)
- 13.3. Aquastill
- 13.4. DuPont
- 13.5. Eco Wave Power
- 13.6. Gradiant
- 13.7. Minesto
- 13.8. Ocean Grazer
- 13.9. Pani
- 13.10. REDstack
- 13.11. REGENERATE
- 13.12. Renergen
- 13.13. Salinity Solutions
- 13.14. SaltPower
- 13.15. Sea6 Energy
- 13.16. Statkraft
- 13.17. SUEZ
- 13.18. Sweetch Energy
14. MEGA TRENDS ANALYSIS
15. UNMET NEED ANALYSIS
16. PATENT ANALYSIS
17. RECENT DEVELOPMENTS
- 17.1. Chapter Overview
- 17.2. Recent Funding
- 17.3. Recent Partnerships
- 17.4. Other Recent Initiatives
18. GLOBAL OSMOTIC ENERGY MARKET
- 18.1. Chapter Overview
- 18.2. Key Assumptions and Methodology
- 18.3. Trends Disruption Impacting Market
- 18.4. Demand Side Trends
- 18.5. Supply Side Trends
- 18.6. Global Osmotic Energy Market Historical Trends (Since 2022) and Forecasted Estimates (Till 2040)
- 18.7. Multivariate Scenario Analysis
- 18.7.1. Conservative Scenario
- 18.7.2. Optimistic Scenario
- 18.8. Investment Feasibility Index
- 18.9. Key Market Segmentations
19. MARKET OPPORTUNITIES BASED ON TECHNOLOGY
- 19.1. Chapter Overview
- 19.2. Key Assumptions and Methodology
- 19.3. Revenue Shift Analysis
- 19.4. Market Movement Analysis
- 19.5. Penetration-Growth (P-G) Matrix
- 19.6. Osmotic Energy Market for Pressure Retarded Osmosis (PRO): Historical Trends (Since 2022) and Forecasted Estimates (Till 2040)
- 19.7. Osmotic Energy Market for Reverse Electrodialysis (RED): Historical Trends (Since 2022) and Forecasted Estimates (Till 2040)
- 19.8. Data Triangulation and Validation
- 19.8.1. Secondary Sources
- 19.8.2. Primary Sources
- 19.8.3. Statistical Modeling
20. MARKET OPPORTUNITIES BASED ON APPLICATION
- 20.1. Chapter Overview
- 20.2. Key Assumptions and Methodology
- 20.3. Revenue Shift Analysis
- 20.4. Market Movement Analysis
- 20.5. Penetration-Growth (P-G) Matrix
- 20.6. Osmotic Energy Market for Power Generation: Historical Trends (Since 2022) and Forecasted Estimates (Till 2040)
- 20.7. Osmotic Energy Market for Water Treatment and Desalination: Historical Trends (Since 2022) and Forecasted Estimates (Till 2040)
- 20.8. Data Triangulation and Validation
- 20.8.1. Secondary Sources
- 20.8.2. Primary Sources
- 20.8.3. Statistical Modeling
21. MARKET OPPORTUNITIES BASED ON END USER
- 21.1. Chapter Overview
- 21.2. Key Assumptions and Methodology
- 21.3. Revenue Shift Analysis
- 21.4. Market Movement Analysis
- 21.5. Penetration-Growth (P-G) Matrix
- 21.6. Osmotic Energy Market for Commercial: Historical Trends (Since 2022) and Forecasted Estimates (Till 2040)
- 21.7. Osmotic Energy Market for Industrial: Historical Trends (Since 2022) and Forecasted Estimates (Till 2040)
- 21.8. Osmotic Energy Market for Residential: Historical Trends (Since 2022) and Forecasted Estimates (Till 2040)
- 21.9. Data Triangulation and Validation
- 21.9.1. Secondary Sources
- 21.9.2. Primary Sources
- 21.9.3. Statistical Modeling
22. MARKET OPPORTUNITIES FOR OSMOTIC ENERGY IN NORTH AMERICA
- 22.1. Chapter Overview
- 22.2. Key Assumptions and Methodology
- 22.3. Revenue Shift Analysis
- 22.4. Market Movement Analysis
- 22.5. Penetration-Growth (P-G) Matrix
- 22.6. Osmotic Energy Market in North America: Historical Trends (Since 2022) and Forecasted Estimates (Till 2040)
- 22.6.1. Osmotic Energy Market in the US: Historical Trends (Since 2022) and Forecasted Estimates (Till 2040)
- 22.6.2. Osmotic Energy Market in Canada: Historical Trends (Since 2022) and Forecasted Estimates (Till 2040)
- 22.6.3. Osmotic Energy Market in Mexico: Historical Trends (Since 2022) and Forecasted Estimates (Till 2040)
- 22.6.4. Osmotic Energy Market in Rest of North America: Historical Trends (Since 2022) and Forecasted Estimates (Till 2040)
- 22.7. Data Triangulation and Validation
23. MARKET OPPORTUNITIES FOR OSMOTIC ENERGY IN EUROPE
- 23.1. Chapter Overview
- 23.2. Key Assumptions and Methodology
- 23.3. Revenue Shift Analysis
- 23.4. Market Movement Analysis
- 23.5. Penetration-Growth (P-G) Matrix
- 23.6. Osmotic Energy Market in Europe: Historical Trends (Since 2022) and Forecasted Estimates (Till 2040)
- 23.6.1. Osmotic Energy Market in Austria: Historical Trends (Since 2022) and Forecasted Estimates (Till 2040)
- 23.6.2. Osmotic Energy Market in Belgium: Historical Trends (Since 2022) and Forecasted Estimates (Till 2040)
- 23.6.3. Osmotic Energy Market in Denmark: Historical Trends (Since 2022) and Forecasted Estimates (Till 2040)
- 23.6.4. Osmotic Energy Market in France: Historical Trends (Since 2022) and Forecasted Estimates (Till 2040)
- 23.6.5. Osmotic Energy Market in Germany: Historical Trends (Since 2022) and Forecasted Estimates (Till 2040)
- 23.6.6. Osmotic Energy Market in Ireland: Historical Trends (Since 2022) and Forecasted Estimates (Till 2040)
- 23.6.7. Osmotic Energy Market in Italy: Historical Trends (Since 2022) and Forecasted Estimates (Till 2040)
- 23.6.8. Osmotic Energy Market in the Netherlands: Historical Trends (Since 2022) and Forecasted Estimates (Till 2040)
- 23.6.9. Osmotic Energy Market in Norway: Historical Trends (Since 2022) and Forecasted Estimates (Till 2040)
- 23.6.10. Osmotic Energy Market in Russia: Historical Trends (Since 2022) and Forecasted Estimates (Till 2040)
- 23.6.11. Osmotic Energy Market in Spain: Historical Trends (Since 2022) and Forecasted Estimates (Till 2040)
- 23.6.12. Osmotic Energy Market in Sweden: Historical Trends (Since 2022) and Forecasted Estimates (Till 2040)
- 23.6.13. Osmotic Energy Market in Switzerland: Historical Trends (Since 2022) and Forecasted Estimates (Till 2040)
- 23.6.14. Osmotic Energy Market in the UK: Historical Trends (Since 2022) and Forecasted Estimates (Till 2040)
- 23.6.15. Osmotic Energy Market in Rest of Europe: Historical Trends (Since 2022) and Forecasted Estimates (Till 2040)
- 23.7. Data Triangulation and Validation
24. MARKET OPPORTUNITIES FOR OSMOTIC ENERGY IN ASIA-PACIFIC
- 24.1. Chapter Overview
- 24.2. Key Assumptions and Methodology
- 24.3. Revenue Shift Analysis
- 24.4. Market Movement Analysis
- 24.5. Penetration-Growth (P-G) Matrix
- 24.6. Osmotic Energy Market in Asia-Pacific: Historical Trends (Since 2022) and Forecasted Estimates (Till 2040)
- 24.6.1. Osmotic Energy Market in China: Historical Trends (Since 2022) and Forecasted Estimates (Till 2040)
- 24.6.2. Osmotic Energy Market in India: Historical Trends (Since 2022) and Forecasted Estimates (Till 2040)
- 24.6.3. Osmotic Energy Market in Japan: Historical Trends (Since 2022) and Forecasted Estimates (Till 2040)
- 24.6.4. Osmotic Energy Market in Singapore: Historical Trends (Since 2022) and Forecasted Estimates (Till 2040)
- 24.6.5. Osmotic Energy Market in South Korea: Historical Trends (Since 2022) and Forecasted Estimates (Till 2040)
- 24.6.6. Osmotic Energy Market in Rest of Asia-Pacific: Historical Trends (Since 2022) and Forecasted Estimates (Till 2040)
- 24.7. Data Triangulation and Validation
25. MARKET OPPORTUNITIES FOR OSMOTIC ENERGY IN LATIN AMERICA
- 25.1. Chapter Overview
- 25.2. Key Assumptions and Methodology
- 25.3. Revenue Shift Analysis
- 25.4. Market Movement Analysis
- 25.5. Penetration-Growth (P-G) Matrix
- 25.6. Osmotic Energy Market in Latin America: Historical Trends (Since 2022) and Forecasted Estimates (Till 2040)
- 25.6.1. Osmotic Energy Market in Argentina: Historical Trends (Since 2022) and Forecasted Estimates (Till 2040)
- 25.6.2. Osmotic Energy Market in Brazil: Historical Trends (Since 2022) and Forecasted Estimates (Till 2040)
- 25.6.3. Osmotic Energy Market in Chile: Historical Trends (Since 2022) and Forecasted Estimates (Till 2040)
- 25.6.4. Osmotic Energy Market in Colombia Historical Trends (Since 2022) and Forecasted Estimates (Till 2040)
- 25.6.5. Osmotic Energy Market in Venezuela: Historical Trends (Since 2022) and Forecasted Estimates (Till 2040)
- 25.6.6. Osmotic Energy Market in Rest of Latin America: Historical Trends (Since 2022) and Forecasted Estimates (Till 2040)
- 25.7. Data Triangulation and Validation
26. MARKET OPPORTUNITIES FOR OSMOTIC ENERGY IN MIDDLE EAST AND AFRICA (MEA)
- 26.1. Chapter Overview
- 26.2. Key Assumptions and Methodology
- 26.3. Revenue Shift Analysis
- 26.4. Market Movement Analysis
- 26.5. Penetration-Growth (P-G) Matrix
- 26.6. Osmotic Energy Market in Middle East and Africa (MEA): Historical Trends (Since 2022) and Forecasted Estimates (Till 2040)
- 26.6.1. Osmotic Energy Market in Egypt: Historical Trends (Since 2022) and Forecasted Estimates (Till 2040)
- 26.6.2. Osmotic Energy Market in Iran: Historical Trends (Since 2022) and Forecasted Estimates (Till 2040)
- 26.6.3. Osmotic Energy Market in Iraq: Historical Trends (Since 2022) and Forecasted Estimates (Till 2040)
- 26.6.4. Osmotic Energy Market in Israel: Historical Trends (Since 2022) and Forecasted Estimates (Till 2040)
- 26.6.5. Osmotic Energy Market in Kuwait: Historical Trends (Since 2022) and Forecasted Estimates (Till 2040)
- 26.6.6. Osmotic Energy Market in Saudi Arabia: Historical Trends (Since 2022) and Forecasted Estimates (Till 2040)
- 26.6.7. Osmotic Energy Market in United Arab Emirates (UAE): Historical Trends (Since 2022) and Forecasted Estimates (Till 2040)
- 26.6.8. Osmotic Energy Market in Rest of MEA: Historical Trends (Since 2022) and Forecasted Estimates (Till 2040)
- 26.7. Data Triangulation and Validation
27. MARKET CONCENTRATION ANALYSIS: DISTRIBUTION BY LEADING PLAYERS
28. ADJACENT MARKET ANALYSIS
29. KEY WINNING STRATEGIES
30. PORTER'S FIVE FORCES ANALYSIS
31. SWOT ANALYSIS
32. VALUE CHAIN ANALYSIS
33. ROOTS STRATEGIC RECOMMENDATIONS
- 33.1. Chapter Overview
- 33.2. Key Business-related Strategies
- 33.2.1. Research & Development
- 33.2.2. Product Manufacturing
- 33.2.3. Commercialization / Go-to-Market
- 33.2.4. Sales and Marketing
- 33.3. Key Operations-related Strategies
- 33.3.1. Risk Management
- 33.3.2. Workforce
- 33.3.3. Finance
- 33.3.4. Others


