|
시장보고서
상품코드
2081170
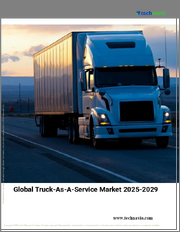
TaaS(Truck-as-a-Service) 시장 예측(-2034년) : 서비스 유형, 트럭 유형, 추진 방식, 기술, 용도, 최종사용자, 지역별 세계 분석Truck-as-a-Service Market Forecasts to 2034 - Global Analysis By Service Type, Truck Type, Propulsion Type, Technology, Application, End User and By Geography |
||||||

Stratistics MRC에 따르면 세계의 TaaS(Truck-as-a-Service) 시장은 2026년에 523억 달러 규모에 달하고, 2034년까지 1,428억 달러에 달할 것으로 예상되며, 예측 기간 동안 CAGR 13.4%로 성장할 것으로 전망됩니다.
TaaS(Truck-as-a-Service)란, 차량 운영 사업자가 차량을 완전히 소유하는 대신, 구독, 종량제 또는 관리형 서비스와 같은 계약 형태를 통해 운송 역량을 확보하는 새로운 상용차 이용 모델입니다. 이 모델에서는 실제 차량에 더해 텔레매틱스, 예측 유지보수, 경로 최적화, 커넥티드 차량 관리 플랫폼을 통합하여 종합적인 패키지 서비스로 제공됩니다.
자본 효율화 요구와 차량 함대의 현대화에 대한 압박으로 인해, 구독형 트럭의 도입이 가속화
물류 사업자들의 운전자금 부족이 심화되는 가운데, 막대한 초기 차량 조달 비용을 없애고 운영 리스크를 TaaS 제공업체로 이전하는 ‘자산 경량형’ 차량 운용 모델에 대한 구조적인 관심이 높아지고 있습니다. 전동화, 첨단 ADAS 시스템, 커넥티드 플릿 플랫폼 등을 포함한 상용차의 급속한 기술 발전으로 인해 자산이 조기에 노후화될 위험이 높아지면서, 트럭을 완전히 소유하는 것은 점점 더 비용이 많이 드는 일이 되고 있습니다. TaaS 계약을 통해 사업자는 예측 가능한 정기적인 지불을 통해 최신형 전기 트럭 및 커넥티드 트럭 플랫폼을 이용할 수 있게 되며, 기존에 상용차 투자에 따르던 대차대조표상의 부담 없이 차량 함대의 현대화를 촉진할 수 있습니다.
TaaS 인프라 및 서비스 네트워크의 지리적 커버리지 제한이 사업자의 도입을 제약
TaaS 플랫폼의 운영상 실현 가능성은 정비 서비스 네트워크의 밀도와 신뢰성, 전기자동차용 충전 인프라, 그리고 사업자의 전체 노선 네트워크에 걸친 디지털 연결 범위에 크게 좌우됩니다. 상용차용 서비스 인프라가 미비한 지역이나 텔레매틱스 연결이 불안정한 지역에서는 TaaS 제공업체들이 기존 트럭 소유 방식에 비해 상대적으로 높은 구독 요금을 정당화할 수 있는 가동률 보장이나 실시간 운영 지원을 제공하는 데 어려움을 겪고 있습니다. 복잡하게 여러 지역에 걸쳐 있는 노선망을 운영하는 사업자의 경우, TaaS 제공업체의 서비스 범위가 필요한 모든 지역에 균일하게 미치지 못할 때 실무상의 어려움을 겪게 됩니다.
AI를 활용한 차량 함대 분석의 통합이 TaaS 플랫폼에 차별화된 가치 제안을 창출
TaaS 플랫폼에 인공지능(AI) 및 기계 학습 기능을 통합함으로써, 서비스 제공업체는 예측 유지보수 권장 사항, 동적 경로 최적화, 연비 효율 향상 지침을 제공할 수 있게 되었으며, 이를 통해 차량 운영 사업자에게 구독 요금을 상회하는 측정 가능한 비용 절감을 실현하고 있습니다. 대규모 커넥티드 트럭 데이터세트에서 도출된 AI 기반 운영 인사이트는 연료 소비, 운전자 행동, 유지보수 비용 관리 등 모든 분야에서 효율성을 높이고 있으며, 이는 개별 사업자가 독자적으로 재현하기 어려운 성과입니다. 이처럼 입증 가능한 ROI 향상은 TaaS의 가치 제안을 강화하여 중규모 물류 기업의 도입을 가속화하고 있습니다.
TaaS 플랫폼을 운영상의 혼란에 빠뜨릴 수 있는 데이터 보안 취약점 및 차량 연결성 위험
TaaS 플랫폼의 기반이 되는 광범위한 디지털 연결성은 중대한 사이버 보안 위험을 초래합니다. 이는 차량 관리 시스템, 차량 텔레매틱스 및 과금 인프라가 물류 네트워크를 마비시키거나 상업적으로 기밀성이 높은 운영 데이터를 빼내려는 악의적인 공격자들에게 매력적인 표적이 되고 있기 때문입니다. TaaS 제공업체의 커넥티드 차량 관리 인프라에 대한 사이버 공격이 성공할 경우, 여러 운영사 고객에게 동시에 영향을 미쳐 연쇄적인 운영 중단이나 막대한 배상 책임 위험을 초래할 가능성이 있습니다. 상용차의 데이터 개인정보 보호 및 국경을 넘는 데이터 전송을 규정하는 규제 요건은 전 세계에서 사업을 전개하는 TaaS 제공업체의 기술 아키텍처를 더욱 복잡하게 만들고 있습니다.
신종 코로나바이러스(COVID-19)의 영향:
팬데믹 초기에는 상업용 화물 운송량이 감소했고, 차량 운영사들이 새로운 서비스 모델을 모색하기보다는 유동성 유지에 주력했기 때문에 TaaS 시장의 발전이 지연되었습니다. 그러나 이 위기는 동시에, 이동 제한 상황에서 원격 차량 모니터링과 자동 정비 일정 수립이 필수적인 기능이 됨으로써, 커넥티드 차량 관리 플랫폼의 운영상 이점을 입증하는 계기가 되기도 했습니다. 팬데믹 이후 E-Commerce와 니어쇼어링 추세가 가속화되면서 대상 화물량이 급격히 증가했고, 이에 따라 상당한 자본 투자를 하지 않고도 신속하게 운송 능력을 확대하려는 물류 사업자들에게 TaaS 도입에 유리한 시장 환경이 조성되고 있습니다.
예측 기간 동안 '구독형 트럭 서비스' 부문이 가장 큰 규모를 차지할 것으로 예상됩니다.
구독형 트럭 서비스 부문은 예측 기간 동안 가장 큰 시장 점유율을 차지할 것으로 예상됩니다. 이는 기업 물류 사업자들이 수년에 걸친 재무 계획 및 예산의 확실성을 보장해 주는, 예측 가능한 월별 비용 구조를 선호하는 경향을 반영한 것입니다. 장기 구독 계약을 통해 TaaS 제공업체는 지속적인 수익 전망을 확보할 수 있으며, 이를 바탕으로 플랫폼 투자 및 차량 교체 프로그램을 뒷받침할 수 있습니다. 또한, 주요 구독 고객사들의 기업 지속가능성 노력이 전기 트럭 구독 패키지에 대한 수요를 견인하고 있습니다. 이를 통해 사업자는 복잡한 전기자동차 인프라에 대한 투자를 독자적으로 관리할 필요 없이, 차량의 탄소발자국을 스코프 3 배출량 감축 목표와 일치시킬 수 있게 됩니다.
자율주행 솔루션 분야는 예측 기간 동안 가장 높은 연평균 성장률(CAGR)을 보일 것으로 예상됩니다.
예측 기간 동안 '자율주행 솔루션' 부문은 장거리 노선에서 측정 가능한 연비 효율과 운전자 비용 절감을 실현하는 고속도로용 오토파일럿 및 플래토닝 기능에 대한 투자가 활발해짐에 따라 가장 높은 성장률을 보일 것으로 전망됩니다. 고도의 자율주행 지원 기능을 커넥티드 트럭 플랫폼에 통합하는 TaaS 제공업체들은 경쟁사와의 차별화를 꾀하며, 프리미엄 구독 요금 책정의 정당성을 확립해 나가고 있습니다. 지정된 화물 운송 노선에서 높은 수준의 자동화에 대한 규제 당국의 승인이 순차적으로 진행됨에 따라, 상용화 일정이 가속화되고 있습니다.
시장 점유율이 가장 높은 지역:
예측 기간 동안 북미는 가장 큰 시장 점유율을 유지할 것으로 예상됩니다. 이는 해당 지역의 물류 기술 도입에 대한 성숙한 문화, 커넥티드 트럭 도입에 적합한 광범위한 주간 화물 운송 노선, 그리고 상용차 기술 혁신을 뒷받침하는 유리한 규제 체계 덕분입니다. 확립된 기술 조달 프로세스를 갖춘 대규모 차량 운영 사업자들이 집중되어 있는 미국 시장은 TaaS 제공업체에게 매력적인 초기 고객 기반이 됩니다. 이를 통해 TaaS 제공업체는 상용 서비스 확대를 도모하고, 다양한 화물 부문에서 구독 모델의 경제성을 입증할 수 있게 됩니다.
CAGR이 가장 높은 지역:
예측 기간 동안 아시아태평양이 가장 높은 연평균 성장률(CAGR)을 보일 것으로 예상됩니다. 그 요인으로는 중국의 커넥티드카 생태계의 급속한 발전, 상용 차량의 전기화 및 텔레매틱스 도입을 촉진하는 정부의 규제, 그리고 인도에서 점차 확산되고 있는 물류 현대화의 흐름 등을 들 수 있습니다. 이 지역의 방대한 차량 규모와 증가하는 E-Commerce 화물량은 TaaS 제공업체에 막대한 구독 수익 기회를 가져다줍니다. 또한, 현지 기술 대기업들도 아시아의 물류 운영 환경에 맞춰 최적화된 AI 기반 차량 관리 플랫폼을 무기로 TaaS 시장에 진출하고 있습니다.
무료 맞춤 설정 서비스:
본 보고서를 구매하신 모든 고객께는 다음 무료 맞춤 설정 옵션 중 하나를 선택하여 이용하실 수 있습니다:
- 기업 프로파일링
- 추가 시장 참여자(최대 3개사)에 대한 종합적인 프로파일링
- 주요 기업의 SWOT 분석(최대 3개사)
- 지역별 세분화
- 고객의 요청에 따라 주요 국가의 시장 추정 및 예측, 그리고 CAGR(주: 실현 가능성 확인 후 결정됩니다)
- 경쟁사 벤치마킹
- 제품 포트폴리오, 사업 전개 지역, 전략적 제휴에 기반한 주요 기업의 벤치마킹
목차
제1장 주요 요약
제2장 조사 프레임워크
제3장 시장 역학과 동향 분석
제4장 경쟁 환경과 전략적 평가
제5장 세계의 TaaS(Truck-as-a-Service) 시장 : 서비스 유형별
제6장 세계의 TaaS(Truck-as-a-Service) 시장 : 트럭 유형별
제7장 세계의 TaaS(Truck-as-a-Service) 시장 : 추진 방식별
제8장 세계의 TaaS(Truck-as-a-Service) 시장 : 기술별
제9장 세계의 TaaS(Truck-as-a-Service) 시장 : 용도별
제10장 세계의 TaaS(Truck-as-a-Service) 시장 : 최종사용자별
제11장 세계의 TaaS(Truck-as-a-Service) 시장 : 지역별
제12장 전략적 시장 정보
제13장 업계 동향과 전략적 대처
제14장 기업 개요
KSM 26.07.15According to Stratistics MRC, the Global Truck-as-a-Service Market is accounted for $52.3 billion in 2026 and is expected to reach $142.8 billion by 2034, growing at a CAGR of 13.4% during the forecast period. Truck-as-a-Service represents an emerging commercial vehicle access model in which fleet operators obtain trucking capacity on subscription, pay-per-use, or managed service contractual arrangements rather than through outright vehicle ownership. This model integrates the physical vehicle with telematics, predictive maintenance, route optimization, and connected fleet management platforms into a comprehensive bundled offering.
Market Dynamics:
Driver:
Capital efficiency demands and fleet modernization pressures accelerating subscription-based truck adoption
Intensifying working capital constraints among logistics operators are driving structural interest in asset-light fleet access models that eliminate large upfront vehicle procurement expenditures and transfer operational risk to TaaS providers. The rapid technology evolution in commercial vehicles, encompassing electrification, advanced ADAS systems, and connected fleet platforms, makes outright truck ownership increasingly costly as assets risk premature obsolescence. TaaS arrangements enable operators to access current-generation electric and connected truck platforms with predictable periodic payments, facilitating fleet modernization without the balance sheet burden traditionally associated with commercial vehicle investment.
Restraint:
Limited geographic coverage of TaaS infrastructure and service network constraining operator adoption
The operational viability of TaaS platforms depends critically on the density and reliability of maintenance service networks, charging infrastructure for electric variants, and digital connectivity coverage across operator route networks. In regions with underdeveloped commercial vehicle service infrastructure or inconsistent telematics connectivity, TaaS providers struggle to deliver the uptime guarantees and real-time operational support that justify subscription premiums over conventional truck ownership. Operators running complex multi-regional route networks encounter practical difficulties when TaaS provider coverage fails to extend uniformly across all required geographies.
Opportunity:
Integration of AI-driven fleet analytics creating differentiated value propositions for TaaS platforms
The embedding of artificial intelligence and machine learning capabilities within TaaS platforms is enabling providers to deliver predictive maintenance recommendations, dynamic route optimization, and fuel efficiency coaching that generate measurable cost savings exceeding the subscription premium for fleet operators. AI-driven operational insights derived from large connected truck datasets are producing efficiency gains across fuel consumption, driver behavior, and maintenance cost management that standalone operators cannot replicate independently. These demonstrable ROI improvements are strengthening TaaS value propositions and accelerating operator adoption across mid-sized logistics enterprises.
Threat:
Data security vulnerabilities and fleet connectivity risks exposing TaaS platforms to operational disruptions
The extensive digital connectivity underlying TaaS platforms introduces significant cybersecurity exposure as fleet management systems, vehicle telematics, and billing infrastructure represent attractive targets for malicious actors seeking to disrupt logistics networks or extract commercially sensitive operational data. A successful cyberattack on a TaaS provider's connected fleet management infrastructure could simultaneously affect multiple operator clients, generating cascading operational disruptions and substantial liability exposure. Regulatory requirements governing commercial vehicle data privacy and cross-border data transfer further complicate the technical architecture of globally operating TaaS providers.
Covid-19 Impact:
The pandemic initially suppressed commercial freight volumes and delayed TaaS market development as fleet operators concentrated on preserving liquidity rather than exploring new service models. However, the crisis simultaneously demonstrated the operational advantages of connected fleet management platforms as remote vehicle monitoring and automated maintenance scheduling became critical capabilities during movement restrictions. The post-pandemic acceleration of e-commerce and nearshoring trends has since dramatically expanded addressable freight volumes, creating favorable market conditions for TaaS adoption among logistics operators seeking to rapidly scale capacity without corresponding capital commitments.
The Subscription-Based Truck Services segment is expected to be the largest during the forecast period
The Subscription-Based Truck Services segment is expected to account for the largest market share during the forecast period, reflecting enterprise logistics operators' preference for predictable monthly cost structures that facilitate multi-year financial planning and budget certainty. Long-term subscription contracts provide TaaS providers with recurring revenue visibility that supports platform investment and fleet renewal programs. Corporate sustainability commitments among major subscription clients are additionally driving demand for electric truck subscription packages that align fleet carbon profiles with Scope 3 emissions reduction targets without requiring operators to manage complex EV infrastructure investments independently.
The Autonomous Driving Solutions segment is expected to have the highest CAGR during the forecast period
Over the forecast period, the Autonomous Driving Solutions segment is predicted to witness the highest growth rate, propelled by intensifying investment in highway autopilot and platooning capabilities that deliver measurable fuel efficiency and driver cost savings on long-haul routes. TaaS providers integrating advanced autonomous driving assistance features into their connected truck platforms are gaining competitive differentiation and justifying premium subscription pricing. Progressive regulatory approvals for higher-level automation on designated freight corridors are accelerating commercial deployment timelines.
Region with largest share:
During the forecast period, the North America region is expected to hold the largest market share, benefiting from the region's mature logistics technology adoption culture, extensive interstate freight corridors amenable to connected truck deployments, and favorable regulatory frameworks supporting commercial vehicle technology innovation. The U.S. market's concentration of large-scale fleet operators with established technology procurement processes represents an attractive initial customer base for TaaS providers scaling their commercial offerings and proving out subscription model economics across diverse freight segment applications.
Region with highest CAGR:
Over the forecast period, the Asia Pacific region is anticipated to exhibit the highest CAGR, driven by China's rapidly advancing connected vehicle ecosystem, government mandates promoting commercial fleet electrification and telematics adoption, and India's emerging logistics modernization wave. The region's large fleet sizes and growing e-commerce freight volumes provide TaaS providers with substantial subscription revenue potential. Local technology giants are also entering the TaaS space with AI-driven fleet management platforms tailored to Asian logistics operating conditions.
Key players in the market
Some of the key players inTruck-as-a-Service Market include Daimler Truck AG, Volvo Group, TRATON SE, PACCAR Inc., Tata Motors Limited, IVECO Group N.V., Einride AB, BYD Company Limited, Nikola Corporation, Xos, Inc., Hyliion Holdings Corp., Ryder System, Inc., Trimble Inc., Omnitracs, LLC, and Geotab Inc.
Key Developments:
In March 2026, Einride AB announced the commercial expansion of its autonomous electric truck-as-a-service platform into three additional European markets, securing multi-year subscription agreements with regional distribution operators. The expansion demonstrates growing enterprise confidence in TaaS delivery models for sustainable freight operations.
In February 2026, Ryder System, Inc. launched an enhanced subscription fleet management platform integrating real-time AI-driven maintenance prediction and dynamic route optimization across its North American managed fleet network, strengthening its TaaS value proposition for mid-sized logistics operator clients.
Service Types Covered:
- Subscription-Based Truck Services
- Leasing Services
- Pay-Per-Use Services
- Rental Services
- Full-Service Fleet Management
- Managed Transportation Services
Truck Types Covered:
- Light-Duty Trucks
- Medium-Duty Trucks
- Heavy-Duty Trucks
Propulsion Types Covered:
- Diesel Trucks
- Natural Gas Trucks
- Battery Electric Trucks
- Hybrid Trucks
- Hydrogen Fuel Cell Trucks
Technologies Covered:
- Telematics & Fleet Monitoring
- Predictive Maintenance Solutions
- Connected Truck Platforms
- Autonomous Driving Solutions
- Route Optimization & Fleet Analytics
- Usage-Based Billing Systems
Applications Covered:
- Freight Transportation
- Last-Mile Delivery
- Construction & Infrastructure
- Mining & Heavy Industries
- Municipal Services
- Agriculture & Forestry
- Oil & Gas Logistics
End Users Covered:
- Logistics & Transportation Companies
- E-commerce Companies
- Retail & Consumer Goods Companies
- Manufacturing Companies
- Construction Companies
- Government & Municipal Authorities
- Mining Companies
Regions Covered:
- North America
- United States
- Canada
- Mexico
- Europe
- United Kingdom
- Germany
- France
- Italy
- Spain
- Netherlands
- Belgium
- Sweden
- Switzerland
- Poland
- Rest of Europe
- Asia Pacific
- China
- Japan
- India
- South Korea
- Australia
- Indonesia
- Thailand
- Malaysia
- Singapore
- Vietnam
- Rest of Asia Pacific
- South America
- Brazil
- Argentina
- Colombia
- Chile
- Peru
- Rest of South America
- Rest of the World (RoW)
- Middle East
- Saudi Arabia
- United Arab Emirates
- Qatar
- Israel
- Rest of Middle East
- Africa
- South Africa
- Egypt
- Morocco
- Rest of Africa
What our report offers:
- Market share assessments for the regional and country-level segments
- Strategic recommendations for the new entrants
- Covers Market data for the years 2023, 2024, 2025, 2026, 2027, 2028, 2030, 2032 and 2034
- Market Trends (Drivers, Constraints, Opportunities, Threats, Challenges, Investment Opportunities, and recommendations)
- Strategic recommendations in key business segments based on the market estimations
- Competitive landscaping mapping the key common trends
- Company profiling with detailed strategies, financials, and recent developments
- Supply chain trends mapping the latest technological advancements
Free Customization Offerings:
All the customers of this report will be entitled to receive one of the following free customization options:
- Company Profiling
- Comprehensive profiling of additional market players (up to 3)
- SWOT Analysis of key players (up to 3)
- Regional Segmentation
- Market estimations, Forecasts and CAGR of any prominent country as per the client's interest (Note: Depends on feasibility check)
- Competitive Benchmarking
- Benchmarking of key players based on product portfolio, geographical presence, and strategic alliances
Table of Contents
1 Executive Summary
- 1.1 Market Snapshot and Key Highlights
- 1.2 Growth Drivers, Challenges, and Opportunities
- 1.3 Competitive Landscape Overview
- 1.4 Strategic Insights and Recommendations
2 Research Framework
- 2.1 Study Objectives and Scope
- 2.2 Stakeholder Analysis
- 2.3 Research Assumptions and Limitations
- 2.4 Research Methodology
- 2.4.1 Data Collection (Primary and Secondary)
- 2.4.2 Data Modeling and Estimation Techniques
- 2.4.3 Data Validation and Triangulation
- 2.4.4 Analytical and Forecasting Approach
3 Market Dynamics and Trend Analysis
- 3.1 Market Definition and Structure
- 3.2 Key Market Drivers
- 3.3 Market Restraints and Challenges
- 3.4 Growth Opportunities and Investment Hotspots
- 3.5 Industry Threats and Risk Assessment
- 3.6 Technology and Innovation Landscape
- 3.7 Emerging and High-Growth Markets
- 3.8 Regulatory and Policy Environment
- 3.9 Impact of COVID-19 and Recovery Outlook
4 Competitive and Strategic Assessment
- 4.1 Porter's Five Forces Analysis
- 4.1.1 Supplier Bargaining Power
- 4.1.2 Buyer Bargaining Power
- 4.1.3 Threat of Substitutes
- 4.1.4 Threat of New Entrants
- 4.1.5 Competitive Rivalry
- 4.2 Market Share Analysis of Key Players
- 4.3 Product Benchmarking and Performance Comparison
5 Global Truck-as-a-Service Market, By Service Type
- 5.1 Subscription-Based Truck Services
- 5.2 Leasing Services
- 5.3 Pay-Per-Use Services
- 5.4 Rental Services
- 5.5 Full-Service Fleet Management
- 5.6 Managed Transportation Services
6 Global Truck-as-a-Service Market, By Truck Type
- 6.1 Light-Duty Trucks
- 6.2 Medium-Duty Trucks
- 6.3 Heavy-Duty Trucks
7 Global Truck-as-a-Service Market, By Propulsion Type
- 7.1 Diesel Trucks
- 7.2 Natural Gas Trucks
- 7.3 Battery Electric Trucks
- 7.4 Hybrid Trucks
- 7.5 Hydrogen Fuel Cell Trucks
8 Global Truck-as-a-Service Market, By Technology
- 8.1 Telematics & Fleet Monitoring
- 8.2 Predictive Maintenance Solutions
- 8.3 Connected Truck Platforms
- 8.4 Autonomous Driving Solutions
- 8.5 Route Optimization & Fleet Analytics
- 8.6 Usage-Based Billing Systems
9 Global Truck-as-a-Service Market, By Application
- 9.1 Freight Transportation
- 9.2 Last-Mile Delivery
- 9.3 Construction & Infrastructure
- 9.4 Mining & Heavy Industries
- 9.5 Municipal Services
- 9.6 Agriculture & Forestry
- 9.7 Oil & Gas Logistics
10 Global Truck-as-a-Service Market, By End User
- 10.1 Logistics & Transportation Companies
- 10.2 E-commerce Companies
- 10.3 Retail & Consumer Goods Companies
- 10.4 Manufacturing Companies
- 10.5 Construction Companies
- 10.6 Government & Municipal Authorities
- 10.7 Mining Companies
11 Global Truck-as-a-Service Market, By Geography
- 11.1 North America
- 11.1.1 United States
- 11.1.2 Canada
- 11.1.3 Mexico
- 11.2 Europe
- 11.2.1 United Kingdom
- 11.2.2 Germany
- 11.2.3 France
- 11.2.4 Italy
- 11.2.5 Spain
- 11.2.6 Netherlands
- 11.2.7 Belgium
- 11.2.8 Sweden
- 11.2.9 Switzerland
- 11.2.10 Poland
- 11.2.11 Rest of Europe
- 11.3 Asia Pacific
- 11.3.1 China
- 11.3.2 Japan
- 11.3.3 India
- 11.3.4 South Korea
- 11.3.5 Australia
- 11.3.6 Indonesia
- 11.3.7 Thailand
- 11.3.8 Malaysia
- 11.3.9 Singapore
- 11.3.10 Vietnam
- 11.3.11 Rest of Asia Pacific
- 11.4 South America
- 11.4.1 Brazil
- 11.4.2 Argentina
- 11.4.3 Colombia
- 11.4.4 Chile
- 11.4.5 Peru
- 11.4.6 Rest of South America
- 11.5 Rest of the World (RoW)
- 11.5.1 Middle East
- 11.5.1.1 Saudi Arabia
- 11.5.1.2 United Arab Emirates
- 11.5.1.3 Qatar
- 11.5.1.4 Israel
- 11.5.1.5 Rest of Middle East
- 11.5.2 Africa
- 11.5.2.1 South Africa
- 11.5.2.2 Egypt
- 11.5.2.3 Morocco
- 11.5.2.4 Rest of Africa
- 11.5.1 Middle East
12 Strategic Market Intelligence
- 12.1 Industry Value Network and Supply Chain Assessment
- 12.2 White-Space and Opportunity Mapping
- 12.3 Product Evolution and Market Life Cycle Analysis
- 12.4 Channel, Distributor, and Go-to-Market Assessment
13 Industry Developments and Strategic Initiatives
- 13.1 Mergers and Acquisitions
- 13.2 Partnerships, Alliances, and Joint Ventures
- 13.3 New Product Launches and Certifications
- 13.4 Capacity Expansion and Investments
- 13.5 Other Strategic Initiatives
14 Company Profiles
- 14.1 Daimler Truck AG
- 14.2 Volvo Group
- 14.3 TRATON SE
- 14.4 PACCAR Inc.
- 14.5 Tata Motors Limited
- 14.6 IVECO Group N.V.
- 14.7 Einride AB
- 14.8 BYD Company Limited
- 14.9 Nikola Corporation
- 14.10 Xos, Inc.
- 14.11 Hyliion Holdings Corp.
- 14.12 Ryder System, Inc.
- 14.13 Trimble Inc.
- 14.14 Omnitracs, LLC
- 14.15 Geotab Inc.