|
시장보고서
상품코드
1705657
자산 성과 관리 시장 : 솔루션별, 최종사용자별, 구성요소별, 기술별, 지역별Asset Performance Management Market, By Solution, By End User, By Component, By Technology, By Geography |
||||||
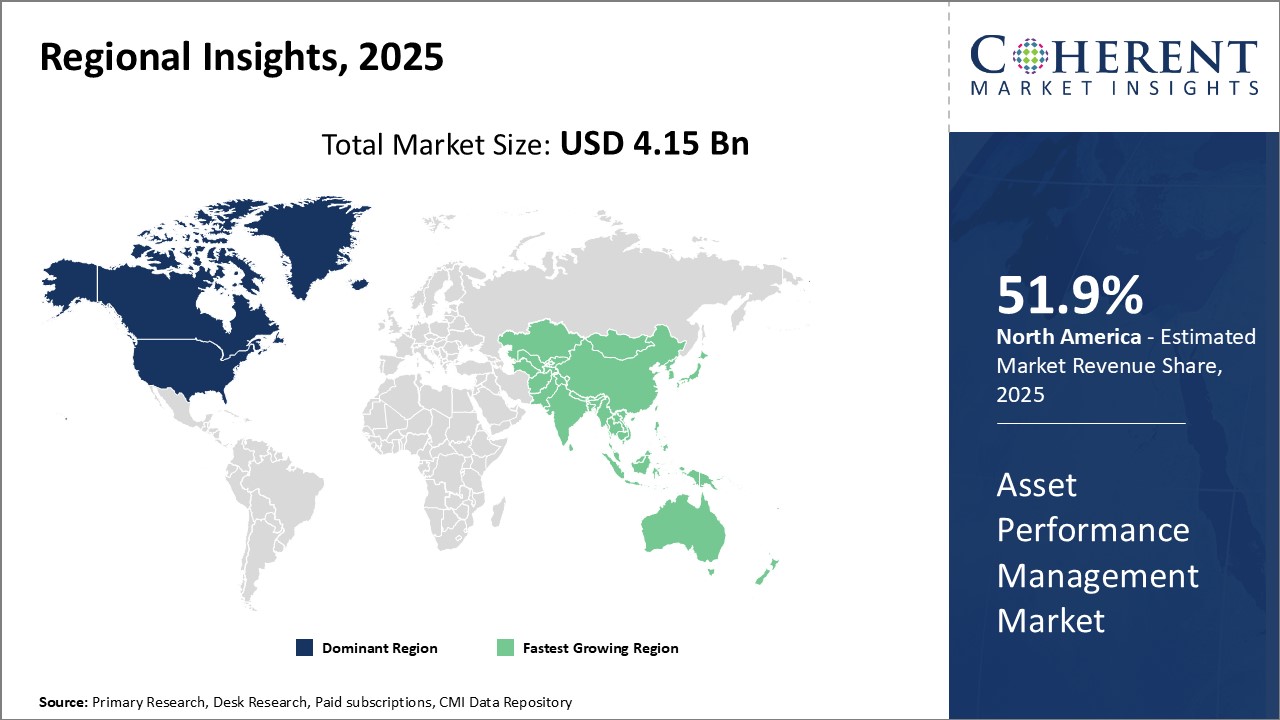
세계 자산 성과 관리 시장은 2025년 41억 5,000만 달러로 추정되며, 2032년에는 122억 6,000만 달러에 달할 것으로 예상되며, 2025년부터 2032년까지 연평균 16.7%의 성장률을 기록할 것으로 예상됩니다.
| 보고서 범위 | 보고서 상세 | ||
|---|---|---|---|
| 기준 연도 | 2024년 | 2025년 시장 규모 | 41억 5,000만 달러 |
| 실적 데이터 | 2020-2024년 | 예측 기간 | 2025-2032년 |
| 예측 기간 : 2025-2032년 CAGR | 16.70 | 2032년 가치 예측 | 122억 6,000만 달러 |
자산 성과 관리란 플랜트, 인프라, 장비 등 물리적 자산의 운영 및 유지보수 활동을 최적화하는 것을 말합니다. 여기에는 자산에서 중요한 데이터를 수집하고, 성능을 분석하고, 유지보수 비용을 최소화하면서 가동 시간과 수익 창출을 극대화하기 위해 자산을 유지하는 것이 포함됩니다. 자산 성능 관리 솔루션은 조직이 자산의 건전성과 운영 상태를 실시간으로 파악하고, 예후 모델링을 통해 고장을 예측하고, 유지보수 작업의 우선순위를 정할 수 있도록 돕습니다.
시장 성장의 원동력은 다운타임과 운영비용을 줄이기 위해 업계 전반에 걸쳐 최적화된 유지보수 전략이 요구되고 있다는 점입니다. 디지털화의 진전과 IoT 및 애널리틱스의 도입으로 실시간 자산 모니터링이 쉬워지고 있습니다. 또한, 머신러닝과 AI를 활용한 예지보전에 대한 산업계의 투자 확대도 시장 성장을 뒷받침하고 있습니다. 그러나 데이터 보안에 대한 우려와 숙련된 인력 부족으로 인해 자산 성능 관리 솔루션의 채택을 저해하고 있습니다. 증강현실, 클라우드 컴퓨팅, 엣지 컴퓨팅과 같은 신기술은 첨단 실시간 자산 성능 모니터링 시스템 개발의 기회를 열어주고 있습니다.
본 조사의 주요 특징
세계의 자산 성과 관리(Asset Performance Management) 시장에 대해 조사 분석했으며, 2024년을 기준 연도로 하여 예측 기간(2025-2032년)의 시장 규모와 연평균 성장률(CAGR%)을 조사하여 정리하여 전해드립니다.
이 보고서는 다양한 부문의 잠재적 수익 창출 기회를 파악하고, 이 시장의 매력적인 투자 제안 매트릭스를 설명합니다.
또한 시장 촉진요인, 억제요인, 기회, 신제품 출시 및 승인, 시장 동향, 지역별 전망, 주요 기업의 경쟁 전략 등에 대한 중요한 인사이트를 제공합니다.
이 보고서는 기업 하이라이트, 제품 포트폴리오, 주요 하이라이트, 재무 성과, 전략 등의 매개 변수를 기반으로 세계 자산 성과 관리 시장의 주요 기업을 프로파일링합니다.
주요 기업으로는 Amazon Web Services(AWS) Inc., V7Labs, NEC Corporation, NVIDIA Corporation, Slyce Acquisition Inc. Toshiba Corporation, Huawei Cloud 등이 있습니다.
이 보고서의 인사이트를 통해 마케팅 담당자와 기업 경영진은 향후 제품 출시, 유형화, 시장 확대, 마케팅 전략에 대한 정보에 입각한 의사결정을 내릴 수 있습니다.
자산 성과 관리 세계 시장 보고서는 투자자, 공급업체, 제품 제조업체, 유통업체, 신규 진입자, 재무 분석가 등 다양한 이해관계자를 대상으로 합니다.
이해관계자들은 세계 자산 성과 관리 시장 분석에 사용되는 다양한 전략 매트릭스를 통해 의사결정을 쉽게 내릴 수 있습니다.
목차
제1장 조사 목적과 가정
- 조사 목적
- 가정
- 약어
제2장 시장 전망
- 보고서 설명
- 시장 정의와 범위
- 주요 요약
제3장 시장 역학, 규제, 동향 분석
- 시장 역학
- 영향 분석
- 주요 하이라이트
- 규제 시나리오
- 제품 발매/승인
- PEST 분석
- PORTER의 분석
- 인수합병 시나리오
제4장 세계의 자산 성과 관리 시장, 솔루션별, 2020-2032년
- 자산 신뢰성 관리
- 자산 전략 관리
- 예측 자산 관리
- 자산 수명주기 관리
제5장 세계의 자산 성과 관리 시장, 최종사용자별, 2020-2032년
- BFSI
- 미디어와 엔터테인먼트
- 소매업과 E-Commerce
- IT 및 통신
- 정부
- 헬스케어
- 운송·물류
- 기타
제6장 세계의 자산 성과 관리 시장, 구성요소별, 2020-2032년
- 소프트웨어
- 하드웨어
- 구현
- 서비스
- 컨설팅과 트레이닝
- 유지관리와 지원
- 시장 규모와 예측, 전년비 성장률
제7장 세계의 자산 성과 관리 시장, 기술별, 2020-2032년
- 보안과 감시
- 스캔과 이미징
- 증강현실
- 이미지 검색
- 기타
제8장 세계의 자산 성과 관리 시장, 지역별, 2020-2032년
- 북미
- 라틴아메리카
- 유럽
- 아시아태평양
- 중동
- 아프리카
제9장 경쟁 구도
- Amazon Web Services(AWS) Inc.
- V7Labs
- NEC Corporation
- NVIDIA Corporation
- Slyce Acquisition Inc.
- Clarifai, Inc.
- Google LLC
- Blippar Ltd.
- Toshiba Corporation
- Huawei Cloud
제10장 애널리스트의 추천사항
- Wheel Of Fortune
- 애널리스트의 견해
- Coherent Opportunity Map
제11장 참고문헌과 조사 방법
- 참고문헌
- 조사 방법
- 출판사 소개
Global Asset Performance Management Market is estimated to be valued at USD 4.15 Bn in 2025 and is expected to reach USD 12.26 Bn by 2032, growing at a compound annual growth rate (CAGR) of 16.7% from 2025 to 2032.
| Report Coverage | Report Details | ||
|---|---|---|---|
| Base Year: | 2024 | Market Size in 2025: | USD 4.15 Bn |
| Historical Data for: | 2020 To 2024 | Forecast Period: | 2025 To 2032 |
| Forecast Period 2025 to 2032 CAGR: | 16.70% | 2032 Value Projection: | USD 12.26 Bn |

Asset performance management refers to the optimization of operations and maintenance activities for physical assets such as plants, infrastructure, and equipment. It involves capturing critical data from assets, analyzing their performance and maintaining them to maximize uptime and revenue generation while minimizing maintenance costs. Asset performance management solutions help organizations gain real-time visibility into asset health and operational status, predict failures through prognostic modeling and prioritize maintenance tasks.
The market growth is driven by the need for optimized maintenance strategies across industries to reduce downtime and operational costs. Rising digitization and adoption of IoT and analytics have facilitated real-time asset monitoring. Growing investments by industries in predictive maintenance using machine learning and AI also support market growth. However, data security concerns and lack of skilled workforce hampers the adoption of asset performance management solutions. Emerging technologies such as augmented reality, cloud computing, and edge computing open up opportunities to develop advanced real-time asset performance monitoring systems.
Key Features of the Study:
This report provides in-depth analysis of the global asset performance management market, market size (US$ Billion) and compound annual growth rate (CAGR%) for the forecast period (2025-2032), considering 2024 as the base year
It elucidates potential revenue opportunities across different segments and explains attractive investment proposition matrices for this market
This study also provides key insights about market drivers, restraints, opportunities, new product launches or approval, market trends, regional outlook, and competitive strategies adopted by key players
It profiles key players in the global asset performance management market based on the following parameters - company highlights, products portfolio, key highlights, financial performance, and strategies
Key companies covered as a part of this study include Amazon Web Services (AWS) Inc., V7Labs, NEC Corporation, NVIDIA Corporation, Slyce Acquisition Inc., Clarifai, Inc., Google LLC, Blippar Ltd., Toshiba Corporation, and Huawei Cloud
Insights from this report would allow marketers and the management authorities of the companies to make informed decisions regarding their future product launches, type up-gradation, market expansion, and marketing tactics
The global asset performance management market report caters to various stakeholders in this industry including investors, suppliers, product manufacturers, distributors, new entrants, and financial analysts
Stakeholders would have ease in decision-making through various strategy matrices used in analyzing the global asset performance management market
Market Segmentation
- By Solution Insights (Revenue, USD Bn, 2020 - 2032)
- Asset Reliability Management
- Asset Strategy Management
- Predictive Asset Management
- Asset Lifecycle Management
- By End User Insights (Revenue, USD Bn, 2020 - 2032)
- BFSI
- Media and Entertainment
- Retail and E-commerce
- IT and Telecom
- Government
- Healthcare
- Transportation and Logistics
- Others
- By Component Insights (Revenue, USD Bn, 2020 - 2032)
- Software
- Hardware
- Implementation
- Services
- Consulting and Training
- Maintenance and Support
- By Technology Insights (Revenue, USD, 2020 - 2032)
- Security and Surveillance
- Scanning and Imaging
- Augmented Reality
- Image Search
- Others
- Regional Insights (Revenue, USD, 2020 - 2032)
- North America
- U.S.
- Canada
- Latin America
- Brazil
- Argentina
- Mexico
- Rest of Latin America
- Europe
- Germany
- U.K.
- Spain
- France
- Italy
- Russia
- Rest of Europe
- Asia Pacific
- China
- India
- Japan
- Australia
- South Korea
- ASEAN
- Rest of Asia Pacific
- Middle East
- GCC Countries
- Israel
- Rest of Middle East
- Africa
- South Africa
- North Africa
- Central Africa
- Key Player Insights
- Amazon Web Services (AWS) Inc.
- V7Labs
- NEC Corporation
- NVIDIA Corporation
- Slyce Acquisition Inc.
- Clarifai, Inc.
- Google LLC
- Blippar Ltd.
- Toshiba Corporation
- Huawei Cloud
Table of Contents
1. Research Objectives and Assumptions
- Research Objectives
- Assumptions
- Abbreviations
2. Market Purview
- Report Description
- Market Definition and Scope
- Executive Summary
- Asset Performance Management Market, By Solution
- Asset Performance Management Market, By End User
- Asset Performance Management Market, By Component
- Asset Performance Management Market, By Technology
- Asset Performance Management Market, By Region
3. Market Dynamics, Regulations, and Trends Analysis
- Market Dynamicsa
- Impact Analysis
- Key Highlights
- Regulatory Scenario
- Product Launches/Approvals
- PEST Analysis
- PORTER's Analysis
- Merger And Acquisition Scenario
4. Global Asset Performance Management Market, By Solution, 2020-2032, (USD Bn)
- Introduction
- Market Share Analysis, 2025 and 2032 (%)
- Y-o-Y Growth Analysis, 2021 - 2032
- Segment Trends
- Asset Reliability Management
- Introduction
- Market Size and Forecast, and Y-O-Y Growth, 2020-2032, (USD Bn)
- Asset Strategy Management
- Introduction
- Market Size and Forecast, and Y-O-Y Growth, 2020-2032, (USD Bn)
- Predictive Asset Management
- Introduction
- Market Size and Forecast, and Y-O-Y Growth, 2020-2032, (USD Bn)
- Asset Lifecycle Management
- Introduction
- Market Size and Forecast, and Y-O-Y Growth, 2020-2032, (USD Bn)
5. Global Asset Performance Management Market, By End User, 2020-2032, (USD Bn)
- Introduction
- Market Share Analysis, 2025 and 2032 (%)
- Y-o-Y Growth Analysis, 2021 - 2032
- Segment Trends
- BFSI
- Introduction
- Market Size and Forecast, and Y-O-Y Growth, 2020-2032, (USD Bn)
- Media and Entertainment
- Introduction
- Market Size and Forecast, and Y-O-Y Growth, 2020-2032, (USD Bn)
- Retail and E-commerce
- Introduction
- Market Size and Forecast, and Y-O-Y Growth, 2020-2032, (USD Bn)
- IT and Telecom
- Introduction
- Market Size and Forecast, and Y-O-Y Growth, 2020-2032, (USD Bn)
- Government
- Introduction
- Market Size and Forecast, and Y-O-Y Growth, 2020-2032, (USD Bn)
- Healthcare
- Introduction
- Market Size and Forecast, and Y-O-Y Growth, 2020-2032, (USD Bn)
- Transportation and Logistics
- Introduction
- Market Size and Forecast, and Y-O-Y Growth, 2020-2032, (USD Bn)
- Others
- Introduction
- Market Size and Forecast, and Y-O-Y Growth, 2020-2032, (USD Bn)
6. Global Asset Performance Management Market, By Component, 2020-2032, (USD Bn)
- Introduction
- Market Share Analysis, 2025 and 2032 (%)
- Y-o-Y Growth Analysis, 2021 - 2032
- Segment Trends
- Software
- Introduction
- Market Size and Forecast, and Y-O-Y Growth, 2020-2032, (USD Bn)
- Hardware
- Introduction
- Market Size and Forecast, and Y-O-Y Growth, 2020-2032, (USD Bn)
- Implementation
- Introduction
- Market Size and Forecast, and Y-O-Y Growth, 2020-2032, (USD Bn)
- Services
- Introduction
- Market Size and Forecast, and Y-O-Y Growth, 2020-2032, (USD Bn)
- Consulting and Training
- Introduction
- Market Size and Forecast, and Y-O-Y Growth, 2020-2032, (USD Bn)
- Maintenance and Support
- Introduction
- Market Size and Forecast, and Y-O-Y Growth, 2020-2032, (USD Bn)
7. Global Asset Performance Management Market, By Technology, 2020-2032, (USD Bn)
- Introduction
- Market Share Analysis, 2025 and 2032 (%)
- Y-o-Y Growth Analysis, 2021 - 2032
- Segment Trends
- Security and Surveillance
- Introduction
- Market Size and Forecast, and Y-O-Y Growth, 2020-2032, (USD Bn)
- Scanning and Imaging
- Introduction
- Market Size and Forecast, and Y-O-Y Growth, 2020-2032, (USD Bn)
- Augmented Reality
- Introduction
- Market Size and Forecast, and Y-O-Y Growth, 2020-2032, (USD Bn)
- Image Search
- Introduction
- Market Size and Forecast, and Y-O-Y Growth, 2020-2032, (USD Bn)
- Others
- Introduction
- Market Size and Forecast, and Y-O-Y Growth, 2020-2032, (USD Bn)
8. Global Asset Performance Management Market, By Region, 2020 - 2032, Value (USD Bn)
- Introduction
- Market Share (%) Analysis, 2025,2028 & 2032, Value (USD Bn)
- Market Y-o-Y Growth Analysis (%), 2021-2032, Value (USD Bn)
- Regional Trends
- North America
- Introduction
- Market Size and Forecast, By Solution, 2020 - 2032, Value (USD Bn)
- Market Size and Forecast, By End User, 2020 - 2032, Value (USD Bn)
- Market Size and Forecast, By Component, 2020 - 2032, Value (USD Bn)
- Market Size and Forecast, By Technology, 2020 - 2032, Value (USD Bn)
- Market Size and Forecast, By Country, 2020 - 2032, Value (USD Bn)
- U.S.
- Canada
- Latin America
- Introduction
- Market Size and Forecast, By Solution, 2020 - 2032, Value (USD Bn)
- Market Size and Forecast, By End User, 2020 - 2032, Value (USD Bn)
- Market Size and Forecast, By Component, 2020 - 2032, Value (USD Bn)
- Market Size and Forecast, By Technology, 2020 - 2032, Value (USD Bn)
- Market Size and Forecast, By Country, 2020 - 2032, Value (USD Bn)
- Brazil
- Argentina
- Mexico
- Rest Of Latin America
- Europe
- Introduction
- Market Size and Forecast, By Solution, 2020 - 2032, Value (USD Bn)
- Market Size and Forecast, By End User, 2020 - 2032, Value (USD Bn)
- Market Size and Forecast, By Component, 2020 - 2032, Value (USD Bn)
- Market Size and Forecast, By Technology, 2020 - 2032, Value (USD Bn)
- Market Size and Forecast, By Country, 2020 - 2032, Value (USD Bn)
- Germany
- U.K.
- Spain
- France
- Italy
- Russia
- Rest Of Europe
- Asia Pacific
- Introduction
- Market Size and Forecast, By Solution, 2020 - 2032, Value (USD Bn)
- Market Size and Forecast, By End User, 2020 - 2032, Value (USD Bn)
- Market Size and Forecast, By Component, 2020 - 2032, Value (USD Bn)
- Market Size and Forecast, By Technology, 2020 - 2032, Value (USD Bn)
- Market Size and Forecast, By Country, 2020 - 2032, Value (USD Bn)
- China
- India
- Japan
- Australia
- South Korea
- ASEAN
- Rest Of Asia Pacific
- Middle East
- Introduction
- Market Size and Forecast, By Solution, 2020 - 2032, Value (USD Bn)
- Market Size and Forecast, By End User, 2020 - 2032, Value (USD Bn)
- Market Size and Forecast, By Component, 2020 - 2032, Value (USD Bn)
- Market Size and Forecast, By Technology, 2020 - 2032, Value (USD Bn)
- Market Size and Forecast, By Country, 2020 - 2032, Value (USD Bn)
- GCC Countries
- Israel
- Rest Of Middle East
- Africa
- Introduction
- Market Size and Forecast, By Solution, 2020 - 2032, Value (USD Bn)
- Market Size and Forecast, By End User, 2020 - 2032, Value (USD Bn)
- Market Size and Forecast, By Component, 2020 - 2032, Value (USD Bn)
- Market Size and Forecast, By Technology, 2020 - 2032, Value (USD Bn)
- Market Size and Forecast, By Country/Region, 2020 - 2032, Value (USD Bn)
- South Africa
- North Africa
- Central Africa
9. Competitive Landscape
- Amazon Web Services (AWS) Inc.
- Company Highlights
- Product Portfolio
- Key Developments
- Financial Performance
- Strategies
- V7Labs
- NEC Corporation
- NVIDIA Corporation
- Slyce Acquisition Inc.
- Clarifai, Inc.
- Google LLC
- Blippar Ltd.
- Toshiba Corporation
- Huawei Cloud
10. Analyst Recommendations
- Wheel Of Fortune
- Analyst View
- Coherent Opportunity Map
11. References And Research Methodology
- References
- Research Methodology
- About Us