


|
시장보고서
상품코드
1716530
영양바 시장 : 기회, 성장 촉진요인, 산업 동향 분석 및 예측(2025-2034년)Nutritional Bars Market Opportunity, Growth Drivers, Industry Trend Analysis, and Forecast 2025 - 2034 |
||||||
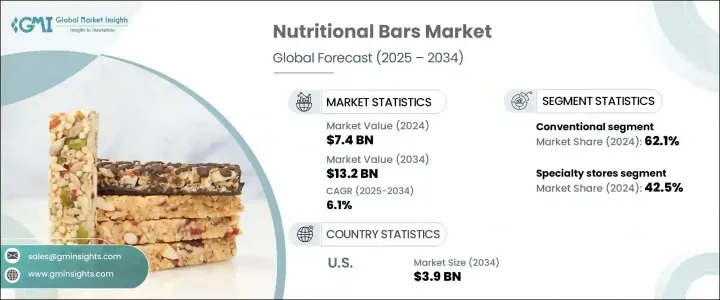
세계의 영양바 시장은 2024년에 74억 달러로 평가되었고, 더 건강한 이동 중 간식 옵션에 대한 수요 급증에 힘입어 2025년부터 2034년에 걸쳐 CAGR 6.1%로 성장할 것으로 예측됩니다.
피트니스, 웰니스, 균형 잡힌 라이프스타일에 대한 관심이 높아지면서 소비자들은 맛은 그대로 유지하면서 기능적인 이점을 제공하는 간편한 스낵을 적극적으로 찾고 있습니다. 전 세계적으로 건강에 대한 인식이 높아지면서 사람들은 기존의 고칼로리 스낵과 가공식품 대신 영양바를 이상적인 대안으로 선택하고 있습니다. 단백질이 풍부하고 저당, 글루텐 프리, 유기농 제품에 대한 선호도가 높아지면서 소비자의 기대치가 재정의되었고, 브랜드는 진화하는 식이 요법에 부합하는 혁신적인 제품을 제공하도록 장려하고 있습니다.
또한 현대 소비자들은 성분의 투명성, 지속 가능성, 윤리적 소싱에 세심한 주의를 기울이고 있으며, 이에 따라 브랜드는 알아볼 수 있는 천연 성분을 사용한 클린 라벨 포뮬러를 채택하고 있습니다. 또한, 전자상거래의 보급률 증가와 슈퍼마켓, 편의점, 피트니스 센터에서 쉽게 제품을 구할 수 있다는 점도 영양바의 판매를 촉진하고 있습니다. 도시 인구가 빠르게 변화하는 일상을 받아들이고 전체적인 건강을 우선시함에 따라, 영양바는 운동 전 에너지, 식사 대용 또는 바쁜 일정 중 간단한 간식 등 휴대 가능한 영양을 찾는 소비자들의 필수품으로 부상했습니다.
| 시장 범위 | |
|---|---|
| 시작 연도 | 2024년 |
| 예측 연도 | 2025-2034년 |
| 시작 금액 | 74억 달러 |
| 예측 금액 | 132억 달러 |
| CAGR | 6.1% |
시장은 시리얼 및 그래놀라 바, 단백질 바, 에너지 바 및 식사 대용 바, 과일 및 견과류 바 등 다양한 유형의 영양바로 세분화됩니다. 이 중 시리얼과 그래놀라 바는 지속적인 에너지를 제공하는 건강하고 섬유질이 풍부한 스낵으로 널리 사랑받고 있기 때문에 압도적인 시장 점유율을 차지하고 있습니다. 더 많은 소비자가 건강에 좋은 옵션을 선택함에 따라 저당, 고단백, 유기농 시리얼 및 그래놀라 바에 대한 수요가 증가하고 있습니다. 브랜드들은 건강을 증진하는 제형에 대한 관심이 높아짐에 따라 프로바이오틱스, 콜라겐, 강장제 등 기능성 성분이 강화된 제품을 출시하고 있습니다. 특히 단백질 바는 피트니스 애호가, 운동선수, 근육 회복이나 체중 관리 지원을 원하는 개인들의 수요가 증가하고 있습니다. 성분에 대한 소비자들의 관심이 높아지면서 인공 첨가물과 방부제가 없는 깨끗한 영양을 제공하는 바에 대한 선호도가 높아지고 있습니다.
또한 시장은 글루텐 프리와 일반 제품으로 분류됩니다. 현재 일반 바는 폭넓은 접근성과 경제성을 바탕으로 62.1%의 상당한 시장 점유율을 차지하고 있습니다. 그러나 셀리악병, 글루텐 불내증, 곡물 대체 식품의 이점에 대한 인식이 높아지면서 글루텐 프리 영양바가 빠르게 주목받고 있습니다. 제조업체들은 퀴노아, 아마란스, 메밀과 같이 영양이 풍부한 곡물로 바를 만들어 글루텐에 민감한 소비자와 건강에 관심이 많은 일반 소비자 모두에게 어필하고 있습니다. 하지만 맛, 식감, 가성비를 모두 갖춘 글루텐 프리 바를 개발하는 것은 여전히 어려운 과제이며, 브랜드들은 R&D에 투자하고 있습니다.
미국의 영양바 시장은 단백질이 풍부한 기능성 식품에 대한 소비자의 관심 증가에 힘입어 2024년 전 세계 점유율의 28%를 차지하며 21억 달러의 매출을 기록할 것으로 예상됩니다. 유기농, 비유전자변형식품, 클린 라벨 제품에 대한 수요 증가와 함께 잘 정립된 피트니스 문화는 미국 내 시장 확대를 강화합니다. 또한, 건강한 식생활을 장려하는 정부의 우호적인 노력과 소매 및 전자상거래 플랫폼의 성장은 견고한 판매를 뒷받침합니다. 그럼에도 불구하고 치열한 경쟁과 높은 생산 비용은 차별화와 수익성 유지를 목표로 하는 브랜드에게 여전히 중요한 과제로 남아 있습니다.
목차
제1장 조사 방법과 조사 범위
제2장 주요 요약
제3장 업계 인사이트
- 생태계 분석
- 밸류체인에 영향을 주는 요인
- 이익률 분석
- 혁신
- 장래의 전망
- 제조업체
- 유통업체
- 공급자의 상황
- 이익률 분석
- 주요 뉴스 및 대처
- 규제 상황
- 영향요인
- 성장 촉진요인
- 업계의 잠재적 위험 및 과제
- 잠재성장력 분석
- Porter's Five Forces 분석
- PESTEL 분석
제4장 경쟁 구도
- 소개
- 기업 점유율 분석
- 경쟁 포지셔닝 매트릭스
- 전략 전망 매트릭스
제5장 시장 추계 및 예측 : 제품별(2021-2034년)
- 주요 동향
- 시리얼 및 그래놀라 바
- 단백질 바
- 에너지 바 및 식사 대용 바
- 과일 및 견과류 바
- 기타
제6장 시장 추계 및 예측 : 카테고리별(2021-2034년)
- 주요 동향
- 글루텐 프리
- 기존
제7장 시장 추계 및 예측 : 유통 채널별(2021-2034년)
- 주요 동향
- 대형 슈퍼마켓 및 슈퍼마켓
- 전문점
- 온라인 소매
- 기타
제8장 시장 추계 및 예측 : 지역별(2021-2034년)
- 주요 동향
- 북미
- 미국
- 캐나다
- 유럽
- 독일
- 영국
- 프랑스
- 스페인
- 이탈리아
- 러시아
- 아시아태평양
- 중국
- 인도
- 일본
- 호주
- 한국
- 라틴아메리카
- 브라질
- 멕시코
- 중동 및 아프리카
- 사우디아라비아
- 남아프리카
- 아랍에미리트(UAE)
제9장 기업 프로파일
- General Mills Inc
- Ajinomoto Co Inc
- Cargill Incorporated
- Mondelez International
- Glanbia Plc
- HEALTHY BARS
- ADM
- Global Nutrition International
- The Simply Good Foods Company
- The Kellogg Company.
The Global Nutritional Bars Market reached USD 7.4 billion in 2024 and is projected to expand at a CAGR of 6.1% between 2025 and 2034, driven by the surging demand for healthier, on-the-go snacking options. With the rising focus on fitness, wellness, and balanced lifestyles, consumers are actively seeking convenient snacks that offer functional benefits without compromising on taste. As health awareness grows globally, people are turning to nutritional bars as an ideal alternative to traditional high-calorie snacks and processed foods. The increasing preference for protein-rich, low-sugar, gluten-free, and organic products has redefined consumer expectations, encouraging brands to deliver innovative products that align with evolving dietary needs.

Modern consumers are also paying close attention to ingredient transparency, sustainability, and ethical sourcing, prompting brands to adopt clean-label formulations with recognizable, natural ingredients. Moreover, the growing penetration of e-commerce, coupled with easy product availability in supermarkets, convenience stores, and fitness centers, continues to fuel sales of nutritional bars. As urban populations adopt fast-paced routines and prioritize holistic health, nutritional bars have emerged as a staple for consumers seeking portable nutrition, whether for pre-workout energy, meal replacement, or quick snacks during busy schedules.
| Market Scope | |
|---|---|
| Start Year | 2024 |
| Forecast Year | 2025-2034 |
| Start Value | $7.4 Billion |
| Forecast Value | $13.2 Billion |
| CAGR | 6.1% |
The market is segmented into various types of nutritional bars, including cereal/granola bars, protein bars, energy bars/meal replacement bars, fruit and nut bars, and others. Among these, cereal and granola bars dominate due to their widespread appeal as wholesome, fiber-rich snacks that provide sustained energy. As more consumers opt for better-for-you options, demand for low-sugar, high-protein, and organic variants of cereal and granola bars is gaining momentum. Brands are launching products enriched with functional ingredients like probiotics, collagen, and adaptogens to meet the rising interest in health-boosting formulations. Protein bars, in particular, are seeing heightened demand from fitness enthusiasts, athletes, and individuals seeking muscle recovery or weight management support. With consumers becoming increasingly ingredient-savvy, there is a strong preference for bars that offer clean nutrition, free from artificial additives and preservatives.
The market is also categorized into gluten-free and conventional segments. Conventional bars currently command a significant 62.1% market share, driven by broad accessibility and affordability. However, gluten-free nutritional bars are rapidly gaining traction as awareness about celiac disease, gluten intolerance, and the benefits of grain alternatives rises. Manufacturers are responding by formulating bars with nutrient-dense grains such as quinoa, amaranth, and buckwheat, which appeal to both gluten-sensitive and general health-conscious consumers. Yet, the development of gluten-free bars that balance taste, texture, and cost-effectiveness continues to be a challenge, pushing brands to invest in R&D.
U.S. Nutritional Bars Market accounted for 28% of the global share, generating USD 2.1 billion in 2024, propelled by growing consumer interest in protein-enriched and functional foods. A well-established fitness culture, coupled with heightened demand for organic, non-GMO, and clean-label products, reinforces market expansion in the U.S. Moreover, favorable government initiatives promoting healthy eating, combined with the growth of retail and e-commerce platforms, support robust sales. Nevertheless, fierce competition and high production costs remain critical challenges for brands aiming to differentiate and sustain profitability.
Table of Contents
Chapter 1 Methodology & Scope
- 1.1 Market scope & definition
- 1.2 Base estimates & calculations
- 1.3 Forecast calculation
- 1.4 Data sources
- 1.4.1 Primary
- 1.4.2 Secondary
- 1.4.2.1 Paid sources
- 1.4.2.2 Public sources
- 1.5 Primary research and validation
- 1.5.1 Primary sources
- 1.5.2 Data mining sources
Chapter 2 Executive Summary
- 2.1 Industry synopsis, 2021-2034
Chapter 3 Industry Insights
- 3.1 Industry ecosystem analysis
- 3.1.1 Factor affecting the value chain
- 3.1.2 Profit margin analysis
- 3.1.3 Disruptions
- 3.1.4 Future outlook
- 3.1.5 Manufacturers
- 3.1.6 Distributors
- 3.2 Supplier landscape
- 3.3 Profit margin analysis
- 3.4 Key news & initiatives
- 3.5 Regulatory landscape
- 3.6 Impact forces
- 3.6.1 Growth drivers
- 3.6.2 Industry pitfalls & challenges
- 3.7 Growth potential analysis
- 3.8 Porter's analysis
- 3.9 PESTEL analysis
Chapter 4 Competitive Landscape, 2024
- 4.1 Introduction
- 4.2 Company market share analysis
- 4.3 Competitive positioning matrix
- 4.4 Strategic outlook matrix
Chapter 5 Market Estimates and Forecast, By Product, 2021 – 2034 (USD Billion) (Kilo Tons)
- 5.1 Key trends
- 5.2 Cereal/Granola bars
- 5.3 Protein bars
- 5.4 Energy Bars/ Meal replacements bars
- 5.5 Fruits & nuts bars
- 5.6 Others (Diet Bars, Carbohydrate Bars, Endurance bars)
Chapter 6 Market Estimates and Forecast, By Category, 2021 – 2034 (USD Billion) (Kilo Tons)
- 6.1 Key trends
- 6.2 Gluten-free
- 6.3 Conventional
Chapter 7 Market Estimates and Forecast, By Distribution Channel, 2021 – 2034 (USD Billion) (Kilo Tons)
- 7.1 Key trends
- 7.2 Hypermarkets/Supermarkets
- 7.3 Specialty stores
- 7.4 Online retail
- 7.5 Others
Chapter 8 Market Estimates and Forecast, By Region, 2021 – 2034 (USD Billion) (Kilo Tons)
- 8.1 Key trends
- 8.2 North America
- 8.2.1 U.S.
- 8.2.2 Canada
- 8.3 Europe
- 8.3.1 Germany
- 8.3.2 UK
- 8.3.3 France
- 8.3.4 Spain
- 8.3.5 Italy
- 8.3.6 Russia
- 8.4 Asia Pacific
- 8.4.1 China
- 8.4.2 India
- 8.4.3 Japan
- 8.4.4 Australia
- 8.4.5 South Korea
- 8.5 Latin America
- 8.5.1 Brazil
- 8.5.2 Mexico
- 8.6 Middle East and Africa
- 8.6.1 Saudi Arabia
- 8.6.2 South Africa
- 8.6.3 UAE
Chapter 9 Company Profiles
- 9.1 General Mills Inc
- 9.2 Ajinomoto Co Inc
- 9.3 Cargill Incorporated
- 9.4 Mondelez International
- 9.5 Glanbia Plc
- 9.6 HEALTHY BARS
- 9.7 ADM
- 9.8 Global Nutrition International
- 9.9 The Simply Good Foods Company
- 9.10 The Kellogg Company.


