|
시장보고서
상품코드
1822609
재생에너지 탄소배출권 시장 기회, 성장 촉진요인, 산업 동향 분석과 예측(2025-2034년)Renewable Energy Carbon Credit Market Opportunity, Growth Drivers, Industry Trend Analysis, and Forecast 2025 - 2034 |
||||||
Global Market Insights Inc.가 발행한 최신 리포트에 따르면 세계의 재생에너지 탄소배출권 시장은 2024년에 433억 달러로 추정되며, CAGR 16.2%로 2025년 480억 달러에서 2034년에는 1,862억 달러로 성장할 것으로 예측됩니다.

세계 정부와 기업이 적극적인 탄소배출 제로 목표를 설정함에 따라 재생에너지 발전 프로젝트에서 생성된 탄소배출권에 대한 수요가 급증하고 있습니다. 이러한 크레딧은 현재 배출량과 장기적인 탈탄소화 목표 사이의 격차를 줄이는 데 도움이 됩니다.
| 시장 범위 | |
|---|---|
| 시작연도 | 2024 |
| 예측연도 | 2025-2034 |
| 시장 규모 | 433억 달러 |
| 예측 금액 | 1,862억 달러 |
| CAGR | 16.2% |
컴플라이언스가 견인차 역할을
2024년에는 정부의 배출량 감축 목표와 규제 프레임워크에 따라 컴플라이언스 분야가 두드러진 점유율을 차지할 것입니다. 탄소배출권 거래제나 재생에너지 포트폴리오 기준과 같은 프로그램은 기업이 배출량의 일부를 상쇄해야 하므로 인증된 재생에너지 크레딧에 대한 안정적인 수요를 촉진하고 있습니다. 이 분야는 체계화된 감독과 표준화된 프로토콜의 혜택을 받아 시장 진출기업에게 예측 가능성을 제공합니다.
자원봉사 부문 채택 증가
기업, 기관 및 개인이 규제 의무를 넘어 지속가능성을 위해 적극적으로 노력함에 따라 자발적 부문은 2025-2034년까지 상당한 CAGR로 성장할 것으로 예측됩니다. 기업은 기후 변화에 대한 리더십을 보여주고, 사내 넷제로 목표를 달성하고, ESG 보고를 강화하기 위해 재생에너지 탄소배출권을 구매하고 있습니다. 이 분야는 유연성이 뛰어나 지역 밀착형 태양광발전소, 소규모 풍력 개발 등 구매자가 자신의 브랜드 가치에 부합하는 프로젝트를 선택하고 있습니다.
지역별 인사이트
유리한 지역으로 부상하는 유럽
유럽 재생에너지 탄소배출권 시장은 야심찬 기후정책, 성숙한 탄소거래제도, 재생에너지 기술 보급에 힘입어 2024년 큰 매출을 창출할 수 있을 것으로 예측됩니다. EU 배출권거래제(EUETS)로 대표되는 이 지역의 강력한 컴플라이언스 인프라는 탄소 가격 책정 및 투명성의 세계 표준이 되고 있습니다. 동시에 유럽 기업이 넷제로 약속을 추진하고 국경을 초월한 청정에너지 프로젝트에 자금을 지원하려는 자발적인 참여도 증가하고 있습니다.
재생에너지 탄소배출권 시장의 주요 기업은 WayCarbon, Carbon Credit Capital, LLC., TerraPass, Native Energy, Climate Impact Partners, Atmosfair, The Carbon Collective Company, Carbon Better, EcoAct, ClimeCo LLC., South Pole, ALLCOT, Sterling Planet Inc., PwC, Green Mountain Energy Company, 3D egrees, CarbonClear, Ecosecurities, The Carbon Trust, Carbon Direct입니다.
재생에너지 탄소배출권 분야에서 사업을 운영하는 기업은 그 입지를 강화하기 위해 신뢰성, 확장성, 디지털 혁신에 초점을 맞추었습니다. 대부분 재생에너지 개발업체와 직접 제휴하여 신규 프로젝트에서 장기적인 크레딧 공급을 확보함으로써 추가성과 미래 수입원을 확보하고 있습니다. 또한 위성 데이터와 AI를 포함한 첨단 모니터링 및 보고 기술에 투자하여 신용 영향력을 검증하고 구매자와의 신뢰를 확보하기 위해 노력하는 기업도 있습니다. 시장 선도 기업은 거래 플랫폼을 간소화하고 더 높은 투명성을 제공하기 위해 핀테크 기업과의 전략적 제휴에 나서고 있습니다. 또한 지역의 기후 변화 목표에 부합하는 크레딧을 제공하거나 ICVCM, VCMI 등 세계 표준에 부합하도록 함으로써 평판과 경쟁력을 높이고 국제적으로 사업을 확장하는 기업도 있습니다.
목차
제1장 조사 방법과 범위
제2장 개요
제3장 업계 인사이트
- 에코시스템 분석
- 규제 상황
- 업계에 대한 영향요인
- 촉진요인
- 업계의 잠재적 리스크 & 과제
- 성장 가능성 분석
- Porter의 산업 분석
- PESTEL 분석
- 새로운 기회와 동향
- 디지털화와 IoT의 통합
- 신흥 시장에 대한 침투
제4장 경쟁 구도
- 서론
- 기업의 시장 점유율 분석 : 지역별
- 북미
- 유럽
- 아시아태평양
- 중동 및 아프리카
- 라틴아메리카
- 전략적 구상
- 경쟁 벤치마킹
- 전략적 대시보드
- 혁신과 테크놀러지 상황
제5장 시장 규모·예측 : 유형별, 2021-2034
- 주요 동향
- 자발적
- 컴플라이언스
제6장 시장 규모·예측 : 지역별, 2021-2034
- 주요 동향
- 북미
- 유럽
- 아시아태평양
- 중동 및 아프리카
- 라틴아메리카
제7장 기업 개요
- 3Degrees
- Atmosfair
- ALLCOT
- Carbon Better
- Carbon Credit Capital, LLC.
- Carbon Direct
- ClimeCo LLC.
- Climate Impact Partners
- CarbonClear
- Ecosecurities
- EcoAct
- Green Mountain Energy Company
- Native Energy
- PwC
- Sterling Planet Inc.
- South Pole
- The Carbon Trust
- The Carbon Collective Company
- TerraPass
- WayCarbon
The global renewable energy carbon credit market was estimated at USD 43.3 billion in 2024 and is expected to grow from USD 48 billion in 2025 to USD 186.2 billion by 2034, at a CAGR of 16.2%, according to the latest report published by Global Market Insights Inc.
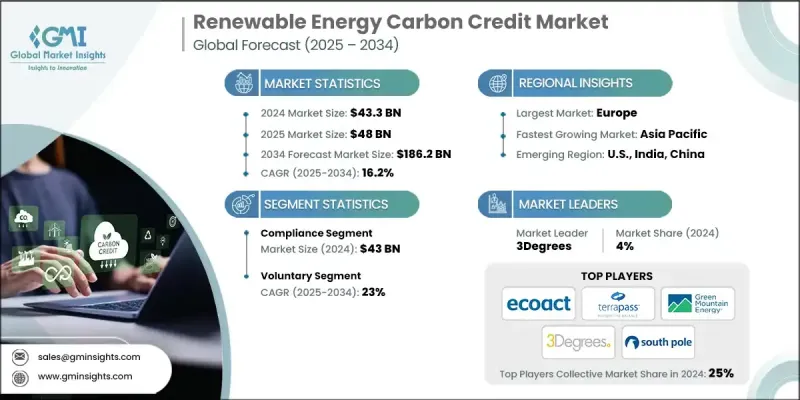
Governments and corporations worldwide are setting aggressive net-zero targets, creating a surge in demand for carbon credits generated through renewable energy projects. These credits help bridge the gap between current emissions and long-term decarbonization goals.
| Market Scope | |
|---|---|
| Start Year | 2024 |
| Forecast Year | 2025-2034 |
| Start Value | $43.3 Billion |
| Forecast Value | $186.2 Billion |
| CAGR | 16.2% |
Compliance to Gain Traction
The compliance segment held a notable share in 2024, driven by government-mandated emissions reduction targets and regulatory frameworks. Under programs like cap-and-trade and renewable portfolio standards, companies are required to offset a portion of their emissions, fueling steady demand for certified renewable energy credits. This segment benefits from structured oversight and standardized protocols, offering more predictability for market participants.
Rising Adoption Among the Voluntary Segment
The voluntary segment will grow at a decent CAGR during 2025-2034, as corporations, institutions, and individuals take proactive steps toward sustainability beyond regulatory mandates. Businesses are purchasing renewable energy carbon credits to demonstrate climate leadership, meet internal net-zero targets, and enhance ESG reporting. The segment thrives on flexibility, with buyers selecting projects that align with their brand values, such as community-based solar farms or small-scale wind developments.
Regional Insights
Europe to Emerge as a Lucrative Region
Europe renewable energy carbon credit market generated significant revenues in 2024, supported by ambitious climate policies, mature carbon trading systems, and widespread adoption of renewable technologies. The region's strong compliance infrastructure-led by the EU Emissions Trading System (EU ETS)-has set the global standard for carbon pricing and transparency. Simultaneously, voluntary participation is growing, as European corporations push toward net-zero commitments and seek to finance clean energy projects across borders.
Major players in the renewable energy carbon credit market are WayCarbon, Carbon Credit Capital, LLC., TerraPass, Native Energy, Climate Impact Partners, Atmosfair, The Carbon Collective Company, Carbon Better, EcoAct, ClimeCo LLC., South Pole, ALLCOT, Sterling Planet Inc., PwC, Green Mountain Energy Company, 3Degrees, CarbonClear, Ecosecurities, The Carbon Trust, Carbon Direct.
To strengthen their position, companies operating in the renewable energy carbon credit space are focusing on credibility, scalability, and digital innovation. Many are partnering directly with renewable energy developers to secure long-term credit supply from new projects, ensuring both additionality and future revenue streams. Others are investing in advanced monitoring and reporting technologies, including satellite data and AI, to validate credit impact and gain trust with buyers. Market leaders are also entering strategic alliances with fintech firms to streamline trading platforms and offer greater transparency. Additionally, some are expanding internationally by tailoring credit offerings to local climate goals and aligning with global standards such as ICVCM and VCMI to boost their reputation and competitiveness.
Table of Contents
Chapter 1 Methodology & Scope
- 1.1 Research design
- 1.2 Base estimates & calculations
- 1.3 Forecast calculation
- 1.4 Data sources
- 1.4.1 Primary
- 1.4.2 Secondary
- 1.4.2.1 Paid
- 1.4.2.2 Public
- 1.5 Market definitions
Chapter 2 Executive Summary
- 2.1 Industry synopsis, 2021 - 2034
Chapter 3 Industry Insights
- 3.1 Industry ecosystem analysis
- 3.2 Regulatory landscape
- 3.3 Industry impact forces
- 3.3.1 Growth drivers
- 3.3.2 Industry pitfalls & challenges
- 3.4 Growth potential analysis
- 3.5 Porter's analysis
- 3.5.1 Bargaining power of suppliers
- 3.5.2 Bargaining power of buyers
- 3.5.3 Threat of new entrants
- 3.5.4 Threat of substitutes
- 3.6 PESTEL analysis
- 3.6.1 Political factors
- 3.6.2 Economic factors
- 3.6.3 Social factors
- 3.6.4 Technology factors
- 3.6.5 environmental factors
- 3.6.6 Legal factors
- 3.7 Emerging opportunities & trends
- 3.7.1 Digitalization and IoT integration
- 3.7.2 Emerging market penetration
Chapter 4 Competitive landscape, 2025
- 4.1 Introduction
- 4.2 Company market share analysis, by region, 2024
- 4.2.1 North America
- 4.2.2 Europe
- 4.2.3 Asia Pacific
- 4.2.4 Middle East & Africa
- 4.2.5 Latin America
- 4.3 Strategic initiative
- 4.4 Competitive benchmarking
- 4.5 Strategic dashboard
- 4.6 Innovation & technology landscape
Chapter 5 Market Size and Forecast, By Type, 2021 - 2034 (USD Billion)
- 5.1 Key trends
- 5.2 Voluntary
- 5.3 Compliance
Chapter 6 Market Size and Forecast, By Region, 2021 - 2034 (USD Billion)
- 6.1 Key trends
- 6.2 North America
- 6.3 Europe
- 6.4 Asia Pacific
- 6.5 Middle East & Africa
- 6.6 Latin America
Chapter 7 Company Profiles
- 7.1 3Degrees
- 7.2 Atmosfair
- 7.3 ALLCOT
- 7.4 Carbon Better
- 7.5 Carbon Credit Capital, LLC.
- 7.6 Carbon Direct
- 7.7 ClimeCo LLC.
- 7.8 Climate Impact Partners
- 7.9 CarbonClear
- 7.10 Ecosecurities
- 7.11 EcoAct
- 7.12 Green Mountain Energy Company
- 7.13 Native Energy
- 7.14 PwC
- 7.15 Sterling Planet Inc.
- 7.16 South Pole
- 7.17 The Carbon Trust
- 7.18 The Carbon Collective Company
- 7.19 TerraPass
- 7.20 WayCarbon