|
시장보고서
상품코드
1665317
가상 발전소(VPP) 시장 : 시장 기회, 성장 촉진요인, 산업 동향 분석, 예측(2025-2034년)Virtual Power Plant Market Opportunity, Growth Drivers, Industry Trend Analysis, and Forecast 2025 - 2034 |
||||||
세계의 가상 발전소(VPP) 시장은 2024년에는 46억 달러로 평가되었고, 2025년부터 2034년까지 CAGR은 21.6%로 현저한 성장률을 이룰 것으로 예측되고 있습니다. VPP는 분산형 소규모 발전 장치를 중앙 시스템에서 관리하는 정교한 네트워크에 통합함으로써 에너지 부문에 혁명을 일으키고 있습니다. 분산 자원으로부터의 에너지를 집계함으로써 이러한 첨단 시스템은 생산, 소비 및 배전을 최적화하고 단일 기업으로 원활하게 작동합니다. 이 혁신적인 접근 방식은 송전망의 안정성을 높이고, 에너지 효율을 향상시키고, 자원 관리를 간소화하며, 보다 신뢰할 수 있고 지속 가능한 에너지 생태계에 기여합니다.

VPP 시장은 분산 에너지 자원, 수요 반응, 혼합 자산 시스템 등 주요 기술 부문으로 나뉩니다. 그 중에서도 수요 반응 부문은 2034년까지 130억 달러를 창출할 것으로 예측되고 있습니다. 이 성장의 원동력이 되는 것은 송전망의 신뢰성을 높이고 정전을 방지하고 보다 비용 효율적인 에너지 관리를 가능하게 하는 기능입니다. 수요 반응 시스템은 기존 인프라에 대한 부담을 줄이고 발전 능력을 추가할 필요성을 최소화하고 에너지 효율을 높이는 데 도움이 됩니다. 합리적인 가격으로 효율적인 에너지 솔루션에 대한 수요가 증가함에 따라, 수요 반응 시스템은 VPP에 필수적인 요소가 되어 보다 역동적이고 지속 가능한 에너지 그리드를 실현하고 있습니다.
| 시장 범위 | |
|---|---|
| 시작 연도 | 2024년 |
| 예측 연도 | 2025-2034년 |
| 시작 금액 | 46억 달러 |
| 예측 금액 | 322억 달러 |
| CAGR | 21.6% |
최종 사용자의 경우 VPP 시장은 주거용, 산업용, 상업용으로 분류됩니다. 산업용 부문은 2034년까지 연평균 복합 성장률(CAGR) 20.5%라는 경이적인 성장을 이룰 것으로 예측되고 있습니다. 산업 사업에서 에너지 수요가 증가함에 따라 에너지 부하 변화, 피크 수요 감소, 실시간 에너지 관리를 통해 비용을 절감할 수 있는 솔루션에 대한 필요성이 높아지고 있습니다. 게다가 지속가능성 목표와 이산화탄소 배출 감축에 대한 관심 증가는 산업에서 VPP의 채택을 가속화하고 있습니다. 산업 부문에서는 지속적인 운영을 지원하기 위해 신뢰성이 높고 에너지 효율적인 시스템을 선호하는 경향이 커지고 있으며 VPP는 에너지 전략의 중요한 부분이 되었습니다.
미국의 가상 발전소 시장은 2034년까지 92억 달러를 창출할 것으로 예상됩니다. 인프라의 노후화, 이상 기상, 에너지 수요 증가에 의한 송전망의 안정성 유지라는 과제가 회복력을 확보하기 위한 VPP 도입에 박차를 가하고 있습니다. 신재생 에너지와 축전 기술에 대한 세액 공제나 보조금 등의 연방 시책은 VPP 도입에 유리한 환경을 조성하고 있습니다. 이러한 시책은 에너지 안보를 강화할 뿐만 아니라 주택 및 산업 양 부문에서 첨단 전력 관리 시스템의 보급을 촉진합니다.
목차
제1장 조사 방법 및 조사 범위
- 시장의 정의
- 기본 추정 및 계산
- 예측 계산
- 1차 조사 및 검증
- 1차 정보
- 데이터 마이닝 소스
- 시장 정의
제2장 주요 요약
제3장 산업 인사이트
- 산업 생태계
- 규제 상황
- 산업에 미치는 영향요인
- 성장 촉진요인
- 산업의 잠재적 리스크 및 과제
- 성장 가능성 분석
- Porter's Five Forces 분석
- 공급기업의 협상력
- 구매자의 협상력
- 신규 참가업체의 위협
- 대체품의 위협
- PESTEL 분석
제4장 경쟁 구도
- 서문
- 전략 대시보드
- 혁신 및 지속가능성의 전망
제5장 시장 규모 및 예측 : 기술별(2021-2034년)
- 주요 동향
- 분산형 에너지 자원
- 수요응답
- 혼합자산
제6장 시장 규모 및 예측 : 최종 용도별(2021-2034년)
- 주요 동향
- 주택용
- 산업용
- 상업용
제7장 시장 규모 및 예측 : 지역별(2021-2034년)
- 주요 동향
- 북미
- 미국
- 캐나다
- 유럽
- 독일
- 프랑스
- 영국
- 이탈리아
- 아시아태평양
- 중국
- 일본
- 한국
- 인도
- 기타
제8장 기업 프로파일
- AGL Energy
- Bosch Global
- Enel X
- Enbala Power Networks
- Hitachi
- Tesla
- Statkraft
- Shell
- Siemens
- Schneider Electric
The Global Virtual Power Plant Market is anticipated to reach USD 4.6 billion in 2024 and is projected to experience a remarkable growth rate of 21.6% CAGR from 2025 to 2034. VPPs are revolutionizing the energy sector by integrating decentralized, small-scale power generation units into a cohesive network managed by a central system. By aggregating energy from distributed resources, these advanced systems optimize production, consumption, and distribution, operating seamlessly as a single entity. This innovative approach boosts grid stability, enhances energy efficiency, and simplifies resource management, contributing to a more reliable and sustainable energy ecosystem.
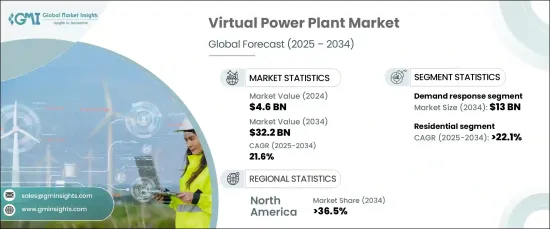
The VPP market is divided into key technological segments, including distributed energy resources, demand response, and mixed asset systems. Among these, the demand response segment is poised to generate USD 13 billion by 2034. This growth is driven by its capability to enhance grid reliability, prevent outages, and enable more cost-effective energy management. Demand response systems help reduce strain on existing infrastructure, minimizing the need for additional power generation capacity and promoting energy efficiency. As the demand for affordable and efficient energy solutions rises, demand response systems have become a vital component of VPPs, enabling a more dynamic and sustainable energy grid.
| Market Scope | |
|---|---|
| Start Year | 2024 |
| Forecast Year | 2025-2034 |
| Start Value | $4.6 Billion |
| Forecast Value | $32.2 Billion |
| CAGR | 21.6% |
When it comes to end users, the VPP market is categorized into residential, industrial, and commercial applications. The industrial segment is projected to grow at an impressive CAGR of 20.5% through 2034. Rising energy demands within industrial operations are driving the need for solutions that can lower costs by shifting energy loads, reducing peak demand, and providing real-time energy management. Additionally, the growing focus on sustainability goals and carbon emission reductions is accelerating the adoption of VPPs in industries. As industrial sectors increasingly prioritize reliable and energy-efficient systems to support continuous operations, VPPs have become an essential part of their energy strategies.
In the U.S., the virtual power plant market is forecast to generate USD 9.2 billion by 2034. The challenges of maintaining grid stability due to aging infrastructure, extreme weather events, and increasing energy demand are spurring the adoption of VPPs to ensure resilience. Federal policies, such as tax credits and grants for renewable energy and storage technologies, are creating a favorable environment for VPP deployment. These policies not only enhance energy security but also promote the widespread adoption of advanced power management systems in both residential and industrial sectors.
Table of Contents
Chapter 1 Methodology & Scope
- 1.1 Market definitions
- 1.2 Base estimates & calculations
- 1.3 Forecast calculation
- 1.4 Primary research & validation
- 1.4.1 Primary sources
- 1.4.2 Data mining sources
- 1.5 Market definitions
Chapter 2 Executive Summary
- 2.1 Industry synopsis, 2021 – 2034
Chapter 3 Industry Insights
- 3.1 Industry ecosystem
- 3.2 Regulatory landscape
- 3.3 Industry impact forces
- 3.3.1 Growth drivers
- 3.3.2 Industry pitfalls & challenges
- 3.4 Growth potential analysis
- 3.5 Porter's analysis
- 3.5.1 Bargaining power of suppliers
- 3.5.2 Bargaining power of buyers
- 3.5.3 Threat of new entrants
- 3.5.4 Threat of substitutes
- 3.6 PESTEL analysis
Chapter 4 Competitive landscape, 2024
- 4.1 Introduction
- 4.2 Strategic dashboard
- 4.3 Innovation & sustainability landscape
Chapter 5 Market Size and Forecast, By Technology, 2021 – 2034 (USD Billion)
- 5.1 Key trends
- 5.2 Distributed energy resource
- 5.3 Demand response
- 5.4 Mixed asset
Chapter 6 Market Size and Forecast, By End Use, 2021 – 2034 (USD Billion)
- 6.1 Key trends
- 6.2 Residential
- 6.3 Industrial
- 6.4 Commercial
Chapter 7 Market Size and Forecast, By Region, 2021 – 2034 (USD Billion)
- 7.1 Key trends
- 7.2 North America
- 7.2.1 U.S.
- 7.2.2 Canada
- 7.3 Europe
- 7.3.1 Germany
- 7.3.2 France
- 7.3.3 UK
- 7.3.4 Italy
- 7.4 Asia Pacific
- 7.4.1 China
- 7.4.2 Japan
- 7.4.3 South Korea
- 7.4.4 India
- 7.5 Rest of World
Chapter 8 Company Profiles
- 8.1 AGL Energy
- 8.2 Bosch Global
- 8.3 Enel X
- 8.4 Enbala Power Networks
- 8.5 Hitachi
- 8.6 Tesla
- 8.7 Statkraft
- 8.8 Shell
- 8.9 Siemens
- 8.10 Schneider Electric