|
시장보고서
상품코드
1666918
미드스트림 석유 및 가스 분석 시장 : 기회, 성장 촉진요인, 산업 동향 분석 및 예측(2025-2034년)Midstream Oil and Gas Analytics Market Opportunity, Growth Drivers, Industry Trend Analysis, and Forecast 2025 - 2034 |
||||||
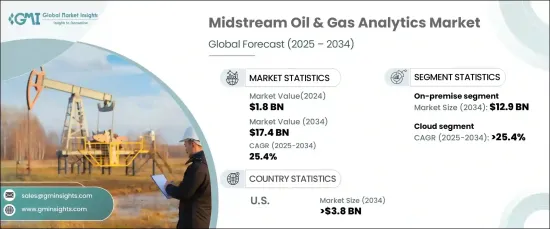
세계의 미드스트림 석유 및 가스 분석 시장은 2024년 18억 달러에 달했고, 2034년까지 연평균 복합 성장률(CAGR) 25.4%의 견조한 성장률로 확대될 전망입니다.
이 성장의 원동력은 미드스트림 부문의 업무 효율성 향상과 비용 관리에 대한 수요 증가입니다.
이 업계의 기업은 파이프라인 운영을 최적화하고, 자산 성능을 모니터링하고, 더 많은 정보를 기반으로 의사 결정을 지원하기 위해 고급 분석을 채택하고 있습니다. 예측 분석은 중요한 역할을 수행하고 운영자가 잠재적인 장비 고장을 감지하고 큰 문제로 발전하기 전에 문제를 해결할 수 있도록 지원합니다. 이 프로액티브 접근법은 다운타임과 유지 보수 비용을 절감하여 이 분야에서의 보급을 뒷받침합니다.
| 시장 범위 | |
|---|---|
| 시작 연도 | 2024년 |
| 예측 연도 | 2025-2034년 |
| 시작 금액 | 18억 달러 |
| 예측 금액 | 174억 달러 |
| CAGR | 25.4% |
인공지능(AI)과 머신러닝(ML)을 애널리틱스 툴에 통합하면 석유 및 가스 미드스트림 업계를 크게 재구성하고 있습니다. 이러한 기술은 대규모 데이터 세트를 처리하여 새로운 동향을 파악하고 수요를 예측하고 공급망을 최적화함으로써 보다 깊은 인사이트를 제공합니다. 또한 AI를 활용한 애널리틱스는 실시간 이상을 감지하여 안전 프로토콜을 강화하여 운영자가 잠재적인 위험에 신속하게 대응할 수 있도록 합니다.
이 시장은 온프레미스 및 클라우드 기반 솔루션을 포함한 배포 모델로 구분됩니다. 온프레미스 부문은 2034년까지 129억 달러 이상에 달할 것으로 예상되며, 데이터 보안을 우선시하고 민감한 정보 관리를 유지하려는 기업에 지지를 받고 있습니다. 온프레미스 솔루션은 기존 IT 인프라와의 원활한 통합을 제공하여 외부 네트워크에 의존하지 않고도 높은 성능과 실시간 분석을 보장합니다.
또한 시장은 전문, 클라우드, 통합 등의 서비스별로 분류됩니다. 클라우드 분야는 2034년까지 연평균 복합 성장률(CAGR)이 24.5% 이상의 성장을 예측할 수 있는 비용 효율성, 확장성 및 액세스 용이성을 제공합니다. 클라우드 솔루션은 실시간 데이터 분석 및 원격 모니터링을 가능하게 하고 운영자가 적시에 의사 결정을 내리는 데 도움이 됩니다. 또한 이러한 플랫폼은 사물 인터넷(IoT) 장치와의 원활한 통합을 제공하여 운영 가시성을 높이면서 IT 인프라 비용을 절감합니다. 클라우드 기반 분석에는 유연성이 있으므로 동적 워크로드 관리, 수요 예측, 파이프라인 효율 최적화에 이상적입니다.
미국의 미드스트림 석유 및 가스 분석 시장은 2034년까지 38억 달러 이상에 달할 것으로 예측됩니다. 이 성장의 원동력은 파이프라인 인프라에 대한 투자 증가와 최첨단 기술의 채택입니다. 분석 도구는 현재 운송 최적화, 자산 성능 모니터링, 규정 준수 보장에 필수적입니다. 또한 AI와 IoT 기술의 조합을 통해 실시간 모니터링과 예측 유지 보수가 가능해 운영 가동 중지 시간과 비용 절감에 기여하고 있습니다.
목차
제1장 조사 방법과 조사 범위
- 시장의 정의
- 기본 추정과 계산
- 예측 계산
- 데이터 소스
- 1차
- 2차
- 유상
- 공적
제2장 주요 요약
제3장 업계 인사이트
- 업계 생태계 분석
- 규제 상황
- 업계에 미치는 영향요인
- 성장 촉진요인
- 업계의 잠재적 리스크 및 과제
- 성장 가능성 분석
- Porter's Five Forces 분석
- 공급기업의 협상력
- 구매자의 협상력
- 신규 참가업체의 위협
- 대체품의 위협
- PESTEL 분석
제4장 경쟁 구도
- 전략 대시보드
- 혁신과 지속가능성의 전망
제5장 시장 규모와 예측 : 배포별(2021-2034년)
- 주요 동향
- 온프레미스
- 호스트
제6장 시장 규모와 예측 : 서비스별(2021-2034년)
- 주요 동향
- 전문가
- 클라우드
- 통합
제7장 시장 규모와 예측 : 용도별(2021-2034년)
- 주요 동향
- 파이프라인 SCADA
- 플릿
- 스토리지 최적화
제8장 시장 규모와 예측 : 지역별(2021-2034년)
- 주요 동향
- 북미
- 미국
- 캐나다
- 멕시코
- 유럽
- 영국
- 프랑스
- 독일
- 이탈리아
- 러시아
- 스페인
- 아시아태평양
- 중국
- 호주
- 인도
- 일본
- 한국
- 중동 및 아프리카
- 사우디아라비아
- 아랍에미리트(UAE)
- 터키
- 남아프리카
- 이집트
- 라틴아메리카
- 브라질
- 아르헨티나
제9장 기업 프로파일
- Accenture
- Capgemini
- Cisco Systems
- Cognizant
- Deloitte
- Hewlett Packard Enterprise
- Hitachi
- IBM
- Microsoft
- Oracle
- SAP
- SAS Institute
- Tableau Software
- Teradata
- TIBCO Software
The Global Midstream Oil And Gas Analytics Market reached USD 1.8 billion in 2024 and is poised to expand at a robust growth rate of 25.4% CAGR through 2034. This growth is driven by the increasing demand for enhanced operational efficiency and cost management within the midstream sector.

Companies in the industry are adopting advanced analytics to optimize their pipeline operations, monitor asset performance, and support more informed decision-making. Predictive analytics plays a critical role, helping operators detect potential equipment failures and address issues before they become major problems. This proactive approach leads to reduced downtime and maintenance costs, encouraging widespread use across the sector.
| Market Scope | |
|---|---|
| Start Year | 2024 |
| Forecast Year | 2025-2034 |
| Start Value | $1.8 Billion |
| Forecast Value | $17.4 Billion |
| CAGR | 25.4% |
The integration of artificial intelligence (AI) and machine learning (ML) into analytics tools is significantly reshaping the midstream oil and gas industry. These technologies enable deeper insights by processing large datasets to identify emerging trends, forecast demand, and optimize supply chains. AI-powered analytics also enhance safety protocols by detecting real-time anomalies, enabling operators to act swiftly in response to potential risks.
The market is divided by deployment models, including on-premise and cloud-based solutions. The on-premise segment is expected to surpass USD 12.9 billion by 2034, favored by companies that prioritize data security and wish to maintain control over sensitive information. On-premise solutions offer seamless integration with existing IT infrastructures, ensuring high performance and real-time analytics without depending on external networks.
In addition, the market is categorized by services such as professional, cloud, and integration. The cloud segment is projected to grow at a CAGR exceeding 24.5% through 2034, driven by its cost-effectiveness, scalability, and ease of access. Cloud solutions enable real-time data analysis and remote monitoring, which help operators make timely decisions. These platforms also reduce IT infrastructure costs while providing seamless integration with Internet of Things (IoT) devices, boosting operational visibility. The flexibility of cloud-based analytics makes it ideal for managing dynamic workloads, forecasting demand, and optimizing pipeline efficiency.
U.S. midstream oil and gas analytics market is anticipated to exceed USD 3.8 billion by 2034. This growth is fueled by the increasing investments in pipeline infrastructure and the adoption of cutting-edge technologies. Analytics tools are now essential for optimizing transportation, monitoring asset performance, and ensuring regulatory compliance. Additionally, the combination of AI and IoT technologies enables real-time monitoring and predictive maintenance, helping reduce operational downtime and costs.
Table of Contents
Chapter 1 Methodology & Scope
- 1.1 Market definitions
- 1.2 Base estimates & calculations
- 1.3 Forecast calculation
- 1.4 Data sources
- 1.4.1 Primary
- 1.4.2 Secondary
- 1.4.2.1 Paid
- 1.4.2.2 Public
Chapter 2 Executive Summary
- 2.1 Industry synopsis, 2021 – 2034
Chapter 3 Industry Insights
- 3.1 Industry ecosystem analysis
- 3.2 Regulatory landscape
- 3.3 Industry impact forces
- 3.3.1 Growth drivers
- 3.3.2 Industry pitfalls & challenges
- 3.4 Growth potential analysis
- 3.5 Porter's analysis
- 3.5.1 Bargaining power of suppliers
- 3.5.2 Bargaining power of buyers
- 3.5.3 Threat of new entrants
- 3.5.4 Threat of substitutes
- 3.6 PESTEL analysis
Chapter 4 Competitive landscape, 2024
- 4.1 Strategic dashboard
- 4.2 Innovation & sustainability landscape
Chapter 5 Market Size and Forecast, By Deployment, 2021 – 2034 (USD Million)
- 5.1 Key trends
- 5.2 On premise
- 5.3 Hosted
Chapter 6 Market Size and Forecast, By Service, 2021 – 2034 (USD Million)
- 6.1 Key trends
- 6.2 Professional
- 6.3 Cloud
- 6.4 Integration
Chapter 7 Market Size and Forecast, By Application, 2021 – 2034 (USD Million)
- 7.1 Key trends
- 7.2 Pipeline SCADA
- 7.3 Fleet
- 7.4 Storage optimization
Chapter 8 Market Size and Forecast, By Region, 2021 – 2034 (USD Million)
- 8.1 Key trends
- 8.2 North America
- 8.2.1 U.S.
- 8.2.2 Canada
- 8.2.3 Mexico
- 8.3 Europe
- 8.3.1 UK
- 8.3.2 France
- 8.3.3 Germany
- 8.3.4 Italy
- 8.3.5 Russia
- 8.3.6 Spain
- 8.4 Asia Pacific
- 8.4.1 China
- 8.4.2 Australia
- 8.4.3 India
- 8.4.4 Japan
- 8.4.5 South Korea
- 8.5 Middle East & Africa
- 8.5.1 Saudi Arabia
- 8.5.2 UAE
- 8.5.3 Turkey
- 8.5.4 South Africa
- 8.5.5 Egypt
- 8.6 Latin America
- 8.6.1 Brazil
- 8.6.2 Argentina
Chapter 9 Company Profiles
- 9.1 Accenture
- 9.2 Capgemini
- 9.3 Cisco Systems
- 9.4 Cognizant
- 9.5 Deloitte
- 9.6 Hewlett Packard Enterprise
- 9.7 Hitachi
- 9.8 IBM
- 9.9 Microsoft
- 9.10 Oracle
- 9.11 SAP
- 9.12 SAS Institute
- 9.13 Tableau Software
- 9.14 Teradata
- 9.15 TIBCO Software