
|
시장보고서
상품코드
1667167
석유 및 가스 분석 시장 : 기회, 성장 촉진요인, 산업 동향 분석 및 예측(2025-2034년)Oil and Gas Analytics Market Opportunity, Growth Drivers, Industry Trend Analysis, and Forecast 2025 - 2034 |
||||||
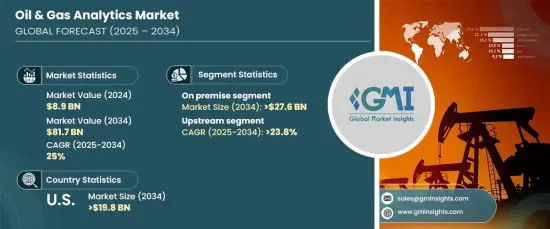
세계의 석유 및 가스 분석 시장은 2024년 89억 달러로 평가되었고, 2025-2034년 CAGR 25%의 견조한 성장이 예측되고 있습니다.
디지털 전환은 석유 및 가스 업계를 재정의하고 있으며, 기업은 업무 효율을 높이기 위해 분석을 활용하도록 되어 있습니다. 빅데이터, IoT, 클라우드 컴퓨팅 등 첨단 기술을 활용함으로써 기업은 탐사에서 판매까지의 프로세스를 최적화하고 있습니다. 데이터를 실시간으로 분석할 수 있게 됨으로써 기업은 효율성 향상, 운영 비용 절감, 위험 최소화로 이어지는 의사 결정을 충분한 정보를 바탕으로 할 수 있게 되었습니다. 비용이 많이 드는 이 업계에서 분석 솔루션은 워크플로우를 간소화하고, 비용 절감을 가능하게 하고, 더 나은 자원 관리를 보장하는 데 중요한 역할을 합니다.
예측 분석은 장비의 신뢰성을 향상시키고 생산 과제를 예측하며 시장 동향을 파악하기 위한 기초로 등장했습니다. 이 능동적인 접근 방식은 효과적인 유지보수 스케줄링을 용이하게 하고, 다운타임을 최소화하고, 비용이 많이 드는 혼란을 줄일 수 있습니다. 또한 건강, 안전 및 환경(HSE) 분석의 채용이 증가하고 있어 기업이 안전 우려에 대처하고 엄격한 환경 규제를 준수하는 데 도움이 되고 있습니다. 실시간 모니터링 및 위험 분석은 직장 안전을 강화하고 규정 준수 기준을 준수하기 위해 이 분야에서 분석 기술을 채택하는 것을 더욱 촉진하고 있습니다.
| 시장 범위 | |
|---|---|
| 시작연도 | 2024년 |
| 예측연도 | 2025-2034년 |
| 시작금액 | 89억 달러 |
| 예측 금액 | 817억 달러 |
| CAGR | 25% |
온프레미스 도입 분야는 2034년까지 276억 달러 이상에 달할 것으로 예상됩니다. 이는 기밀 데이터의 관리 유지를 목표로 하는 기업 간의 선호도 증가를 반영합니다. 온프레미스 솔루션은 데이터 보안을 강화하고 기업이 엄격한 규제 요구 사항을 충족하는 데 도움이 됩니다. 많은 기업들이 맞춤형 온프레미스 분석에 투자하고 업계 표준에 맞추어 개인정보 보호 문제를 해결합니다. 중요한 비즈니스 데이터와 재무 데이터를 자체 인프라에 유지함으로써 기업은 외부 시스템과 관련된 잠재적인 취약점을 피할 수 있습니다.
업스트림 부문은 실시간 데이터 분석의 중요성이 증가함에 따라 2034년까지 연평균 복합 성장률(CAGR) 23.8% 이상 증가할 것으로 예상됩니다. IoT가 장착된 센서는 중요한 작업에서 엄청난 양의 데이터를 수집하여 즉각적인 분석과 신속한 의사 결정을 가능하게 합니다. 이 접근법은 드릴링, 생산 및 유지 보수 활동의 효율성을 높이고 성능 최적화를 보장합니다. 많은 조직이 확장성과 유연성을 요구하고 클라우드 기반 분석을 채택하여 대규모 물리적 인프라의 필요성을 줄이는 동시에 정교한 도구와 통찰력에 대한 액세스를 제공합니다.
미국에서는 클라우드 컴퓨팅의 현저한 진보를 반영하여 석유 및 가스 분석 시장은 2034년까지 198억 달러 이상에 달할 것으로 예측됩니다. 클라우드 기반 플랫폼을 통해 기업은 현장 인프라에 많은 투자를 하지 않고도 엄청난 데이터 세트를 분석할 수 있습니다. 분석의 도입이 진행됨에 따라 기업은 민감한 데이터를 보호하고 업계 표준을 준수하기 위한 사이버 보안 대책을 우선시하고 진화하는 시장 상황에서 견고한 데이터 보호 및 규제 상황 준수를 보장합니다.
목차
제1장 조사 방법과 조사 범위
- 시장의 정의
- 기본 추정과 계산
- 예측 계산
- 데이터 소스
- 1차
- 2차
- 유상
- 공적
제2장 주요 요약
제3장 업계 인사이트
- 업계 생태계 분석
- 벤더 매트릭스
- 규제 상황
- 업계에 미치는 영향요인
- 성장 촉진요인
- 업계의 잠재적 리스크 및 과제
- 잠재성장력 분석
- Porter's Five Forces 분석
- 공급기업의 협상력
- 구매자의 협상력
- 신규 참가업체의 위협
- 대체품의 위협
- PESTEL 분석
제4장 경쟁 구도
- 전략 대시보드
- 혁신과 지속가능성의 전망
제5장 시장 규모와 예측 : 전개별, 2021-2034년
- 주요 동향
- 온프레미스
- 호스트형
제6장 시장 규모와 예측 : 용도별, 2021-2034년
- 주요 동향
- 업스트림
- 탐광 및 굴착
- 현장 감시 및 모니터링
- 생산계획 및 예측
- 설비 유지보수 관리
- 자산 성능
- 노동력 관리
- 중류
- 파이프라인 SCADA
- 플릿
- 저장 최적화
- 하류
- 상품 거래
- 수요 예측
- 가격 설정
- 정제
제7장 시장 규모와 예측 : 서비스별, 2021-2034년
- 주요 동향
- 전문
- 클라우드
- 통합
제8장 시장 규모와 예측 : 지역별, 2021-2034년
- 주요 동향
- 북미
- 미국
- 캐나다
- 멕시코
- 유럽
- 독일
- 이탈리아
- 러시아
- 영국
- 프랑스
- 아시아태평양
- 중국
- 호주
- 인도
- 일본
- 한국
- 중동 및 아프리카
- 사우디아라비아
- 아랍에미리트(UAE)
- 남아프리카
- 라틴아메리카
- 브라질
- 아르헨티나
제9장 기업 프로파일
- Accenture
- Capgemini
- Cisco
- Cognizant
- Deloitte
- Hewlett Packard Enterprise
- Hitachi
- IBM
- Microsoft
- Oracle
- SAP
- SAS Institute
- Tableau
- Teradata
- TIBCO
The Global Oil And Gas Analytics Market, valued at USD 8.9 billion in 2024, is projected to grow at a robust CAGR of 25% from 2025 to 2034. Digital transformation is redefining the oil and gas industry, with companies increasingly leveraging analytics to enhance operational efficiency. By harnessing advanced technologies such as big data, IoT, and cloud computing, organizations are optimizing processes from exploration to distribution. The ability to analyze data in real time allows companies to make informed decisions that improve efficiency, reduce operational costs, and minimize risks. In an industry where expenses are substantial, analytics solutions play a critical role in streamlining workflows, enabling cost reductions, and ensuring better resource management.
Predictive analytics has emerged as a cornerstone for improving equipment reliability, forecasting production challenges, and identifying market trends. This proactive approach facilitates effective maintenance scheduling, minimizes downtime, and mitigates costly disruptions. Additionally, the adoption of health, safety, and environment (HSE) analytics is on the rise, helping firms address safety concerns and comply with stringent environmental regulations. Real-time monitoring and risk analysis enhance workplace safety and ensure adherence to compliance standards, further driving the adoption of analytics technologies across the sector.
| Market Scope | |
|---|---|
| Start Year | 2024 |
| Forecast Year | 2025-2034 |
| Start Value | $8.9 Billion |
| Forecast Value | $81.7 Billion |
| CAGR | 25% |
The on-premise deployment segment is anticipated to exceed USD 27.6 billion by 2034, reflecting its growing preference among companies aiming to maintain control over sensitive data. On-premise solutions offer enhanced data security and help organizations meet strict regulatory requirements. Many firms are investing in customizable on-premise analytics to align with industry standards and address privacy concerns. By keeping critical operational and financial data within their own infrastructure, companies can avoid potential vulnerabilities associated with external systems.
The upstream segment is expected to witness a CAGR of more than 23.8% through 2034, driven by the rising importance of real-time data analytics. IoT-powered sensors collect vast amounts of data from critical operations, enabling instant analysis and quick decision-making. This approach enhances efficiency in drilling, production, and maintenance activities, ensuring optimized performance. Many organizations are embracing cloud-based analytics for scalability and flexibility, reducing the need for extensive physical infrastructure while providing access to sophisticated tools and insights.
In the United States, the oil and gas analytics market is projected to surpass USD 19.8 billion by 2034, reflecting significant advancements in cloud computing. Cloud-based platforms enable organizations to analyze extensive datasets without the need for substantial investments in on-site infrastructure. With the increasing adoption of analytics, companies are prioritizing cybersecurity measures to protect sensitive data and comply with industry standards, ensuring robust data protection and regulatory adherence in an evolving market landscape.
Table of Contents
Chapter 1 Methodology & Scope
- 1.1 Market definitions
- 1.2 Base estimates & calculations
- 1.3 Forecast calculation
- 1.4 Data sources
- 1.4.1 Primary
- 1.4.2 Secondary
- 1.4.2.1 Paid
- 1.4.2.2 Public
Chapter 2 Executive Summary
- 2.1 Industry synopsis, 2021 – 2034
Chapter 3 Industry Insights
- 3.1 Industry ecosystem analysis
- 3.1.1 Vendor matrix
- 3.2 Regulatory landscape
- 3.3 Industry impact forces
- 3.3.1 Growth drivers
- 3.3.2 Industry pitfalls & challenges
- 3.4 Growth potential analysis
- 3.5 Porter's analysis
- 3.5.1 Bargaining power of suppliers
- 3.5.2 Bargaining power of buyers
- 3.5.3 Threat of new entrants
- 3.5.4 Threat of substitutes
- 3.6 PESTEL analysis
Chapter 4 Competitive landscape, 2024
- 4.1 Strategic dashboard
- 4.2 Innovation & sustainability landscape
Chapter 5 Market Size and Forecast, By Deployment, 2021 – 2034 (USD Million)
- 5.1 Key trends
- 5.2 On premise
- 5.3 Hosted
Chapter 6 Market Size and Forecast, By Application, 2021 – 2034 (USD Million)
- 6.1 Key trends
- 6.2 Upstream
- 6.2.1 Exploration and drilling
- 6.2.2 Field surveillance and monitoring
- 6.2.3 Production planning and forecasting
- 6.2.4 Equipment maintenance management
- 6.2.5 Asset performance
- 6.2.6 Workforce management
- 6.3 Midstream
- 6.3.1 Pipeline SCADA
- 6.3.2 Fleet
- 6.3.3 Storage optimization
- 6.4 Downstream
- 6.4.1 Commodity trading
- 6.4.2 Demand forecasting
- 6.4.3 Pricing
- 6.4.4 Refining
Chapter 7 Market Size and Forecast, By Service, 2021 – 2034 (USD Million)
- 7.1 Key trends
- 7.2 Professional
- 7.3 Cloud
- 7.4 Integration
Chapter 8 Market Size and Forecast, By Region, 2021 – 2034 (USD Million)
- 8.1 Key trends
- 8.2 North America
- 8.2.1 U.S.
- 8.2.2 Canada
- 8.2.3 Mexico
- 8.3 Europe
- 8.3.1 Germany
- 8.3.2 Italy
- 8.3.3 Russia
- 8.3.4 UK
- 8.3.5 France
- 8.4 Asia Pacific
- 8.4.1 China
- 8.4.2 Australia
- 8.4.3 India
- 8.4.4 Japan
- 8.4.5 South Korea
- 8.5 Middle East & Africa
- 8.5.1 Saudi Arabia
- 8.5.2 UAE
- 8.5.3 South Africa
- 8.6 Latin America
- 8.6.1 Brazil
- 8.6.2 Argentina
Chapter 9 Company Profiles
- 9.1 Accenture
- 9.2 Capgemini
- 9.3 Cisco
- 9.4 Cognizant
- 9.5 Deloitte
- 9.6 Hewlett Packard Enterprise
- 9.7 Hitachi
- 9.8 IBM
- 9.9 Microsoft
- 9.10 Oracle
- 9.11 SAP
- 9.12 SAS Institute
- 9.13 Tableau
- 9.14 Teradata
- 9.15 TIBCO


