
|
시장보고서
상품코드
1667043
자율주행 버스 시장 기회, 성장 촉진요인, 산업 동향 분석, 예측(2025-2034년)Autonomous Bus Market Opportunity, Growth Drivers, Industry Trend Analysis, and Forecast 2025 - 2034 |
||||||
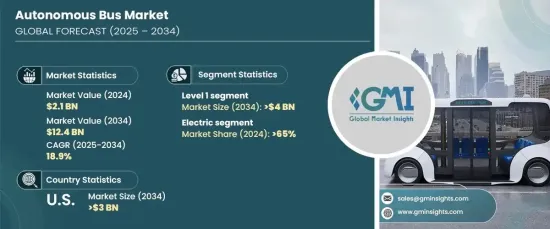
자율주행 버스 세계 시장은 2024년 21억 달러로 평가되며, 효율적이고 지속가능한 대중교통 솔루션에 대한 수요 증가로 인해 2025년부터 2034년까지 18.9%의 높은 CAGR을 기록할 것으로 예상됩니다. 전 세계 각국 정부가 교통 혼잡을 완화하고 탄소 배출을 억제하기 위해 스마트 시티 구상을 우선시하는 가운데, 자율주행 버스의 도입이 큰 견인차 역할을 하고 있습니다. 이러한 무인 차량은 도시 이동성에서 매우 중요한 진보를 상징하며, 노선 효율성 최적화, 운영 비용 절감, 안전성 향상을 통해 대중교통에 대한 혁신적인 접근 방식을 제공하고 있습니다.

급속한 도시화와 대도시 지역의 인구 밀도 증가로 인해 첨단 교통 솔루션의 필요성이 더욱 커지고 있습니다. 첨단 기술을 탑재한 자율주행 버스는 스마트 교통 관리 시스템과 원활하게 통합되어 연결성을 향상시키고, 지연을 최소화하며, 보다 원활한 출퇴근을 가능하게함으로써 기존 교통 시스템에 변화를 가져오고 있습니다. 또한, 온실가스 배출량 감축과 화석연료 의존도 감소에 대한 관심이 높아지면서 교통기관이 친환경적인 대안을 채택하도록 유도하고 있으며, 이는 시장 성장을 더욱 촉진하고 있습니다.
| 시장 범위 | |
|---|---|
| 시작 연도 | 2024년 |
| 예측 연도 | 2025-2034년 |
| 시작 금액 | 21억 달러 |
| 예상 금액 | 124억 달러 |
| CAGR | 18.9% |
시장은 자동화 정도에 따라 레벨 1, 레벨 2, 레벨 3, 레벨 4로 구분되며, 2024년에는 레벨 1 자동화가 40%의 시장 점유율을 차지하여 2034년까지 40억 달러의 시장 규모를 형성할 것으로 예측됩니다. 어댑티브 크루즈 컨트롤, 차선유지 보조와 같은 ADAS(첨단 운전자 보조 시스템)를 포함한 레벨 1 자동화는 비용 효율성과 기존 차량과의 원활한 통합으로 인해 교통 기관에 선호되는 선택이 되고 있습니다. 이러한 기능은 인프라를 크게 업그레이드하지 않고도 안전성과 운영 효율성을 높일 수 있기 때문에 광범위한 보급을 위한 매력적인 선택이 되고 있습니다.
차량 유형별로 보면 시장은 디젤 버스, 전기 버스, 하이브리드 버스로 분류되며, 2024년 점유율은 전기 버스가 65%로 1위를 차지했습니다. 전 세계 정부와 교통 사업자들이 지속가능성과 탄소 중립을 강조하면서 전기버스의 채택이 급증하고 있습니다. 세계 환경 규제와 배터리 기술의 발전에 힘입어 전기버스는 현재 주행거리, 효율성, 경제성이 개선되어 도시 및 지역 교통망에 가장 적합한 솔루션이 되고 있습니다.
미국 자율주행 버스 시장은 2024년 90%의 점유율을 차지하고 2034년에는 30억 달러에 달할 것으로 예상됩니다. 이러한 성장의 원동력은 연구개발에 대한 활발한 투자와 기술 혁신에 대한 강한 의지입니다. 미국의 잘 구축된 인프라와 자율주행차 테스트 지원 정책은 도시와 교외 지역 모두에서 자율주행 버스의 배치를 촉진하는 환경을 조성하여 미국을 이 혁신 시장의 선두주자로 확고히 자리매김하고 있습니다.
목차
제1장 조사 방법과 조사 범위
- 조사 설계
- 조사 접근법
- 데이터 수집 방법
- 기본 추정과 계산
- 기준 연도 산출
- 시장 추정의 주요 동향
- 예측 모델
- 1차 조사와 검증
- 1차 정보
- 데이터 마이닝 소스
- 시장 정의
제2장 주요 요약
제3장 업계 인사이트
- 생태계 분석
- 공급업체 상황
- 테크놀러지 프로바이더
- 서비스 프로바이더
- 유통업체
- 최종 용도
- 이익률 분석
- 가격 분석
- 비용 내역
- 테크놀러지와 혁신 전망
- 주요 뉴스와 대처
- 규제 상황
- 영향요인
- 성장 촉진요인
- 스마트 교통 시스템에 대한 정부 이니셔티브와 자금 조달
- 안전하고 효율적인 자율 항행을 가능하게 하는 AI와 IoT의 진보
- 자율주행 전기 버스를 촉진하는 환경 규제
- 도시 혼잡에 대처하기 위한 효율적인 공공교통기관에 대한 수요 상승
- 업계의 잠재적 리스크와 과제
- 자율주행 기술의 높은 개발·전개 비용
- 대규모 도입을 늦추는 규제와 안전성 우려
- 성장 촉진요인
- 성장 가능성 분석
- Porters 분석
- PESTEL 분석
제4장 경쟁 구도
- 소개
- 기업 점유율 분석
- 경쟁 포지셔닝 매트릭스
- 전략 전망 매트릭스
제5장 시장 추정과 예측 : 자율성별, 2021-2034년
- 주요 동향
- 레벨 1
- 레벨 2
- 레벨 3
- 레벨 4
제6장 시장 추정과 예측 : 연료별, 2021-2034년
- 주요 동향
- 디젤
- 전기
- 하이브리드
제7장 시장 추정과 예측 : 용도별, 2021-2032년
- 주요 동향
- 인터 시티
- 인트라 시티
제8장 시장 추정과 예측 : 지역별, 2021-2034년
- 주요 동향
- 북미
- 미국
- 캐나다
- 유럽
- 영국
- 독일
- 프랑스
- 스페인
- 이탈리아
- 러시아
- 북유럽
- 아시아태평양
- 중국
- 인도
- 일본
- 한국
- 뉴질랜드
- 동남아시아
- 라틴아메리카
- 브라질
- 멕시코
- 아르헨티나
- 중동 및 아프리카
- UAE
- 남아프리카공화국
- 사우디아라비아
제9장 기업 개요
- 버스 제조업체
- AB Volvo
- Apollo Baidu
- BYD Co. Ltd.
- Easymile
- MAN Truck &Bus
- Daimler AG
- Navya
- New Flyer
- Toyotas Motor Corporation
- Yutong Group Co. Ltd.
- 자율주행 솔루션·프로바이더
- Continental AG
- Denso Corporation
- Robert Bosch GmbH
- SB Drive Corp
- ST Engineering
The Global Autonomous Bus Market was valued at USD 2.1 billion in 2024 and is expected to witness a remarkable CAGR of 18.9% from 2025 to 2034, driven by the increasing demand for efficient and sustainable public transportation solutions. With governments worldwide prioritizing smart city initiatives to mitigate traffic congestion and curb carbon emissions, the adoption of autonomous buses has gained substantial traction. These driverless vehicles represent a pivotal advancement in urban mobility, offering an innovative approach to public transit by optimizing route efficiency, reducing operational costs, and enhancing safety.
Rapid urbanization, coupled with rising population density in metropolitan areas, has further escalated the need for advanced transit solutions. Autonomous buses, equipped with cutting-edge technologies, are transforming traditional transportation systems by seamlessly integrating with smart traffic management systems to improve connectivity, minimize delays, and ensure a smoother commuting experience. The increasing focus on reducing greenhouse gas emissions and dependency on fossil fuels is also pushing transit agencies to adopt these eco-friendly alternatives, further driving market growth.
| Market Scope | |
|---|---|
| Start Year | 2024 |
| Forecast Year | 2025-2034 |
| Start Value | $2.1 Billion |
| Forecast Value | $12.4 Billion |
| CAGR | 18.9% |
The market is segmented into Level 1, Level 2, Level 3, and Level 4 autonomy, each offering varying degrees of automation. In 2024, Level 1 automation accounted for a dominant 40% market share and is projected to generate USD 4 billion by 2034. Level 1 autonomy, which includes advanced driver assistance systems like adaptive cruise control and lane-keeping assistance, has become a preferred choice for transit agencies due to its cost-effectiveness and seamless integration into existing vehicles. These features enhance safety and operational efficiency without requiring significant infrastructure upgrades, making them an attractive option for widespread deployment.
In terms of vehicle type, the market is categorized into diesel, electric, and hybrid buses, with electric buses leading the pack at a commanding 65% share in 2024. The adoption of electric buses has surged as governments and transit operators worldwide emphasize sustainability and carbon neutrality. Supported by global environmental regulations and advancements in battery technology, electric buses now offer improved range, efficiency, and affordability, making them the go-to solution for urban and regional transportation networks.
The United States autonomous bus market held an impressive 90% share in 2024 and is forecast to reach USD 3 billion by 2034. This growth is fueled by robust investments in research and development, combined with a strong commitment to technological innovation. The country's well-established infrastructure and supportive policies for autonomous vehicle testing have created a conducive environment for the deployment of autonomous buses in both urban and suburban areas, cementing the US as a leader in this transformative market.
Table of Contents
Chapter 1 Methodology & Scope
- 1.1 Research design
- 1.1.1 Research approach
- 1.1.2 Data collection methods
- 1.2 Base estimates and calculations
- 1.2.1 Base year calculation
- 1.2.2 Key trends for market estimates
- 1.3 Forecast model
- 1.4 Primary research & validation
- 1.4.1 Primary sources
- 1.4.2 Data mining sources
- 1.5 Market definitions
Chapter 2 Executive Summary
- 2.1 Industry 3600 synopsis, 2021 - 2034
Chapter 3 Industry Insights
- 3.1 Industry ecosystem analysis
- 3.2 Supplier landscape
- 3.2.1 Technology providers
- 3.2.2 Service providers
- 3.2.3 Distributors
- 3.2.4 End use
- 3.3 Profit margin analysis
- 3.4 Pricing analysis
- 3.5 Cost Breakdown
- 3.6 Technology & innovation landscape
- 3.7 Key news & initiatives
- 3.8 Regulatory landscape
- 3.9 Impact forces
- 3.9.1 Growth drivers
- 3.9.1.1 Government Initiatives and Funding for smart transportation systems
- 3.9.1.2 Advancements in AI and IoT enabling safe and efficient autonomous navigation
- 3.9.1.3 Environmental regulations promoting autonomous electric buses
- 3.9.1.4 Growing demand for efficient public transit to address urban congestion
- 3.9.2 Industry pitfalls & challenges
- 3.9.2.1 High development and deployment costs of autonomous technology
- 3.9.2.2 Regulatory and safety concerns delaying large-scale adoption
- 3.9.1 Growth drivers
- 3.10 Growth potential analysis
- 3.11 Porter’s analysis
- 3.12 PESTEL analysis
Chapter 4 Competitive Landscape, 2024
- 4.1 Introduction
- 4.2 Company market share analysis
- 4.3 Competitive positioning matrix
- 4.4 Strategic outlook matrix
Chapter 5 Market Estimates & Forecast, By Autonomy, 2021 - 2034 ($Bn, Units)
- 5.1 Key trends
- 5.2 Level 1
- 5.3 Level 2
- 5.4 Level 3
- 5.5 Level 4
Chapter 6 Market Estimates & Forecast, By Fuel, 2021 - 2034 ($Bn, Units)
- 6.1 Key trends
- 6.2 Diesel
- 6.3 Electric
- 6.4 Hybrid
Chapter 7 Market Estimates & Forecast, By Application, 2021 - 2032 ($Bn, Units)
- 7.1 Key trends
- 7.2 Intercity
- 7.3 Intracity
Chapter 8 Market Estimates & Forecast, By Region, 2021 - 2034 ($Bn, Units)
- 8.1 Key trends
- 8.2 North America
- 8.2.1 U.S.
- 8.2.2 Canada
- 8.3 Europe
- 8.3.1 UK
- 8.3.2 Germany
- 8.3.3 France
- 8.3.4 Spain
- 8.3.5 Italy
- 8.3.6 Russia
- 8.3.7 Nordics
- 8.4 Asia Pacific
- 8.4.1 China
- 8.4.2 India
- 8.4.3 Japan
- 8.4.4 South Korea
- 8.4.5 ANZ
- 8.4.6 Southeast Asia
- 8.5 Latin America
- 8.5.1 Brazil
- 8.5.2 Mexico
- 8.5.3 Argentina
- 8.6 MEA
- 8.6.1 UAE
- 8.6.2 South Africa
- 8.6.3 Saudi Arabia
Chapter 9 Company Profiles
- 9.1 Bus Manufacturers
- 9.1.1 AB Volvo
- 9.1.2 Apollo Baidu
- 9.1.3 BYD Co. Ltd.
- 9.1.4 Easymile
- 9.1.5 MAN Truck & Bus
- 9.1.6 Daimler AG
- 9.1.7 Navya
- 9.1.8 New Flyer
- 9.1.9 Toyotas Motor Corporation
- 9.1.10 Yutong Group Co. Ltd.
- 9.2 Autonomous driving solution providers
- 9.2.1 Continental AG
- 9.2.2 Denso Corporation
- 9.2.3 Robert Bosch GmbH
- 9.2.4 SB Drive Corp
- 9.2.5 ST Engineering
