|
시장보고서
상품코드
1698282
전기 상용차 시장 : 시장 기회, 성장 촉진요인, 산업 동향 분석, 예측(2025-2034년)Electric Commercial Vehicle Market Opportunity, Growth Drivers, Industry Trend Analysis, and Forecast 2025 - 2034 |
||||||
세계의 전기 상용차 시장은 2024년 723억 달러로 평가되었으며, 2025-2034년 12.7%의 연평균 복합 성장률(CAGR)로 확대될 것으로 예상됩니다.
세계 각국의 정부는 보조금, 세액공제, 채용을 장려하기 위한 정책을 통해 이 성장을 추진하고 있습니다. 배출 삭감 목표, 탄소 및 뉴트럴에 대한 약속, 규제상 인센티브가 기업이나 차량 운행 회사에 전동 차량에 대한 투자를 재촉하고 있습니다. 보조금이 포함된 충전 인프라, 도로세 면제, 재정 지원 프로그램을 통해 전기 상용차는 기존의 연료식 선택지를 대체하는 비용 효율적인 선택지가 되고 있습니다.

기술의 진보 및 재료 관리의 개선에 의한 배터리의 비용 저하에 의해 구입하기 쉬운 가격이 되고 있습니다.배터리의 효율은 향상해, 항속 거리의 연장과 차량 성능의 향상으로 연결되었습니다. 충전 네트워크의 확대 및 배터리 스왑 기술의 진보로 더욱 보급이 진행되고 있습니다. 급속 충전 솔루션 및 신재생 에너지 통합에 대한 민관의 투자로 전기 상용차는 보다 실용적으로 되고 있습니다. 2024년 397억 달러로 평가된 EV 충전소 시장은 2034년 3,500억 달러를 넘어설 것으로 전망됩니다.
| 시장 규모 | |
|---|---|
| 시작 연도 | 2024년 |
| 예측 연도 | 2025-2034년 |
| 시작 금액 | 723억 달러 |
| 예측 금액 | 2,357억 달러 |
| CAGR | 12.7% |
전기 상용차에는 픽업 트럭, 트럭, 밴, 버스가 포함되어 있습니다. 시장의 36% 이상을 차지하는 밴은 2034년까지 500억 달러를 넘어설 것으로 예상되고 있습니다. 그 컴팩트한 사이즈 및 조종성으로 도시 지역의 물류 및 라스트 마일 배달에 이상적입니다. 기업들은 저배출가스 지역 규제를 준수하면서 연료비 및 유지비를 절감하기 위해 전기 밴으로의 이행을 추진하고 있습니다. 금융 우대 조치나 면세 조치는 플릿 사업자의 구입 용이성을 더욱 높이고 있습니다.
배터리용량 세분화에는 100kWh 미만, 101-250kWh, 251-400kWh, 401-550kWh, 550kWh 이상이 포함됩니다. 100kWh 미만의 카테고리가 2024년에는 주류가 되었으며, 220억 달러의 수익을 창출했습니다. 배터리 팩의 경량화는 에너지 효율, 차량의 조작성, 성능을 향상시킵니다. 또한 충전 속도도 빠르기 때문에 대부분의 충전 네트워크에 대응할 수 있습니다. 1회 충전으로 250-400마일이라는 최적의 항속거리는 실용성과 비용 대비 효과의 균형을 이루고 있으며, 소형 배터리 팩은 도시형 모빌리티나 상용 밴에 바람직한 선택지가 되고 있습니다.
전기 상용차는 배터리 전기자동차(BEV), 연료전지 전기자동차(FCEV), 하이브리드 상용 전기자동차(HCEV)로 분류됩니다. BEV는 유지비 및 운전효율이 낮아 2024년에는 시장의 50%를 차지했습니다. 하이브리드차 및 연료 전지차보다 가동 부품이 적은 BEV는, 개인과 플릿 운용자 쌍방에 있어서 장기적인 경비를 삭감합니다. 정부 보조금 및 배기가스 규제 강화가 BEV 채택을 더욱 뒷받침하고 있습니다. 도시 지역에서의 제로 이미션 존의 확대는 이 동향을 가속시켜, BEV를 상용 플릿에 있어서 주요한 선택사항으로 하고 있습니다.
최종 용도별 시장 부문에는 라스트 마일 배송, 현장 서비스, 배송 서비스, 장거리 운송, 쓰레기 수거 차량이 포함됩니다. 라스트 마일 배송 분야는 전자상거래의 확대 및 비용 대비 효과가 높은 지속 가능한 운송 솔루션에 대한 수요의 증가로 인해 CAGR 15%로 가장 빠른 속도로 성장할 것으로 보입니다. 전기식 배송 차량은 연료비 및 유지비가 저렴하고 혼잡한 곳에서도 쉽게 이동할 수 있어 저배출가스 규제에 준거하고 있습니다. 계획 루트를 최적화하고 충전 스케줄을 세울 수 있어 다운타임이 단축되고 업무 효율이 향상됩니다.
북미는 36%의 점유율로 세계의 전기 상용차 시장을 선도하고 있으며, 미국은 262억 달러의 수익을 올렸습니다. 유리한 정책, 세액 공제, 보조금, 인프라 투자가 보급을 뒷받침하고 있습니다. 정부의 이니셔티브는 차량의 전력으로의 이행을 장려하고, 연방 정부의 자금 지원은 전국적인 EV 충전소의 확대를 지원하고 있습니다. 그 결과, 미국은 지속 가능한 교통수단으로의 세계적 전환에 있어서 주요 기업으로 남아 있습니다.
목차
제1장 조사 방법 및 조사 범위
- 조사 디자인
- 조사 접근
- 데이터 수집 방법
- 기본 추정 및 계산
- 기준 연도 산출
- 시장 추계 주요 동향
- 예측 모델
- 1차 조사 및 검증
- 시장 범위 및 정의
제2장 주요 요약
제3장 업계 인사이트
- 생태계 분석
- 공급자의 상황
- 원재료 공급자
- 부품 공급자
- 제조업체
- 기술 제공업체
- 최종 용도
- 이익률 분석
- 공급자의 상황
- 기술 및 혁신의 전망
- 특허 분석
- 규제 상황
- 가격 동향
- 영향요인
- 성장 촉진요인
- 정부 정책 및 인센티브
- 배터리 비용 저감
- 기업의 지속가능성 목표 및 ESG 규정 준수
- 도시화 및 라스트 마일 배송 증가
- 기술의 진보
- 업계의 잠재적 위험 및 과제
- 규제 및 법적 장애물
- 높은 개발 비용
- 성장 촉진요인
- 성장 가능성 분석
- Porter's Five Forces 분석
- PESTEL 분석
제4장 경쟁 구도
- 서문
- 기업 점유율 분석
- 경쟁 포지셔닝 매트릭스
- 전략 전망 매트릭스
제5장 시장 추계 및 예측 : 차량별(2021-2034년)
- 주요 동향
- 픽업 트럭
- 트럭
- 밴
- 버스 및 코치
제6장 시장 추계 및 예측 : 추진별(2021-2034년)
- 주요 동향
- BEV
- FCEV
- HCEV
제7장 시장 추계 및 예측 : 배터리 용량별(2021-2034년)
- 주요 동향
- 100KWH 미만
- 101-250 KWH
- 251-400 KWH
- 401-550 KWH
- 550KWH 이상
제8장 시장 추계 및 예측 : 최종 용도별(2021-2034년)
- 주요 동향
- 라스트 마일 배송
- 필드 서비스
- 물류 서비스
- 장거리 수송
- 쓰레기 수거차
제9장 시장 추계 및 예측 : 지역별(2021-2034년)
- 주요 동향
- 북미
- 미국
- 캐나다
- 유럽
- 영국
- 독일
- 프랑스
- 이탈리아
- 스페인
- 러시아
- 북유럽
- 아시아태평양
- 중국
- 인도
- 일본
- 호주
- 한국
- 동남아시아
- 라틴아메리카
- 브라질
- 멕시코
- 아르헨티나
- 중동 및 아프리카
- UAE
- 남아프리카
- 사우디아라비아
제10장 기업 프로파일
- AB Volvo
- Bollinger Motors
- BYD
- Dongfeng Motor
- Ford Motor
- Irizar Group
- Isuzu Motors
- IVECO
- Mercedes Benz
- Nikola
- Paccar
- Proterra
- Renault
- Rivian
- Scania
- Tata Motors
- Tesla
- VDL Groep
- Workhorse Group
- Yutong
The Global Electric Commercial Vehicle Market, valued at USD 72.3 billion in 2024, is expected to expand at a 12.7% CAGR between 2025 and 2034. Governments worldwide are driving this growth through subsidies, tax credits, and policies designed to encourage adoption. Emission reduction targets, carbon neutrality commitments, and regulatory incentives are prompting businesses and fleet operators to invest in electric fleets. Subsidized charging infrastructure, road tax exemptions, and financial support programs make electric commercial vehicles a cost-effective alternative to conventional fuel-powered options.
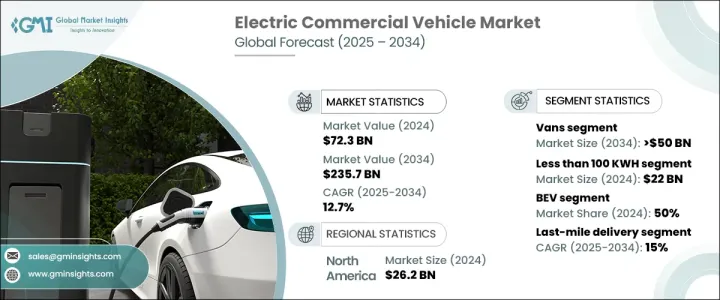
The declining cost of batteries due to technological advancements and improved material management has enhanced affordability. Battery efficiency has increased, leading to longer ranges and improved vehicle performance. Expanding charging networks and advancements in battery-swapping technology are further enabling wider adoption. Investments from public and private sectors in fast-charging solutions and renewable energy integration make electric commercial vehicles more practical. The EV charging station market, valued at USD 39.7 billion in 2024, is projected to surpass USD 350 billion by 2034.
| Market Scope | |
|---|---|
| Start Year | 2024 |
| Forecast Year | 2025-2034 |
| Start Value | $72.3 Billion |
| Forecast Value | $235.7 Billion |
| CAGR | 12.7% |
Electric commercial vehicles include pickup trucks, trucks, vans, and buses. Vans, accounting for over 36% of the market, are expected to exceed USD 50 billion by 2034. Their compact size and maneuverability make them ideal for urban logistics and last-mile deliveries. Businesses are transitioning to electric vans to lower fuel and maintenance costs while complying with low-emission zone regulations. Financial incentives and tax exemptions further enhance affordability for fleet operators.
Battery capacity segmentation includes less than 100 kWh, 101-250 kWh, 251-400 kWh, 401-550 kWh, and more than 550 kWh. The sub-100 kWh category dominated in 2024, generating USD 22 billion in revenue. Lighter battery packs enhance energy efficiency, vehicle handling, and performance. They also charge faster, making them compatible with most charging networks. The optimal range of 250-400 miles per charge balances practicality and cost-effectiveness, making smaller battery packs the preferred choice for urban mobility and commercial vans.
Electric commercial vehicles are classified into battery electric vehicles (BEV), fuel cell electric vehicles (FCEV), and hybrid commercial electric vehicles (HCEV). BEVs accounted for 50% of the market in 2024 due to lower maintenance costs and operational efficiency. With fewer moving parts than hybrids or fuel cell vehicles, BEVs reduce long-term expenses for both individuals and fleet operators. Government subsidies and stricter emission regulations further drive BEV adoption. The expansion of zero-emission zones in urban areas is accelerating this trend, making BEVs the primary choice for commercial fleets.
By end-use application, the market segments include last-mile delivery, field services, distribution services, long-haul transportation, and refuse trucks. The last-mile delivery sector is set to grow at the fastest rate of 15% CAGR, driven by e-commerce expansion and increased demand for cost-effective, sustainable transport solutions. Electric delivery vehicles offer lower fuel and maintenance costs, easy navigation in congested areas, and compliance with low-emission regulations. Their ability to optimize planned routes and schedule charging reduces downtime and enhances operational efficiency.
North America leads the global electric commercial vehicle market with a 36% share, with the U.S. generating USD 26.2 billion in revenue in 2024. Favorable policies, tax credits, grants, and infrastructure investments fuel adoption. Government initiatives encourage fleet transitions to electric power, while federal funding supports nationwide EV charging station expansion. As a result, the U.S. continues to be a major player in the global shift toward sustainable transportation.
Table of Contents
Chapter 1 Methodology & Scope
- 1.1 Research design
- 1.1.1 Research approach
- 1.1.2 Data collection methods
- 1.2 Base estimates & calculations
- 1.2.1 Base year calculation
- 1.2.2 Key trends for market estimation
- 1.3 Forecast model
- 1.4 Primary research and validation
- 1.4.1 Primary sources
- 1.4.2 Data mining sources
- 1.5 Market scope & definition
Chapter 2 Executive Summary
- 2.1 Industry 3600 synopsis, 2021 - 2034
Chapter 3 Industry Insights
- 3.1 Industry ecosystem analysis
- 3.1.1 Supplier landscape
- 3.1.1.1 Raw material suppliers
- 3.1.1.2 Component suppliers
- 3.1.1.3 Manufacturers
- 3.1.1.4 Technology providers
- 3.1.1.5 End use
- 3.1.2 Profit margin analysis
- 3.1.1 Supplier landscape
- 3.2 Technology & innovation landscape
- 3.3 Patent analysis
- 3.4 Regulatory landscape
- 3.5 Price trend
- 3.6 Impact forces
- 3.6.1 Growth drivers
- 3.6.1.1 Government policies & incentives
- 3.6.1.2 Declining battery costs
- 3.6.1.3 Corporate sustainability goals & ESG compliance
- 3.6.1.4 Urbanization & last-mile delivery growth
- 3.6.1.5 Technological advancements
- 3.6.2 Industry pitfalls & challenges
- 3.6.2.1 Regulatory and legal hurdles
- 3.6.2.2 High development costs
- 3.6.1 Growth drivers
- 3.7 Growth potential analysis
- 3.8 Porter's analysis
- 3.9 PESTEL analysis
Chapter 4 Competitive Landscape, 2024
- 4.1 Introduction
- 4.2 Company market share analysis
- 4.3 Competitive positioning matrix
- 4.4 Strategic outlook matrix
Chapter 5 Market Estimates & Forecast, By Vehicle, 2021 - 2034 ($Bn, Units)
- 5.1 Key trends
- 5.2 Pickup trucks
- 5.3 Trucks
- 5.4 Vans
- 5.5 Buses & coaches
Chapter 6 Market Estimates & Forecast, By Propulsion, 2021 - 2034 ($Bn, Units)
- 6.1 Key trends
- 6.2 BEV
- 6.3 FCEV
- 6.4 HCEV
Chapter 7 Market Estimates & Forecast, By Battery Capacity, 2021 - 2034 ($Bn, Units)
- 7.1 Key trends
- 7.2 Less than 100 KWH
- 7.3 101-250 KWH
- 7.4 251-400 KWH
- 7.5 401-550 KWH
- 7.6 More than 550 KWH
Chapter 8 Market Estimates & Forecast, By End Use, 2021 - 2034 ($Bn, Units)
- 8.1 Key trends
- 8.2 Last-mile delivery
- 8.3 Field services
- 8.4 Distribution services
- 8.5 Long-haul transportation
- 8.6 Refuse trucks
Chapter 9 Market Estimates & Forecast, By Region, 2021 - 2034 ($Bn, Units)
- 9.1 Key trends
- 9.2 North America
- 9.2.1 U.S.
- 9.2.2 Canada
- 9.3 Europe
- 9.3.1 UK
- 9.3.2 Germany
- 9.3.3 France
- 9.3.4 Italy
- 9.3.5 Spain
- 9.3.6 Russia
- 9.3.7 Nordics
- 9.4 Asia Pacific
- 9.4.1 China
- 9.4.2 India
- 9.4.3 Japan
- 9.4.4 Australia
- 9.4.5 South Korea
- 9.4.6 Southeast Asia
- 9.5 Latin America
- 9.5.1 Brazil
- 9.5.2 Mexico
- 9.5.3 Argentina
- 9.6 MEA
- 9.6.1 UAE
- 9.6.2 South Africa
- 9.6.3 Saudi Arabia
Chapter 10 Company Profiles
- 10.1 AB Volvo
- 10.2 Bollinger Motors
- 10.3 BYD
- 10.4 Dongfeng Motor
- 10.5 Ford Motor
- 10.6 Irizar Group
- 10.7 Isuzu Motors
- 10.8 IVECO
- 10.9 Mercedes Benz
- 10.10 Nikola
- 10.11 Paccar
- 10.12 Proterra
- 10.13 Renault
- 10.14 Rivian
- 10.15 Scania
- 10.16 Tata Motors
- 10.17 Tesla
- 10.18 VDL Groep
- 10.19 Workhorse Group
- 10.20 Yutong