


|
시장보고서
상품코드
1740791
질산화 및 유레아제 억제제 시장 기회와 성장 촉진 요인, 산업 동향 분석, 예측(2025-2034년)Nitrification and Urease Inhibitors Market Opportunity, Growth Drivers, Industry Trend Analysis, and Forecast 2025 - 2034 |
||||||
세계의 질산화 및 유레아제 억제제 시장은 2024년에 35억 달러로 평가되었고, 농업에서의 질소 이용 효율을 높이는 긴급성 증가와 지속 가능한 농법으로의 전환 증가로 CAGR 5.2%로, 2034년에는 58억 달러에 이를 것으로 예측되고 있습니다. 집은 작물의 수율을 해치지 않고 투입 자재의 사용량을 최적화하는 혁신적인 툴을 요구하고 있습니다. 수질을 지원하는 능력뿐만 아니라 낭비를 생략하고 에이커 당 수율을 늘림으로써 수익성을 개선하는 역할도 수행함으로써 지지를 모으고 있습니다. 농업 시스템에 필수적입니다. 업계가 보다 스마트하고 기후 변화에 강한 기술에 대한 투자를 계속하는 가운데, 시장은 지속가능성의 목표와 경제성의 융합으로부터 혜택을 받게 되어, 농업 관련 기업과 소규모 농가 모두에게 기회를 창출할 수 있을 것으로 예상됩니다.
수 년에 걸쳐 농가는 휘발과 용출에 의한 질소의 손실이라는 큰 과제에 직면해 왔습니다.이들은 비료 효율을 저하시킬 뿐만 아니라 환경에도 악영향을 미칩니다. 북미 및 아시아태평양과 같은 주요 농업 지역 정부는 질소 안정제의 사용을 촉진하는 보조금과 지속가능성 이니셔티브를 통해 이러한 전환을 적극적으로 지원하고 있습니다.
| 시장 범위 | |
|---|---|
| 시작 연도 | 2024년 |
| 예측 연도 | 2025-2034년 |
| 시작 금액 | 35억 달러 |
| 예측 금액 | 58억 달러 |
| CAGR | 5.2% |
비용 의식이 높은 농가에게 투입 비용을 늘리지 않고 작물 수율을 극대화할 수 있는 질소 억제제는 매우 매력적인 투자 대상입니다. 솔루션의 중요성이 커지고 있습니다. 환경 면에서의 이점 외에도 이러한 제품은 맞춤형 비료 블렌드와 잎 표면 살포 및 관주와 같은 고급 공급 방법과 같은 진화하는 농학적 기술에 부합하며 다양한 농업 환경에서 광범위한 채택을 촉진합니다.
2024년에는 비료 부문이 시장의 59.5%를 차지했으며, 이는 바람직한 비료 방법으로서의 인기를 반영하고 있습니다. 농업 시스템과 효율성과 일관성이 중요한 고가치 작물 생산자에게 특히 인기가 있습니다.
다양한 양분 유형 중에서 질소 억제제는 2024년에 가장 큰 시장 점유율을 획득했으며, 전체의 39.5%를 차지했습니다. 양질의 질소 이용 가능한 상태를 길게 유지함으로써 작물의 양분 흡수 효율을 높여 생산성을 향상시키는 동시에 수역과 생태계에 대한 악영향을 줄입니다.
아시아태평양은 높은 농업활동, 적극적인 정부정책, 고도의 농법에 대한 수요 증가로 2024년 세계 시장을 선도해 34.3%의 점유율을 확보했습니다. 한편, 북미와 유럽 시장은 엄격한 환경 규제와 정밀 농업 기술의 보급에 견인되어 견고한 성장을 이어가고 있습니다.
Solvay SA, BASF SE, Dow, Koch Fertilizers LLC, DuPont 등의 유력 기업은 각 지역의 농업 요구에 맞게 맞춤형 솔루션을 개발하여 적극적으로 시장을 확대하고 있습니다.이들 기업은 비료 제조업체 및 농업 기술 기업과 파트너십을 맺고, 장기적인 바이오 기반 기술에 투자하며, 농부 교육 프로그램을 지원하고 있습니다.
목차
제1장 조사 방법과 범위
제2장 주요 요약
제3장 업계 인사이트
- 생태계 분석
- 밸류체인에 영향을 주는 요인
- 이익률 분석
- 혁신
- 장래의 전망
- 제조업자
- 리셀러
- 무역에 미치는 영향
- 무역량의 혼란
- 보복 조치
- 업계에 미치는 영향
- 공급측의 영향(원재료)
- 주요 원재료의 가격 변동
- 공급망 재구성
- 생산 비용에 미치는 영향
- 공급측의 영향(원재료)
- 수요측의 영향(판매가격)
- 최종 시장에의 가격 전달
- 시장 점유율 동향
- 소비자의 반응 패턴
- 영향을 받는 주요 기업
- 전략적인 업계 대응
- 공급망 재구성
- 가격 설정 및 제품 전략
- 정책관여
- 전망과 향후 검토 사항
- 공급자의 상황
- 이익률 분석
- 주요 뉴스와 대처
- 규제 상황
- 영향요인
- 성장 촉진요인
- 억제제와 첨단 비료 기술의 통합
- 지속가능하고 환경친화적인 농업에 대한 수요 증가
- 바이오 베이스 및 이중 기능 처방의 혁신
- 업계의 잠재적 위험 및 과제
- 농가들 사이의 인지도와 도입의 한계
- 제품 비용이 높고, 액세스가 제한되어 있다
- 성장 촉진요인
- 성장 가능성 분석
- Porter's Five Forces 분석
- PESTEL 분석
제4장 경쟁 구도
- 소개
- 기업의 시장 점유율 분석
- 경쟁 포지셔닝 매트릭스
- 전략적 전망 매트릭스
제5장 시장 추정 및 예측 : 방법별, 2021년-2034년
- 주요 동향
- 시비 관수
- 잎면 살포
제6장 시장 추정 및 예측 : 영양소별, 2021년-2034년
- 주요 동향
- 질소
- 암모니아
- 질산염
- 우레아
- 기타
제7장 시장 추정 및 예측 :작물별, 2021년-2034년
- 주요 동향
- 식용작물
- 환금작물
- 원예
- 섬유 작물
- 기타
제8장 시장 추정 및 예측 : 지역별, 2021년-2034년
- 주요 동향
- 북미
- 미국
- 캐나다
- 유럽
- 독일
- 영국
- 프랑스
- 스페인
- 이탈리아
- 네덜란드
- 아시아태평양
- 중국
- 인도
- 일본
- 호주
- 한국
- 라틴아메리카
- 브라질
- 멕시코
- 아르헨티나
- 중동 및 아프리카
- 사우디아라비아
- 남아프리카
- 아랍에미리트(UAE)
제9장 기업 프로파일
- BASF SE
- Dow
- DuPont
- Solvay SA
- Koch Fertilizers LLC
- Evonik
- National Fertilizers Limited
- Nico Orgo Manures
- Compo Expert GmbH
- Eco Agro
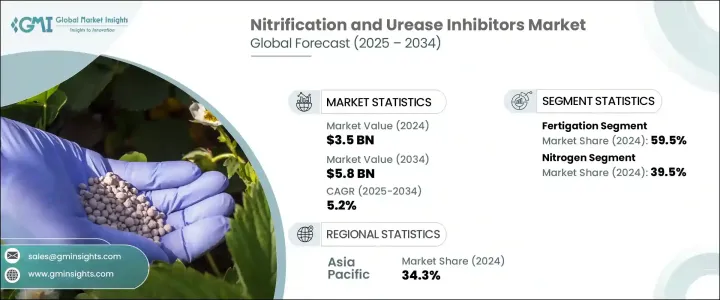
The Global Nitrification and Urease Inhibitors Market was valued at USD 3.5 billion in 2024 and is estimated to grow at a CAGR of 5.2% to reach USD 5.8 billion by 2034, driven by the growing urgency to enhance nitrogen use efficiency in agriculture and the increasing shift toward sustainable farming practices. This market is witnessing strong momentum as both environmental and economic pressures compel the agricultural sector to adopt more efficient nutrient management strategies. As the global population rises and arable land becomes scarcer, farmers are looking for innovative tools to optimize input usage without compromising crop yields. Nitrification and urease inhibitors are emerging as critical solutions, offering enhanced fertilizer performance and helping prevent nitrogen loss through leaching and volatilization. These inhibitors are gaining traction not only for their ability to support soil health and water quality but also for their role in improving profitability by reducing waste and boosting yield per acre. Moreover, global concerns over greenhouse gas emissions and water pollution have further propelled demand, making these products essential in modern precision agriculture systems. As the industry continues to invest in smarter, climate-resilient technologies, the market is set to benefit from the convergence of sustainability goals and economic viability, creating opportunities for both agribusinesses and small-scale farmers.

Over the years, farmers have faced significant challenges with nitrogen loss caused by volatilization and leaching, which not only reduce fertilizer efficiency but also harm the environment. In response, the agriculture sector is rapidly adopting inhibitors that improve nutrient retention and reduce harmful emissions. Governments in major agricultural regions like North America and Asia Pacific are actively supporting this shift through subsidies and sustainability initiatives that promote the use of nitrogen stabilizers. These efforts aim to create a more resilient and environmentally responsible agricultural system.
| Market Scope | |
|---|---|
| Start Year | 2024 |
| Forecast Year | 2025-2034 |
| Start Value | $3.5 Billion |
| Forecast Value | $5.8 Billion |
| CAGR | 5.2% |
For cost-conscious farmers, the ability to maximize crop yield without inflating input costs makes these inhibitors a highly attractive investment. The growing competition for fertile farmland, coupled with rising concerns about soil degradation and water contamination, has elevated the importance of reliable nitrogen management solutions. In addition to environmental benefits, these products align with evolving agronomic practices such as customized fertilizer blends and advanced delivery methods like foliar sprays and fertigation, encouraging widespread adoption across diverse farming environments.
In 2024, the fertigation segment accounted for a dominant 59.5% share of the market, reflecting its popularity as a preferred application method. This approach integrates fertilizer delivery with irrigation, allowing for precise and consistent nutrient distribution. Fertigation is especially popular in automated farming systems and among growers of high-value crops, where efficiency and consistency are critical. Inhibitors designed for fertigation are becoming increasingly water-soluble, stable, and responsive to varying pH levels and temperatures, making them ideal for precision agriculture applications.
Among the different nutrient types, nitrogen inhibitors captured the largest market share in 2024, holding 39.5% of the total. This strong performance underscores the critical importance of optimizing nitrogen use and curbing nutrient losses to the environment. By keeping nitrogen available in the soil for longer periods, these inhibitors help crops absorb nutrients more efficiently, boosting productivity while reducing negative impacts on water bodies and ecosystems. As a result, nitrogen inhibitors are now a central element in sustainable nutrient management strategies around the world.
The Asia Pacific region led the global market in 2024, securing a 34.3% share, thanks to its high agricultural activity, proactive government policies, and increasing demand for advanced farming practices. Countries across the region are pushing for technologies that minimize nitrogen runoff and improve crop performance, backed by strong policy frameworks and incentives. Meanwhile, markets in North America and Europe continue to demonstrate solid growth, driven by strict environmental regulations and widespread adoption of precision farming technologies.
Leading industry players such as Solvay S.A., BASF SE, Dow, Koch Fertilizers LLC, and DuPont are actively expanding their market reach by developing customized solutions tailored to regional agricultural needs. These companies are forging partnerships with fertilizer manufacturers and agri-tech firms, investing in long-lasting, bio-based technologies, and supporting farmer education programs. Through innovation and collaboration, they are playing a crucial role in shaping the future of sustainable agriculture.
Table of Contents
Chapter 1 Methodology & Scope
- 1.1 Market scope & definition
- 1.2 Base estimates & calculations
- 1.3 Forecast calculation
- 1.4 Data sources
- 1.4.1 Primary
- 1.4.2 Secondary
- 1.4.2.1 Paid sources
- 1.4.2.2 Public sources
- 1.5 Primary research and validation
- 1.5.1 Primary sources
- 1.5.2 Data mining sources
Chapter 2 Executive Summary
- 2.1 Industry synopsis, 2021-2034
Chapter 3 Industry Insights
- 3.1 Industry ecosystem analysis
- 3.1.1 Factor affecting the value chain
- 3.1.2 Profit margin analysis
- 3.1.3 Disruptions
- 3.1.4 Future outlook
- 3.1.5 Manufacturers
- 3.1.6 Distributors
- 3.1.7 Impact on trade
- 3.1.8 Trade volume disruptions
- 3.2 Retaliatory measures
- 3.3 Impact on the industry
- 3.3.1 Supply-Side impact (Raw Materials)
- 3.3.1.1 Price volatility in key materials
- 3.3.1.2 Supply chain restructuring
- 3.3.1.3 Production cost implications
- 3.3.1 Supply-Side impact (Raw Materials)
- 3.4 Demand-Side impact (Selling Price)
- 3.4.1 Price transmission to end markets
- 3.4.2 Market share dynamics
- 3.4.3 Consumer response patterns
- 3.5 Key companies impacted
- 3.6 Strategic industry responses
- 3.6.1 Supply chain reconfiguration
- 3.6.2 Pricing and product strategies
- 3.6.3 Policy engagement
- 3.7 Outlook and Future considerations
- 3.8 Supplier landscape
- 3.9 Profit margin analysis
- 3.10 Key news & initiatives
- 3.11 Regulatory landscape
- 3.12 Impact forces
- 3.12.1 Growth drivers
- 3.12.1.1 Integration of inhibitors with advanced fertilizer technologies
- 3.12.1.2 Rising demand for sustainable and eco-friendly agriculture
- 3.12.1.3 Innovation in bio-based and dual-function formulations
- 3.12.2 Industry pitfalls & challenges
- 3.12.2.1 Limited awareness and adoption among farmers
- 3.12.2.2 High product cost and limited accessibility
- 3.12.1 Growth drivers
- 3.13 Growth potential analysis
- 3.14 Porter's analysis
- 3.15 PESTEL analysis
Chapter 4 Competitive Landscape, 2024
- 4.1 Introduction
- 4.2 Company market share analysis
- 4.3 Competitive positioning matrix
- 4.4 Strategic outlook matrix
Chapter 5 Market Estimates and Forecast, By Method, 2021 – 2034 (USD Billion) (Kilo Tons)
- 5.1 Key trends
- 5.2 Fertigation
- 5.3 Foliar
Chapter 6 Market Estimates and Forecast, By Nutrient, 2021 – 2034 (USD Billion) (Kilo Tons)
- 6.1 Key trends
- 6.2 Nitrogen
- 6.3 Ammonia
- 6.4 Nitrate
- 6.5 Urea
- 6.6 Others
Chapter 7 Market Estimates and Forecast, By Crop Type, 2021 – 2034 (USD Billion) (Kilo Tons)
- 7.1 Key trends
- 7.2 Food crop
- 7.3 Cash crop
- 7.4 Horticulture
- 7.5 Fibre crop
- 7.6 Others
Chapter 8 Market Estimates and Forecast, By Region, 2021 – 2034 (USD Billion) (Kilo Tons)
- 8.1 Key trends
- 8.2 North America
- 8.2.1 U.S.
- 8.2.2 Canada
- 8.3 Europe
- 8.3.1 Germany
- 8.3.2 UK
- 8.3.3 France
- 8.3.4 Spain
- 8.3.5 Italy
- 8.3.6 Netherlands
- 8.4 Asia Pacific
- 8.4.1 China
- 8.4.2 India
- 8.4.3 Japan
- 8.4.4 Australia
- 8.4.5 South Korea
- 8.5 Latin America
- 8.5.1 Brazil
- 8.5.2 Mexico
- 8.5.3 Argentina
- 8.6 Middle East and Africa
- 8.6.1 Saudi Arabia
- 8.6.2 South Africa
- 8.6.3 UAE
Chapter 9 Company Profiles
- 9.1 BASF SE
- 9.2 Dow
- 9.3 DuPont
- 9.4 Solvay S.A
- 9.5 Koch Fertilizers LLC
- 9.6 Evonik
- 9.7 National Fertilizers Limited
- 9.8 Nico Orgo Manures
- 9.9 Compo Expert GmbH
- 9.10 Eco Agro
