|
시장보고서
상품코드
1693502
미국의 방출 조절 비료(CRF) 시장 : 시장 점유율 분석, 산업 동향 및 통계, 성장 예측(2025-2030년)United States Controlled Release Fertilizer - Market Share Analysis, Industry Trends & Statistics, Growth Forecasts (2025 - 2030) |
||||||
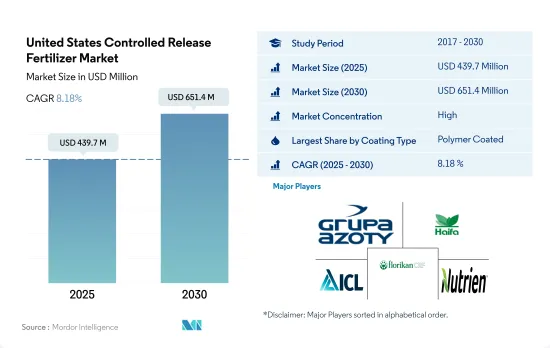
미국의 방출 조절 비료 시장 규모는 2025년에 4억 3,970만 달러로 추정되고, 2030년에는 6억 5,140만 달러에 이를 것으로 예측되며, 예측 기간인 2025-2030년 CAGR 8.18%로 성장할 것으로 예측됩니다.

질소와 인의 용출을 줄이는 CRF의 효율성은 시장 성장을 가속
- 미국의 방출 조절 비료 시장 규모는 2022년에 4억 2,870만 달러에 달했습니다. 환경영향을 경감한다는 농업 부문에 대한 압력의 고조와 영양 효율의 향상 및 정확한 시용이라는 이점이 맞물려 시 장가치는 2023-2030년 8.0%의 견조한 CAGR로 추이할 것으로 예측되고 있습니다.
- 방출 제어 비료는 완만하고 장시간의 양분 방출을 실현하여 작물이 성장주기를 통해 중요한 요소를 안정적으로 공급할 수 있도록 합니다. 양분의 용출과 유출을 억제함으로써 이러한 비료는 밭농사가 환경에 미치는 영향을 경감하는 데 매우 중요한 역할을 하며, 특히 수질이나 오염에 대한 우려에 대처하는 데 중요합니다.
- 농장 시험은 코팅된 방출 조절 비료가 코팅되지 않은 비료보다 우수함을 보여주었으며, 질소 기반 비료에서는 69.0%, 인산 기반 비료에서는 82.0%도 용출을 줄였습니다. 대조적으로 코팅되지 않은 기존 요소는 휘발에 의해 암모니아 함량의 최대 40%를 잃을 수 있습니다. 다년간의 광범위한 시험에 의해 코팅 요소는 암모니아 손실을 최소 95.0% 줄일 수 있음이 일관되게 실증되고 있습니다.
- 2022년에는 폴리머 코팅이 미국의 방출 조절 비료 시장의 76.4%를 차지했으며, 압도적인 점유율을 차지하고 있습니다. 환경과 비용에 대한 배려가 폴리머 코팅된 방출 제어 비료의 수요를 견인하고 있습니다. 폴리머 코팅 분야는 2023-2030년 7.7%의 건전한 성장률이 전망되고 있습니다.
- 미국에서는 비료의 과잉 축적에 기인하는 환경에 대한 영향을 억제하는 것을 목적으로 한 정부 규제에 의해 방출 조절 비료 수요가 급증하고 있습니다.
미국의 방출 조절 비료 시장 동향
대두와 옥수수는 미국에서 재배되는 2대 작물입니다.
- 미국에서는 인구가 2020년 3억 3,590만 명에서 2022년에는 3억 3,820만 명으로 증가했습니다. 2000년 이후 농지의 총 면적은 5,000만 에이커 가까이 감소하여 2022년에는 8억 9,340만 에이커에 이르렀습니다. 농지가 한정되어 있다는 것은 농업 투입물을 사용하여 농업 생산성을 높일 필요가 있음을 보여줍니다. 작물의 생산성을 높이기 위해 오랫동안 비료가 사용되어 왔습니다. 미국의 주요 4개 작물은 옥수수, 면화, 대두, 밀이며 2022년 주요 작물 작부 면적의 65.7% 이상을 차지했습니다.
- 대두와 옥수수는 미국에서 재배되는 2대 작물입니다. 2022년에는 대두 재배 면적이 가장 많아 미국 전체 경지 면적의 25.8%를 차지했고, 그 다음으로 옥수수가 25.7%, 밀이 11.1%였습니다. 이 작물의 대부분은 인디애나 서부, 일리노이, 아이오와, 미주리, 네브래스카, 캔자스 동부를 커버하는 '콘벨트'라고 불리는 지역에서 재배되고 있습니다. 옥수수와 대두 생산이 이 지역을 지배하고 있습니다. 미국 농무부에 따르면 미국은 쌀의 주요 수출국이며, 그 재배의 대부분은 4개 지역에서 이루어지고 있습니다.
- 농업 자재 제조업체는 농가의 정확한 비료 살포를 지원하는 혁신적인 제품을 개발하고 있습니다. 이를 통해 농가는 효율성을 높이면서 재배 비용을 절감할 수 있습니다. 이 나라의 밭농사 산업은 헤아릴 수 없는 시장 포텐셜을 간직하고 있어, 정부로부터의 자금 원조나 지원이 증가하는 것으로, 이 분야의 작물 재배의 플러스 성장이 기대됩니다.
질소 결핍은 미국의 작물 면적 전체에서 가장 널리 보이는 작물 양분 문제 중 하나입니다.
- 미국의 농작물에 있어서 1차 양분(질소, 칼륨, 인)의 평균 시용량은 2022년에는 1헥타르당 약 166.61kg이 되었습니다. 이 중 질소가 45.93%를 차지하고 칼륨이 28.11%, 인이 25.96%로 그 뒤를 이었습니다.
- 농작물 중에서는 유채 및 카놀라가 돌출하고 있으며, 2022년의 평균 1차 양분 시용량은 헥타르당 284.92kg으로, 이 분야에서는 최고였습니다. 1차 양분 중에서는 질소가 앞서 있으며, 평균 시용량은 헥타르당 229.60kg입니다. 이 우위성은 질소가 엽록소와 아미노산의 중요한 구성요소이기 때문에 식물의 대사에 있어서 매우 중요한 역할을 담당하고 있는 것에 기인하고 있습니다.
- 미국에서는 옥수수 및 메이즈가 제2위의 농작물로, 유채 및 카놀라가 약간 차이로 계속되고 있습니다. 2022년 농가는 평균 ha당 245.40kg의 1차 양분을 사용하였습니다. 옥수수만으로 국내 농작물 총 생산량의 약 31.44%를 차지했습니다. 1차 양분의 적용에 관해서는 2022년 옥수수의 질소 요구량은 50.06%, 인은 23.77%, 칼리는 26.17%였습니다.
- 1차 영양소는 식물의 효소 기능, 세포 성장, 생화학적 과정의 강화에 있어 매우 중요한 역할을 합니다. 이러한 영양소가 결핍되면 식물의 건강에 큰 영향을 미치고 성장을 저해하며 작물의 수확을 방해할 수 있습니다. 생산성을 향상시킬 필요성이 높아짐에 따라 농작물에 대한 1차 영양소의 시용은 현저한 상승을 나타낼 것으로 예상됩니다.
미국의 방출 조절 비료 산업 개요
미국의 방출 조절 비료 시장은 상당히 통합되어 있으며 상위 5개사에서 89.58%를 차지하고 있습니다. 이 시장 주요 기업은 다음과 같습니다. Grupa Azoty S.A.(Compo Expert), Haifa Group, ICL Group Ltd, New Mountain Capital(Florikan)and Nutrien Ltd.(알파벳순 정렬)
기타 혜택
- 엑셀 형식 시장 예측(ME) 시트
- 3개월의 애널리스트 서포트
목차
제1장 주요 요약 및 주요 조사 결과
제2장 보고서 제안
제3장 서문
- 조사의 전제조건 및 시장 정의
- 조사 범위
- 조사 방법
제4장 주요 산업 동향
- 주요 작물의 작부 면적
- 농작물
- 원예작물
- 평균 양분 시용률
- 주요 양분
- 농작물
- 원예작물
- 주요 양분
- 규제 프레임워크
- 밸류체인 및 유통채널 분석
제5장 시장 세분화
- 코팅 유형별
- 폴리머 코팅
- 폴리머 유황 코팅
- 기타
- 작물 유형별
- 농작물
- 원예작물
- 잔디 및 관상용
제6장 경쟁 구도
- 주요 전략 동향
- 시장 점유율 분석
- 기업 상황
- 기업 프로파일
- AgroLiquid
- Grupa Azoty SA(Compo Expert)
- Haifa Group
- ICL Group Ltd
- New Mountain Capital(Florikan)
- Nutrien Ltd.
제7장 CEO에 대한 주요 전략적 질문
제8장 부록
- 세계 개요
- 개요
- Porter's Five Forces 분석 프레임워크
- 세계의 밸류체인 분석
- 시장 역학(DROs)
- 정보원 및 참고문헌
- 도표 일람
- 주요 인사이트
- 데이터 팩
- 용어집
The United States Controlled Release Fertilizer Market size is estimated at 439.7 million USD in 2025, and is expected to reach 651.4 million USD by 2030, growing at a CAGR of 8.18% during the forecast period (2025-2030).
The efficiency of CRFs in reducing nitrogen and phosphorus leaching propels market growth
- The market for controlled-release fertilizers in the United States was valued at USD 428.7 million in 2022. With mounting pressure on the agriculture sector to mitigate environmental repercussions, coupled with the benefits of enhanced nutrient efficiency and precise application, the market value is projected to witness a robust CAGR of 8.0% from 2023 to 2030.
- Controlled-release fertilizers offer a gradual and prolonged nutrient release, ensuring crops receive a consistent supply of vital elements throughout their growth cycle. By curbing nutrient leaching and runoff, these fertilizers play a pivotal role in reducing the environmental impact of field crop agriculture, particularly in addressing concerns about water quality and pollution.
- Field trials have shown that coated controlled-release fertilizers outperform their uncoated counterparts, reducing leaching by 69.0% for nitrogen-based fertilizers and 82.0% for phosphate-based ones. In contrast, uncoated conventional urea can lose up to 40% of its ammonia content through volatilization. Extensive testing over multiple years has consistently demonstrated that coated urea can slash ammonia losses by a minimum of 95.0%.
- In 2022, polymer coating dominated the United States controlled-release fertilizer market, accounting for 76.4% of the industry. Environmental and cost considerations are driving the demand for polymer-coated controlled-release fertilizers, thanks to the nation's focus on field crop cultivation. The polymer-coated segment is expected to witness a healthy growth rate of 7.7% from 2023 to 2030.
- The United States is witnessing a surge in demand for controlled-release fertilizers, propelled by government regulations aimed at curbing the environmental impact stemming from excessive fertilizer accumulation.
United States Controlled Release Fertilizer Market Trends
Soybean and corn are the two prominent crops grown in the United States
- In the United States, the population increased from 335.9 million in 2020 to 338.2 million in 2022. From 2000 onwards, the total farmland area decreased by almost 50 million acres, reaching a total of 893.4 million acres in 2022. The limited farmland indicates the need to increase agricultural productivity with the use of agri inputs. Fertilizers have been used for a long time to increase the productivity of crops. The four major crops in the United States are corn, cotton, soybean, and wheat, which account for more than 65.7% of the principal crop acreage in 2022.
- Soybean and corn are the two prominent crops grown in the United States. In 2022, soybean had the highest area under cultivation, accounting for 25.8% of the total arable land in the United States, followed by corn at 25.7% and wheat at 11.1%. The majority of these crops are grown in a region known as the "Corn Belt," which covers Western Indiana, Illinois, Iowa, Missouri, Eastern Nebraska, and Eastern Kansas. The production of corn (maize) and soybeans dominates this area. Additionally, the United States is a major exporter of rice, with most of the cultivation happening in four regions, three of which are in the South and one in California, according to the USDA.
- Manufacturers of farm inputs are developing innovative products to assist farmers with the precise application of fertilizers. This is helping farmers in reducing the cost of cultivation while increasing efficiency. The field crop industry of the country has immense market potential, and with increased government funding and support, it is expected to drive positive growth in crop cultivation in this area.
Nitrogen deficiency is one of the most prevalent crop nutrient problems across cropping areas in the United States
- The average application rate of primary nutrients (nitrogen, potassium, and phosphorus) in field crops in the United States stood at approximately 166.61 kg per hectare in the year 2022. Nitrogen represented 45.93% of this application, followed by potassium at 28.11% and phosphorus at 25.96% in the same year.
- Rapeseed/canola stands out among field crops, with an average primary nutrient application rate of 284.92 kg per hectare, the highest in this sector in 2022. Among the primary nutrients, nitrogen takes the lead, with an average application rate of 229.60 kg per hectare. This dominance can be attributed to nitrogen's pivotal role in plant metabolism, as it is a key component of both chlorophyll and amino acids.
- In the United States, corn/maize stands as the second-largest field crop, with rapeseed/canola following closely behind. On average, farmers applied 245.40 kg of primary nutrients per hectare in 2022. Corn alone contributes to around 31.44% of the nation's total field crop production. When it came to primary nutrient application, corn's nitrogen requirement accounted for 50.06%, phosphorus stood at 23.77%, and potash at 26.17% in 2022.
- Primary nutrients play a pivotal role in enhancing plant enzyme function, cellular growth, and biochemical processes. A deficiency in these nutrients can significantly impact plant health, stifle growth, and hamper crop yields. Given the rising need for increased productivity, the application of primary nutrients in field crops is expected to witness a notable uptick.
United States Controlled Release Fertilizer Industry Overview
The United States Controlled Release Fertilizer Market is fairly consolidated, with the top five companies occupying 89.58%. The major players in this market are Grupa Azoty S.A. (Compo Expert), Haifa Group, ICL Group Ltd, New Mountain Capital (Florikan) and Nutrien Ltd. (sorted alphabetically).
Additional Benefits:
- The market estimate (ME) sheet in Excel format
- 3 months of analyst support
TABLE OF CONTENTS
1 EXECUTIVE SUMMARY & KEY FINDINGS
2 REPORT OFFERS
3 INTRODUCTION
- 3.1 Study Assumptions & Market Definition
- 3.2 Scope of the Study
- 3.3 Research Methodology
4 KEY INDUSTRY TRENDS
- 4.1 Acreage Of Major Crop Types
- 4.1.1 Field Crops
- 4.1.2 Horticultural Crops
- 4.2 Average Nutrient Application Rates
- 4.2.1 Primary Nutrients
- 4.2.1.1 Field Crops
- 4.2.1.2 Horticultural Crops
- 4.2.1 Primary Nutrients
- 4.3 Regulatory Framework
- 4.4 Value Chain & Distribution Channel Analysis
5 MARKET SEGMENTATION (includes market size in Value in USD and Volume, Forecasts up to 2030 and analysis of growth prospects)
- 5.1 Coating Type
- 5.1.1 Polymer Coated
- 5.1.2 Polymer-Sulfur Coated
- 5.1.3 Others
- 5.2 Crop Type
- 5.2.1 Field Crops
- 5.2.2 Horticultural Crops
- 5.2.3 Turf & Ornamental
6 COMPETITIVE LANDSCAPE
- 6.1 Key Strategic Moves
- 6.2 Market Share Analysis
- 6.3 Company Landscape
- 6.4 Company Profiles
- 6.4.1 AgroLiquid
- 6.4.2 Grupa Azoty S.A. (Compo Expert)
- 6.4.3 Haifa Group
- 6.4.4 ICL Group Ltd
- 6.4.5 New Mountain Capital (Florikan)
- 6.4.6 Nutrien Ltd.
7 KEY STRATEGIC QUESTIONS FOR FERTILIZER CEOS
8 APPENDIX
- 8.1 Global Overview
- 8.1.1 Overview
- 8.1.2 Porter's Five Forces Framework
- 8.1.3 Global Value Chain Analysis
- 8.1.4 Market Dynamics (DROs)
- 8.2 Sources & References
- 8.3 List of Tables & Figures
- 8.4 Primary Insights
- 8.5 Data Pack
- 8.6 Glossary of Terms