


|
시장보고서
상품코드
1741030
지진 탐사 서비스 시장 : 시장 기회, 성장 촉진요인, 산업 동향 분석 및 예측(2025-2034년)Seismic Services Market Opportunity, Growth Drivers, Industry Trend Analysis, and Forecast 2025 - 2034 |
||||||
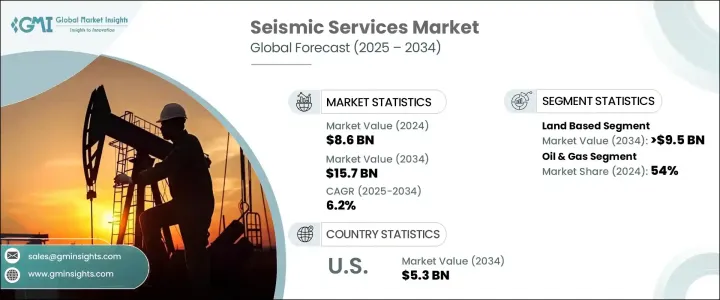
세계의 지진 탐사 서비스 시장은 2024년에는 86억 달러로 평가되었고, 2034년에는 157억 달러에 도달할 전망이며, CAGR 6.2%로 성장할 것으로 예측됩니다.
이것은 세계의 에너지 탐사 기술의 큰 시프트, 고해상도의 지하 이미징에 및 의존도 고조, 차세대 물리학 기술의 급속한 채용이 원동력이 되고 있습니다. 세계가 보다 데이터 주도의 탐사로 향하는 가운데, 지진 탐사 서비스는 에너지 개발 전략의 중요한 기둥으로 진화하고 있습니다. 오늘날의 오퍼레이터는 지하 구조에 대한 보다 신속하고 정확한 인사이트를 요구하고 있으며, 지진 탐사 공급자는 통합된 디지털 퍼스트 솔루션을 제공하도록 요구받고 있습니다. 에너지 부문이 화석 연료 및 신재생 에너지의 균형을 잡는다고 하는 큰 전환기를 맞이하고 있는 가운데, 지진 탐사 기술의 역할은 석유 및 가스에 머무르지 않고, 해상 풍력, 지열, 광업 등의 분야로도 확대되고 있습니다. 규제 의무화와 환경 평가에 힘입어 지속 가능한 탐사가 중시됨에 따라 지진 탐사의 기술 혁신에 대한 투자 흐름이 바뀌고 있습니다. 기업들은 3D나 4D 지진 탐사와 같은 고도의 이미징 기술을 채택할 뿐만 아니라 기계학습 및 AI를 데이터 처리에 도입해 업무의 합리화, 비용 절감, 의사결정 속도 향상을 도모하고 있습니다. 전 세계 에너지 수요가 복잡해지는 가운데 지진 서비스 시장은 보다 스마트하고 깨끗하고 효율적인 자원 탐사를 가능하게 하는 중요한 존재로 자리매김하고 있습니다.
원유 가격의 불확실성과 지정학적 시나리오의 변화는 탐사 예산과 지진 탐사 서비스량에 계속 영향을 미치고 있습니다. 혁신을 추진하고 능력을 확대하기 위해서는 서비스 회사와 에너지 생산자의 협력이 필수적입니다. 중요한 지진 탐사 장비 및 자재에 대한 관세는 운영 비용을 상승시키고, 세계 협력을 둔화시키며, 최첨단 기술에 대한 접근을 제한할 우려가 있습니다. 그렇다고 해도, 기업은 현지 조달 전략이나 디지털 혁신을 통해서 적응하는 방법을 찾아내고 있습니다.
| 시장 범위 | |
|---|---|
| 시작 연도 | 2024년 |
| 예측 연도 | 2025-2034년 |
| 시작 금액 | 86억 달러 |
| 예측 금액 | 157억 달러 |
| CAGR | 6.2% |
육상 기반의 지진 탐사 서비스가 업계를 지배할 것으로 예상되며, 예측 수익은 2034년까지 95억 달러에 달할 전망입니다. 이러한 조사는 비용 대비 효과가 뛰어나고 고도의 3D 및 4D 이미징을 통해 정확도가 향상되었기 때문에 상류 탐사에서는 여전히 필수적입니다. 토지 취득 기술에 있어서 계속적인 기술 혁신에 의해, 다양한 지형에서 상세한 지하 평가를 실시하는 것이 용이해져, 탐사 성과가 큰폭으로 향상되고 있습니다.
2024년에는 석유 및 가스 부문이 54%의 압도적 점유율을 차지했으며, 탐사 리스크의 저감과 자원 타겟의 개선을 목적으로 한 AI 주도의 지진 탐사 해석에 관한 워크플로우 증가가 그 원동력이 되고 있습니다. 또한 풍력발전과 지열발전 프로젝트에서는 환경영향 평가와 입지가능성 조사를 위한 지진 탐사 이미징에 대한 의존도가 높아지고 있으며, 지진 탐사 툴의 관련성이 업계 전체에 퍼지고 있다는 점이 돋보입니다.
미국의 지진 탐사 서비스 시장은 2024년에 29억 달러를 창출했으며, 2034년에는 53억 달러에 이를 것으로 예측되고 있습니다. 셰일 분지나 멕시코만 등의 앞바다 지역에서의 탐사와 생산이 계속해서 수요를 촉진하고 있습니다. 공급자는 기계 학습, 실시간 이미지 처리, 고급 데이터 처리 기술을 통합하여 생산성을 향상시키고, 특히 신재생 프로젝트의 규제 기준 강화에 대응하고 있습니다.
Halliburton, Paradigm Group BV, CGG, TGS, Gardline Limited, SLB, Fugro, Getech Group plc, PGS, Spectrum Geophysics, SAExploration, Ramboll Group A/S, NUVIA Dynamics Inc., Weatherford, China Oilfield Services Limited, EGS(International) Geophysics 등의 주요 기업은 시장에서의 프레즌스를 적극적으로 강화하고 있습니다. 각사의 전략에는 실시간 지진 데이터 분석에 대한 투자, 해외 능력 확대, 에너지 공급자와의 합작 사업 설립, AI를 활용한 데이터 워크플로우의 합리화, 지속 가능하고 저부하의 지진 탐사 기술에 의한 신재생 분야의 타겟화 등이 포함됩니다.
목차
제1장 조사 방법 및 범위
제2장 주요 요약
제3장 업계 인사이트
- 생태계 분석
- 트럼프 정권의 관세 분석
- 무역에 미치는 영향
- 무역량의 혼란
- 보복 조치
- 업계에 미치는 영향
- 공급측의 영향(원재료)
- 주요 원재료의 가격 변동
- 공급망 재구성
- 생산 비용에 미치는 영향
- 수요측의 영향(판매가격)
- 최종 시장에 대한 가격 전달
- 시장 점유율 동향
- 소비자의 반응 패턴
- 공급측의 영향(원재료)
- 영향을 받는 주요 기업
- 전략적인 업계 대응
- 공급망 재구성
- 가격 설정 및 제품 전략
- 정책관여
- 전망 및 향후 검토 사항
- 무역에 미치는 영향
- 규제 상황
- 업계에 미치는 영향요인
- 성장 촉진요인
- 업계의 잠재적 위험 및 과제
- 성장 가능성 분석
- Porter's Five Forces 분석
- PESTEL 분석
제4장 경쟁 구도
- 전략적 대시보드
- 혁신 및 지속가능성의 정세
제5장 시장 규모 및 예측 : 조사 유형별(2021-2034년)
- 주요 동향
- 육상 베이스
- 해양 베이스
제6장 시장 규모 및 예측 : 최종 용도별(2021-2034년)
- 주요 동향
- 석유 및 가스
- 광업
- 기타
제7장 시장 규모 및 예측 : 지역별(2021-2034년)
- 주요 동향
- 북미
- 미국
- 캐나다
- 유럽
- 영국
- 독일
- 프랑스
- 노르웨이
- 러시아
- 아시아태평양
- 중국
- 일본
- 인도
- 호주
- 중동 및 아프리카
- 아랍에미리트(UAE)
- 사우디아라비아
- 이라크
- 이란
- 남아프리카
- 라틴아메리카
- 브라질
- 아르헨티나
제8장 기업 프로파일
- Abitibi Geophysics
- China Oilfield Services Limited
- CGG
- Dawson Geophysical Company
- EGS(International) Ltd
- Fugro
- Getech Group plc
- Gardline Limited
- Halliburton
- NUVIA Dynamics Inc.
- PGS
- Paradigm Group BV
- Ramboll Group A/S
- SLB
- SAExploration
- Spectrum Geophysics
- TGS
- Weatherford
The Global Seismic Services Market was valued at USD 8.6 billion in 2024 and is estimated to grow at a CAGR of 6.2% to reach USD 15.7 billion by 2034, driven by major shifts in global energy exploration techniques, growing reliance on high-resolution subsurface imaging, and the rapid adoption of next-gen geophysical technologies. As the world moves toward more data-driven exploration, seismic services are evolving into a critical pillar of energy development strategies. Operators today demand faster, more accurate insights into subsurface structures, pushing seismic providers to deliver integrated, digital-first solutions. With the energy sector undergoing a major transition-balancing fossil fuels with renewables-the role of seismic technologies is expanding beyond oil and gas, penetrating sectors like offshore wind, geothermal, and mining. A rising emphasis on sustainable exploration, fueled by regulatory mandates and environmental assessments, is reshaping investment flows into seismic innovation. Companies are not only adopting advanced imaging techniques like 3D and 4D seismic but also infusing machine learning and AI into data processing to streamline operations, cut costs, and improve decision-making speed. As global energy demands grow more complex, the seismic services market is positioned as a crucial enabler of smarter, cleaner, and more efficient resource exploration.

Uncertainty in oil prices and shifting geopolitical scenarios continue to impact exploration budgets and seismic service volumes. Collaboration between service firms and energy producers remains vital to drive innovation and expand capabilities. Tariffs on critical seismic equipment and materials are increasing operational costs and could slow global cooperation, restricting access to cutting-edge technologies. Nevertheless, companies are finding ways to adapt through local sourcing strategies and digital innovation.
| Market Scope | |
|---|---|
| Start Year | 2024 |
| Forecast Year | 2025-2034 |
| Start Value | $8.6 Billion |
| Forecast Value | $15.7 Billion |
| CAGR | 6.2% |
Land-based seismic services are expected to dominate the industry, with projected revenues reaching USD 9.5 billion by 2034. These surveys remain essential in upstream exploration due to their cost-effectiveness and improved accuracy through advanced 3D and 4D imaging. Ongoing innovation in land acquisition technologies is making it easier to conduct detailed subsurface assessments across diverse terrains, significantly enhancing exploration outcomes.
In 2024, the oil and gas sector held a commanding 54% share, driven by rising workflow on AI-driven seismic analysis aimed at reducing exploration risks and improving resource targeting. The need for strategic minerals has fueled the adoption of seismic services in mining, while offshore wind and geothermal projects are increasingly relying on seismic imaging for environmental impact assessments and site viability studies, highlighting the broadening relevance of seismic tools across industries.
The U.S. Seismic Services Market generated USD 2.9 billion in 2024 and is projected to reach USD 5.3 billion by 2034. Exploration and production in shale basins and offshore areas such as the Gulf of Mexico continue to fuel demand. Providers are integrating machine learning, real-time imaging, and advanced data processing technologies to boost productivity and meet tightening regulatory standards, especially for renewable projects.
Leading players such as Halliburton, Paradigm Group B.V., CGG, TGS, Gardline Limited, SLB, Fugro, Getech Group plc, PGS, Spectrum Geophysics, SAExploration, Ramboll Group A/S, NUVIA Dynamics Inc., Weatherford, China Oilfield Services Limited, EGS (International) Ltd, Dawson Geophysical Company, and Abitibi Geophysics are actively consolidating their market presence. Their strategies include investing in real-time seismic data analytics, expanding offshore capabilities, forming joint ventures with energy providers, leveraging AI to streamline data workflows, and targeting the renewable sector through sustainable, low-impact seismic exploration techniques.
Table of Contents
Chapter 1 Methodology & Scope
- 1.1 Market definitions
- 1.2 Base estimates & calculations
- 1.3 Forecast calculation
- 1.4 Data sources
- 1.4.1 Primary
- 1.4.2 Secondary
- 1.4.2.1 Paid
- 1.4.2.2 Public
Chapter 2 Executive Summary
- 2.1 Industry synopsis, 2021 - 2034
Chapter 3 Industry Insights
- 3.1 Industry ecosystem analysis
- 3.2 Trump administration tariff analysis
- 3.2.1 Impact on trade
- 3.2.1.1 Trade volume disruptions
- 3.2.1.2 Retaliatory measures
- 3.2.2 Impact on the industry
- 3.2.2.1 Supply-side impact (raw materials)
- 3.2.2.1.1 Price volatility in key materials
- 3.2.2.1.2 Supply chain restructuring
- 3.2.2.1.3 Production cost implications
- 3.2.2.2 Demand-side impact (selling price)
- 3.2.2.2.1 Price transmission to end markets
- 3.2.2.2.2 Market share dynamics
- 3.2.2.2.3 Consumer response patterns
- 3.2.2.1 Supply-side impact (raw materials)
- 3.2.3 Key companies impacted
- 3.2.4 Strategic industry responses
- 3.2.4.1 Supply chain reconfiguration
- 3.2.4.2 Pricing and product strategies
- 3.2.4.3 Policy engagement
- 3.2.5 Outlook and future considerations
- 3.2.1 Impact on trade
- 3.3 Regulatory landscape
- 3.4 Industry impact forces
- 3.4.1 Growth drivers
- 3.4.2 Industry pitfalls & challenges
- 3.5 Growth potential analysis
- 3.6 Porter's analysis
- 3.6.1 Bargaining power of suppliers
- 3.6.2 Bargaining power of buyers
- 3.6.3 Threat of new entrants
- 3.6.4 Threat of substitutes
- 3.7 PESTEL analysis
Chapter 4 Competitive landscape, 2024
- 4.1 Strategic dashboard
- 4.2 Innovation & sustainability landscape
Chapter 5 Market Size and Forecast, By Survey Type, 2021 - 2034 (USD Million)
- 5.1 Key trends
- 5.2 Land based
- 5.3 Marine based
Chapter 6 Market Size and Forecast, By End Use, 2021 - 2034 (USD Million)
- 6.1 Key trends
- 6.2 Oil & gas
- 6.3 Mining
- 6.4 Others
Chapter 7 Market Size and Forecast, By Region, 2021 - 2034 (USD Million)
- 7.1 Key trends
- 7.2 North America
- 7.2.1 U.S.
- 7.2.2 Canada
- 7.3 Europe
- 7.3.1 UK
- 7.3.2 Germany
- 7.3.3 France
- 7.3.4 Norway
- 7.3.5 Russia
- 7.4 Asia Pacific
- 7.4.1 China
- 7.4.2 Japan
- 7.4.3 India
- 7.4.4 Australia
- 7.5 Middle East & Africa
- 7.5.1 UAE
- 7.5.2 Saudi Arabia
- 7.5.3 Iraq
- 7.5.4 Iran
- 7.5.5 South Africa
- 7.6 Latin America
- 7.6.1 Brazil
- 7.6.2 Argentina
Chapter 8 Company Profiles
- 8.1 Abitibi Geophysics
- 8.2 China Oilfield Services Limited
- 8.3 CGG
- 8.4 Dawson Geophysical Company
- 8.5 EGS (International) Ltd
- 8.6 Fugro
- 8.7 Getech Group plc
- 8.8 Gardline Limited
- 8.9 Halliburton
- 8.10 NUVIA Dynamics Inc.
- 8.11 PGS
- 8.12 Paradigm Group B.V.
- 8.13 Ramboll Group A/S
- 8.14 SLB
- 8.15 SAExploration
- 8.16 Spectrum Geophysics
- 8.17 TGS
- 8.18 Weatherford

